Serviços Personalizados
Journal
Artigo
Indicadores
-
 Citado por SciELO
 -
 Acessos
Links relacionados
-
 Similares em
SciELO
Compartilhar
Portugaliae Electrochimica Acta
versão impressa ISSN 0872-1904
Port. Electrochim. Acta vol.36 no.5 Coimbra set. 2018
https://doi.org/10.4152/pea.201805309
Corrosion Inhibition of Zn in a 0.5 M HCl Solution by Ailanthus Altissima Extract
A. S. Foudaa,* , S.M. Rashwanb , M.M.K. Darwishb and N.M. Armana
a Department of Chemistry, Faculty of Science, El-Mansoura University, El-Mansoura, Egypt
b Department of Chemistry, Faculty of Science, Suez Canal University, Ismailia, Egypt
Abstract
The inhibiting effect of Ailanthus altissima aqueous extract, as a corrosion inhibitor for Zn in a 0.5 M HCl solution, has been evaluated by weight loss (WL), hydrogen evolution (HE), potentiodynamic polarization (PP), electrochemical impedance spectroscopy (EIS) and electrochemical frequency modulation (EFM) techniques. Obtained results showed that this extract offered good protection against Zn corrosion, and exhibited high inhibition efficiencies. The IE was found to increase with an increasing extract dose. Results revealed that this extract acted as a mixed-type inhibitor, and adsorbed onto the Zn surface following Temkin isotherm. Obtained results were justified from the study of surface morphology.
Keywords: ailanthus altissima extract; HCl; Zn, corrosion inhibition, WL, HE, PP, EIS, EFM and surface morphology.
Introduction
A corrosion inhibitor is a chemical that interacts well with a metal surface, by an adsorption process, to form a thin film/layer that protects the metal surface reducing the movement/diffusion of ions to the latter, or increasing its electrical resistance [1-2]. Zn is one of the most important non-ferrous metals, which finds extensive use in metallic coating. Zn corrodes in a solution with a pH lower than 6 and higher than 12.5, but, within this range, the corrosion is very slow [3]. Under aggressive conditions, Zn metal undergoes corrosion, gaining white colored rust [4, 5]. Normally, white rust is observed in galvanized materials, and its occurrence remains a serious commercial problem. In controlling or slowing down the formation of white rust, the search for new inhibitors is essential [6]. A significant method to protect the metals from corrosion is the addition of species to the solution in contact with the surface, in order to inhibit the corrosion reaction and reduce the corrosion rate. To this end, the use of organic compounds containing nitrogen, oxygen, and/or sulfur, in a conjugated system as inhibitors to reduce corrosion attack, has received detailed attention [7-11]. Recently, a new type of corrosion inhibitors is being developed to comply with the environmental regulations on industrial consumption and development; thus, natural products, pharmaceutical ingredients and environment-friendly products have gained much attention as substances for green corrosion inhibitors that have high inhibition efficiencies [12, 13]. Plant extracts and organic species have therefore become important as an environmentally acceptable, readily available, and renewable source for a wide range of inhibitors [14-21]. They are the rich sources of ingredients which have very high inhibition efficiencies and are hence termed 'Green Inhibitors' [22]. Green corrosion inhibitors are biodegradable and do not contain heavy metals nor other toxic compounds [23].
The successful use of naturally occurring substances to inhibit the corrosion of metals in acidic and alkaline environments has been reported by some research groups [24-30], to mention but a few. Organic substances or biodegradable organic materials to be used as effective corrosion inhibitors for a wide number of metals have been one of the key subjects in our research group [31]. An example of green inhibitors is Ailanthus altissima, which has exhibited various biological properties, such as anti-proliferative, cytotoxic, anti-plasmodial, anti- malarial, anti-viral, antibacterial, anti-fungal, and analgesic activities [32]. Previous phytochemical investigations of A. altissima revealed the presence of alkaloids, terpenoids, steroids, and flavonoids [33]. Among these compounds, quassinoids and indole and β-carboline alkaloids are common major constituents of A. altissima [34-36]. Alkaloids from A. altissima are reported for their anti- herpes [37] and anti-mycotic properties [38], and for their action on the rate of intestinal blood flow in rabbits [39]. Indole and β-carboline alkaloids have shown inhibitory activity on cyclic adenosine monophosphate (CAMP) phosphor diesters [40]. Further studies on the basic components of the leaves of A. altissima have been carried out. Altissima was isolated into a new canthinone- type alkaloid (1), and includes 15 known compounds (Scheme (1)).
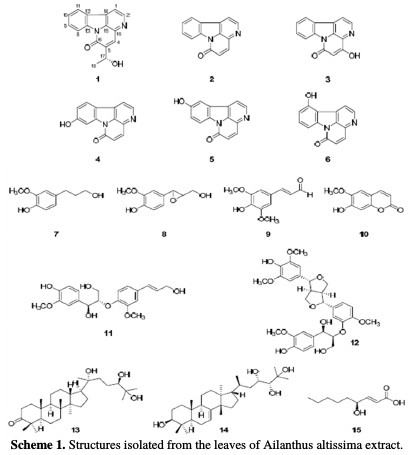
This research aims to study the effects of adsorption and corrosion inhibition of A. altissima leaves extract on a Zn metal surface in a 0.5 M HCl environment.
Experimental
Preparation of specimens
The Zn metal specimens have the following composition: 1.03% Pb, 0.04% Cd, 0.001% Fe, 0.003% Cu and the remainder being Zn. Samples with the size of 2 cm × 2 cm were used for WL and electrochemical studies. Zn metal specimens were polished with a series of emery papers of various grades from 400 to 1200, degreased with absolute ethanol and dried.
Preparation of Ailanthus altissima extract and of the aggressive solution An aqueous extract of A. altissima was prepared by grinding 100 g of its dried leaves, with distilled water, filtering the suspending impurities, and making up to 1000 mL. The extract was used as a corrosion inhibitor in the present study. The corrosion medium was 0.5 M HCl, prepared from A.R. grade HCl (37%), with bidistilled water. Its concentration was checked using a Na2CO3 standard solution.
Measuring methods
WL measurements
The pre-weighed Zn metal specimens were suspended in a 100 mL beaker with a 0.5 M HCl solution for 180 min. Then, the metal specimens were removed from the corrosive solution, washed with bidistilled water, cleaned, dried and reweighed. From this, the metal WL was determined as the difference between the initial weight and the weight after 180 min immersion in the acidic solutions. The experiments were repeated with both acids, in the absence and presence of different inhibitor doses. Each experiment was repeated thrice, and the average of the three values was taken as the final value. The % of inhibition efficiency (IE) and the degree of surface coverage (θ) were calculated using equation (1).

where Wo and Wi are the WL per unit area in the absence and presence of the extract.
Electrochemical measurements
Zn electrodes were cut from Zn sheets with 0.08 mm thickness. The electrodes had the dimensions of 10 x 10 mm; they were weld from one side to a copper wire used for electric connection, and mounted in epoxy resin, to expose geometrical surface areas of 1 cm2. Prior to these measurements, the exposed surface was pretreated in the same manner as for WL experiments.
PP measurement
The electrochemical experiments were carried out in a three electrode electrochemical cylindrical Pyrex glass cell with a platinum counter electrode and a saturated calomel electrode (SCE) as reference. The working electrode had the form of a square cut from Zn sheet (1 cm2). The exposed area was treated as before. A duration time of 30 min was given for the system to attain a steady state, and the open circuit potential (OCP) was noted. Both cathodic and anodic polarization curves were potentiodynamically recorded by changing the electrode potential between -0.5 V and -2 V, at the scan rate of 1 mVs-1; the % of inhibition efficiency (IE) and the degree of surface coverage (θ) were calculated from the electrochemical measurements by equation (2):

where iinh = corrosion current in the extract presence, and ifree = corrosion current in the extract absence.
EIS and EFM measurements
Experiments for EIS measurements were conducted in the frequency range of 100 kHz to 10 mHz at open circuit potential (OCP). The amplitude was 5 mV. Experiments for EFM measurements were carried out using two frequencies: 2 and 5 Hz. The base frequency was 1 Hz with 32 cycles, so the waveform repeated after 1 s. A perturbation signal with amplitude of 10 mV was used. The electrochemical measurements were carried out using a potentiostat/ galvanostat/zera analyzer (Gamry PCI 300/4). This includes Gamry framework system based on the ESA400, and a personal computer with DC 105 software for potentiodynamic polarization, EIS 300 software for EIS, and EFM 140 software for EFM measurements. Echem Analyst 5.58 software was used for plotting, graphing and fitting data.
Results and discussion
WL method
The WL-time curves of Zn specimens in a 0.5 M HCl solution, with and without different doses from A. altissima extract, were determined after 180 min of immersion at 25 °C, as shown in Fig. 1.
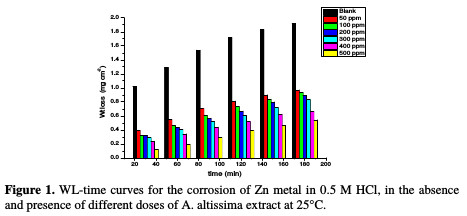
From the plot, WL for systems containing A. altissima extract was found to be lower compared to the blank, indicating that different doses of extract actually inhibited the corrosion of Zn metal in 0.5 M HCl to an appreciable extent.
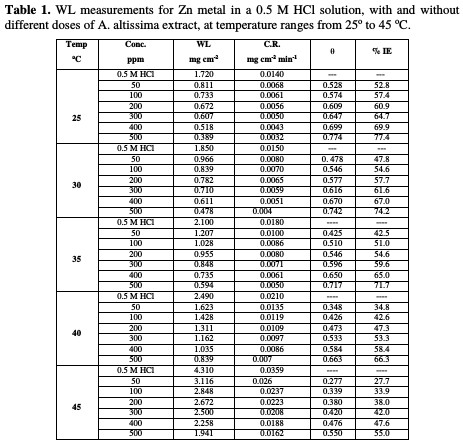
Table 1 and Fig. 1 show that the corrosion IE increased with higher extract doses and temperatures, due to the inhibitor adsorption onto the Zn surface.
Adsorption isotherms and thermodynamics parameters
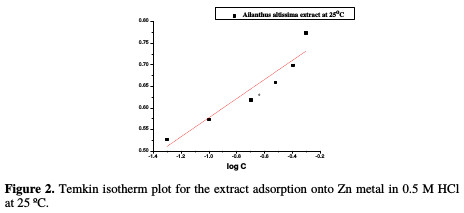
The interaction mechanism between the extract and the metal surface can be explained using adsorption isotherms. θ was computed for the different doses of the extract from WL measurements, as follows: % IE = θ × 100, assuming a direct relationship between θ and IE. The obtained θ values were applied to various adsorption isotherm models. By far, the best fit was found to obey Temkin adsorption isotherm (Fig. 2), which may be formulated as in equation (3):

where a is a molecular interaction parameter depending upon molecular interactions in the adsorption layer and the degree of surface heterogeneity, Kads is the binding constant of adsorption reaction, and C is the extract dose.
The relation between log C and θ at 25 °C in 0.5 M of HCl with various doses of A. altissima extract is shown in Fig. 3.
This figure revealed that a straight line was obtained with the slope close to unity, indicating that the inhibitor obeys Temkin adsorption isotherm.
The relation between the binding constant, Kads and the standard free energy adsorption change, ΔG°ads, can be obtained from equation (4):

where R is the universal gas constant, T is the absolute temperature, and the value 55.5 is the concentration of water in the solution. Fig. 3 also shows a straight line curve for the Temkin adsorption isotherm plot at 25 °C, with a correlation coefficient of 0.891 being about unity.
The values of obtained ΔGoads are recorded in Table 2, which suggested mixed adsorption (physical and chemical adsorption) of A. altissima extract onto the Zn surface in HCl acid.

The negative sign indicates that the adsorption of A. altissima extract molecules onto the Zn surface is stable and a spontaneous process [41].
Effect of temperature
The effect of temperature (25-45 °C) on the corrosion of Zn metal in 0.5 M HCl, in the presence of different plant extract doses, was studied using mass- loss measurements. As the temperature is higher, the rate of corrosion increases and, hence, the additives inhibition efficiency decreases. This is because desorption is aided by an increased temperature. This behavior proves that the action of the inhibitors on the Zn surface occurs through physical adsorption. The apparent activation energies (E*a) for the corrosion process in the absence and presence of the plant extract were evaluated from Arrhenius equation:

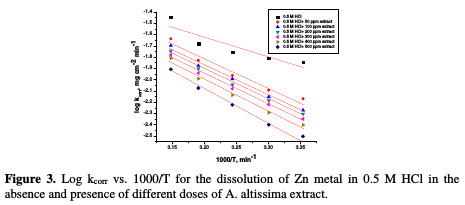
where kcorr is the corrosion rate (mg cm-2 min-1), A is the constant frequency factor, E*a is the apparent activation energy, R is the gas constant (8.314 J mol-1 K-1) and T is the absolute temperature. Plotting of the logarithm of Zn corrosion rate in HCl acid, in the absence and presence of the investigated extract, was made. Fig. 3 represents a plot of log k (corrosion rate) against 1/T (absolute temperature) for Zn in a 0.5 M HCl solution, in the absence and presence of different plant extract doses.
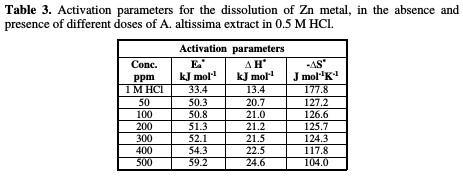
Straight lines were obtained with the slope of -E*a/2.303R. ΔH* is the activation enthalpy and ΔS* is the activation entropy that can be calculated using a transition state-type equation:

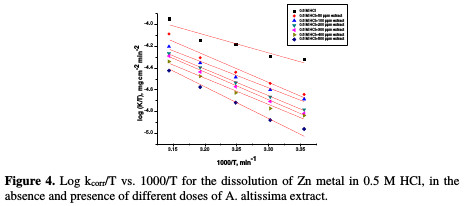
where k is the rate of metal dissolution and N is Avogadro's number. A plot of log k/T versus 1/T for the Zn electrode in a 0.5 M HCl solution, with and without different plant extract doses, gives a straight line with a slope of [(-ΔH*/R] and an intercept of [log(R/Nh) + (ΔS* 2.303R)], represented in Fig. 4.
The values of activation parameters are listed in Table 3.
HE measurements
The dissolution reaction of Zn in 0.5 M HCl, with and without different extract doses, was studied using HE method. The relationship between the volume of hydrogen evolved during the corrosion reaction and time is represented in Fig. 5.
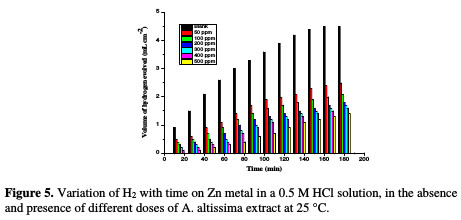
There is a linear relation between hydrogen volume and time. The rate of HE is small at the beginning of the reaction, and then increases with time. The rate of reaction is small in the initial time interval, which is called the incubation period. During this period, the breakdown of the pre-immersed oxide film on the metal surface takes place before the start of the attack on the metal.
Since Zn is readily soluble in aqueous acidic solutions with the liberation of hydrogen, the rate of the latter corresponds to Zn corrosion rate. So, the slopes of the straight portions of the curves, after the incubation period, were taken as a measure of the corrosion rates of Zn in free and inhibited acid solutions. The curve of Fig. 5 reveals that the addition of A. altissima extract reduces the rate of hydrogen evolution as the inhibitor concentration is increased. The IE values of different doses of A. altissima are given in Table 4.

Open circuit potential (OCP)
The variation of open circuit potential (OCP) of Zn with time in a 0.5 M HCl solution, in the absence and presence of different doses of A. altissima extract at 25 °C was followed until attainment of quasi steady states (Fig. 6).

The figure displays a common trend in OCP. The OCP values first increased into the positive direction of potential, followed by semi-stabilization characterized by a small change in potential. This trend indicates that the corrosion reaction quickly starts off as the sample is immersed in the electrolyte (the mirror-like sample surface appeared blurred, once the sample was dipped into the solution), slows down with time, and then reaches a quasi-steady state within the time interval investigated; the shift to less negative values implies increased corrosion. The OCP plateau increased to more positive values with higher A. altissima extract concentration in the electrolyte. This is indicative of the adsorption of extract components onto the Zn surface, which in turn influenced anodic corrosion reaction. As reported before [42], it is feasible to classify corrosion inhibitors as anodic or cathodic, if OCP in the inhibitor presence shifts at least +85 mV or -85 mV, respectively, relatively to OCP in the inhibitor absence. However, the negative and the positive shift to OCP in the highest studied dose (30 ppm) of the extract in HCl is about 24 mV relatively to its blank solution.
This value is lower than 85 mV, indicating that the extract functions as a mixed- type corrosion inhibitor, that is, both dissolution of Zn at the anode and the hydrogen evolution at the cathode were affected by the extract inhibitor.
Potentiodynamic polarization measurements
PP curves for Zn metal in uninhibited and inhibited acidic solutions containing different doses of A. altissima are shown in Fig. 7.
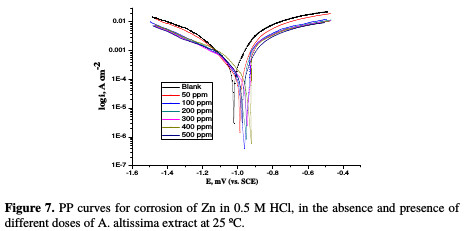
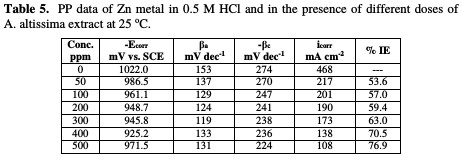
The values of IE increase with increasing extract doses, indicating that a higher surface coverage was obtained in a solution with an enhanced extract dose, as shown in Table 5.
EIS measurements
The corrosion of Zn electrode in 0.5 M HCl, in the absence and presence of A. altissima extract, was investigated by EIS method at 25 °C. Fig. 8 shows the Nyquist plots for Zn electrode in a 0.5 M HCl solution, in the absence and presence of different doses of extract at 25 °C.
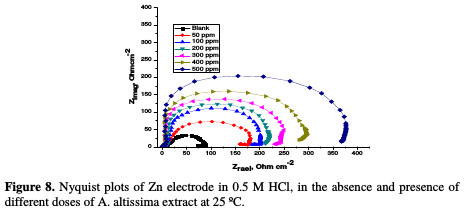
The impedance spectra of the Nyquist plots were analyzed by fitting the experimental data to a simple equivalent circuit model (Fig. 9), which includes the solution resistance, Rs, and the double layer capacitance, Cdl, which is placed in parallel to the charge transfer.

The impedance diagram shows the same trend (one capacitive loop), in the absence and presence of different extract doses; however, the diameter of this capacitive loop increases with increasing concentrations. The main parameters deduced from the analysis of the Nyquist diagram are the charge transfer resistance, Rct, (diameter of the high frequency loop) and the capacity of double layer, Cdl, which is defined as:

The inhibition efficiencies obtained from the impedance measurements are defined by the following relations:

where Roct and Rct are the charge transfer resistance in the extract absence and presence, respectively. The parameters given from EIS diagram are given in Table 6.
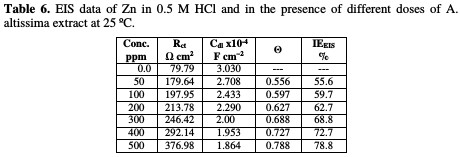
From Table 6, we conclude that the values of Rct increase with an increase in the extract dose, indicating the formation of a protective film on the metal-solution interface. The impedance diagram obtained has a semicircle appearance. This indicates that the corrosion of Zn in 0.5 M HCl is mainly controlled by a charge transfer process. The value of Cdl decreases with increasing extract concentrations, due to the decrease in local dielectric constant, and/or to the increase in the thickness of the electrical double layer.
EFM method
Results of EFM experiments are a spectrum of current response as a function of frequency. The spectrum is called the ''inter modulation spectrum'', and an example is shown in Fig. 10.
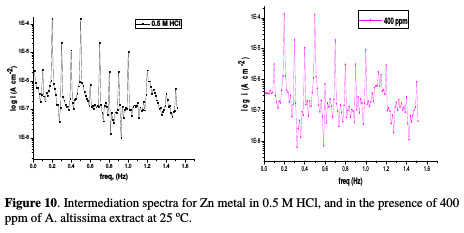
It indicated the corresponding current response in the inter modulation spectrum. The calculated corrosion kinetic parameters, at different doses of A. altissima extract in 0.5 M HCl at 25 °C (icorr, βa, βc, CF-2, CF-3 and % IE), are given in Table 7.
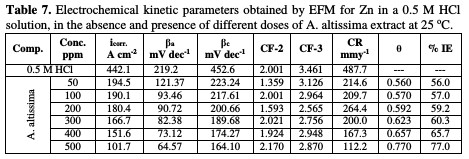
From the table, the corrosion current densities decreased by increasing concentrations of A. altissima extract, and the inhibition efficiency increased by increasing extract concentrations. The causality factor was calculated from the frequency spectrum of the current response. If the causality factors are approximately equal to the predicted values of 2 and 3, there is a causal relationship between the perturbation signal and the response signal. Then, the data are assumed to be reliable. When CF-2 and CF-3 are in the range of 0-2 and 0-3, respectively, then the EFM data are valid. The deviation of causality factors from their ideal values might be due to the fact that the perturbation amplitude is too small, or that the resolution of the frequency spectrum is not high enough; also, another possible explanation is that the inhibitor is not performing very well.
Inhibition mechanism
The initial mechanism in any corrosion inhibition reaction is the inhibitor adsorption onto the metal surface. This adsorption may be occurred by the transfer of electrons to the metal surface (chemisorption), or by the charge transfer from the charged inhibitor to the charged metal surface (physisorption).
Several researches carried out on the adsorption of a corrosion inhibitor onto the surface of a metal have shown that the presence of hetero atoms (N, S, O or P) in an aromatic system or long carbon chain, as well as π-electrons, will facilitate the adsorption of the inhibitor onto the metal surface. The inhibitive action of naturally occurring A. altissima extract towards the corrosion of zinc metal could be attributed to the adsorption of its components onto the metal surface. The adsorbed layer acts as a barrier between the metal surface and the acidic solution, leading to a decrease in the corrosion rate. From the inspection of the chemical composition of A. altissima extract, it appears that this extract is available from many natural organic components, as above mentioned. These components are chemical organic compounds, with hetero atoms and carbonyl groups that are rich in electrons, serving as a good adsorption site onto the metal. The adsorption of these compounds led to a decrease in the reaction between zinc metal and acid media (HCl), and, then, to a decrease in the corrosion rate.
Conclusions
The investigated A. altissima extract was found to act as a good corrosion inhibitor for Zn in a 0.5 M HCl solution. The chemical and electrochemical measurements confirm the inhibitive nature of A. altissima extract. IE increases with increasing extract doses, and decreases with rising temperatures, reaching its maximum value, 77.5 %, at 500 ppm. The adsorption of the extract molecules onto the metal surface obeyed Temkin adsorption isotherm. The extract behaves as a mixed type inhibitor.
References
1. Thomas S, Birbilis N, Venkatraman MS, et al. Corrosion. 2012;68:9. [ Links ]
2. Yousif E, Win Y, Al-Hamadani AH, et al. Int J Electrochem Sci. 2015;10:1708. [ Links ]
3. Vashi RT, Desai K. Der Pharma Chemica. 2012;4:2117. [ Links ]
4. Fouda AS, Abdel Nazeer A, Saber A. J Korean Chem Soc. 2014;58:160. [ Links ]
5. Praveen BM, Venkatesha TV. J Alloys Compounds. 2009;482:53. [ Links ]
6. Shanbhag A, Venkatesha T, Prabhu R, et al. Bull Mater Sci. 2011;34:571. [ Links ]
7. Abdallah M, Zaafarany IA, Al-Jahdaly BA. J Mater Environ Sci. 2016;7:1107. [ Links ]
8. Pavithra MK, Venkatesha TV, Kumar MKP, et al. Corros Sci. 2012;60:104. [ Links ]
9. Junaedi S, Al-Amiery A, Kadihum A, Kadhum A, Mohamad A. Int J Mol Sci. 2013;14:1915. [ Links ]
10. Kadhum A, Mohamad A, Hammed L, et al. Materials. 2014;7:4335. [ Links ]
11. Fouda AS, Abdallah M, Atwa ST, et al. Modern Appl Sci Canda. 2010;4:41. [ Links ]
12. Abdallah M, Zaafarany I, Al-Fahemi JH, et al. Int J Electrochem Soc. 2012;7:6622. [ Links ]
13. Shylesha B, Venkatesha TV, Praveen BM. J Chem Pharm Res. 2011;3:501. [ Links ]
14. Belkhaouda M, Bammou L, Zarrouk A, et al. Int J Electrochem Sci. 2013;8:7425. [ Links ]
15. Sirbharathy V, Rajendran S. Chem Sci Rev Letters. 2012;1:25. [ Links ]
16. Sirbharathy V, Rajendran S, Sathyabama J. Int J Chem Sci Technol. 2011;1:108. [ Links ]
17. Sangeetha M, Rajendran S, Megala TSM, et al. Zastita Materijala. 2011;52:35. [ Links ]
18. Rajendran S, Sumithra P, Devi BS, et al. Zastita Materijala. 2009;5:223. [ Links ]
19. Olusegun KA, James AO. Corros Sci. 2010;52:661. [ Links ]
20. Abdulwahab M, Kasim A, Fayomi OSI, et al. J Mater Environ Sci. 2012;3:1177. [ Links ]
21. Refaey SAM, Abd El-Malak AM, Taha F, et al. Int J Electrochem Sci. 2008;3:167. [ Links ]
22. Kamal C, Sethuraman MG. Arab J Chem. 2012;5:155. [ Links ]
23. Sharma SK, Mudhoo A, Khamis E. J Corros Sci Eng. 2009;11:1. [ Links ]
24. Abdel-Gaber AM, Khamis E, Abo-Eldahab H, et al. Mater Chem Phys. 2008;109:297. [ Links ]
25. Umoren SA, Ebenso EE. Pig Res Technol. 2008;37:173. [ Links ]
26. Fouda AS, Morsi M, Mosallam HA. Zastita Materijala. 2016;57:33. [ Links ]
27. Okafor PC, Ebenso EE. Pig Res Technol. 2016;36:134. [ Links ]
28. El-Etre AY. Appl Surf Sci. 2006;252:8521. [ Links ]
29. Bright A, Maragatham SMR, Vizhi IM, et al Int J Recent Sci Res. 2015;6:3594. [ Links ]
30. Selvi JA, Rajendran S, Ganga Sri V, et al. Port Electrochim Acta 2009;27:1. [ Links ]
31. Sharma SK, Mudhoo A, Jain G, et al. Green Chem Letters Rev. 2010;3:7. [ Links ]
32. Kowarik I, Saumel I. Perspect Plant Ecol. 2007;8:207. [ Links ]
33. Sladonja B, Susek M, Guillermic J. J Environ Manag. 2015;56:1009. [ Links ]
34. Kubota K, Fukamiya N, Hamada T, et al. J Nat Prod. 1996;59:683. [ Links ]
35. Ohmoto T, Koike K. Chem Pharm Bull. 1984;32:170. [ Links ]
36. Souleles C, Waigh R. J Nat Prod. 1984;47:741. [ Links ]
37. Ohmoto T, Koike K. Shoyakugaku Zasshi. 1988;42:160. [ Links ]
38. Ohmoto T, Sung YI. Shoyakugaku Zasshi. 1982;36:307. [ Links ]
39. Ohmoto T, Sung YI, Koike K, et al. Shoyakugaku Zasshi. 1985;39:28. [ Links ]
40. Ohmoto T, Nikaido T, Koike K, et al. Chem Pharm Bull. 1988;36:4588. [ Links ]
41. Popova A, Sokolova E, Raicheva S, et al. Corros Sci. 2003;45:33. [ Links ]
42. Oguzie EE, Li Y, Wang FH. Electrochim Acta. 2007;53:909. [ Links ]
*Corresponding author. E-mail address: asfouda@hotmail.com
Received June 6, 2017; accepted October 20, 2017


