Serviços Personalizados
Journal
Artigo
Indicadores
-
 Citado por SciELO
 -
 Acessos
Links relacionados
-
 Similares em
SciELO
Compartilhar
Portugaliae Electrochimica Acta
versão impressa ISSN 0872-1904
Port. Electrochim. Acta vol.36 no.5 Coimbra set. 2018
https://doi.org/10.4152/pea.201805339
Thymus Sahraouian Essential Oil as Corrosion Eco-friendly Inhibitor for Mild Steel in a Molar Hydrochloric Acid Solution
Z. Bensoudaa,* , M. Drioucha , R.A. Belakhmimab , M. Sfairaa , M. Ebn Touhamib and A. Farahc
a Laboratoire d'Ingenierie des Materiaux, de Modelisation et d'Environnement (LIMME). Universite Sidi Mohamed Ben Abdellah (USMBA), Faculte des Sciences, BP 1796-30000, Fez-Atlas, Morocco
b Laboratoire d'Ingenierie des Materiaux et Environnement: Modelisation et Application, Faculte des Sciences, Universite Ibn Tofaïl, BP. 133-14000, Kenitra, Morocco
c Laboratoire de Chimie Organique Appliquee. Universite Sidi Mohamed Ben Abdellah (USMBA), Faculte des Sciences et Techniques. Route Immouzer, Fez, Morocco
Abstract
Thymus Sahraouian essential oil (TSEO), as a new corrosion eco-friendly inhibitor, has been used to protect mild steel in 1 M HCl. Weight loss, three potentiodynamic polarization methods (Tafel, Stern and Stern-Geary), and electrochemical impedance spectroscopy measurements were undertaken to evaluate corrosion inhibition by TSEO. TSEO acted as an efficient corrosion inhibitor for mild steel in 1 M HCl, and its inhibition efficiency increased with a concentration of 77.82 % at 2 g L-1. The polarization curves revealed that TSEO acted as a mixed type inhibitor, with predominant anodic action. The EIS studies were fitted to a suitable equivalent circuit model, at 293 K, only reflecting a one-time constant characteristic of a charge transfer process. Besides, the higher is the temperature the lowest is the inhibiting efficiency. The kinetic parameters were in favour of an electrostatic character of TSEO components adsorption onto the mild steel surface, and adsorption followed the Langmuir isotherm model. Micrographic scanning electron microscopy and energy dispersive X-ray spectroscopy analyses confirmed the formation of a protective adsorbed film upon the mild steel surface.
Keywords: acid corrosion; mild steel; green inhibitor; polarization curves; EIS; SEM/EDX.
Introduction
Corrosion is a set of electrochemical and/or chemical reactions between a material, usually a metal, and the environment, which produces a deterioration of its characteristics. The three main reasons for the importance of corrosion investigations are economy, conservation, and safety [1]. In diverse forms of corrosion, there is practically no visible weight change or degradation, but properties change, and the metal may fail without warning, because of certain changes within it. Such changes may defy normal visual examination or weight change determinations [2].
Nowadays, acid solutions are commonly used in industry, the most important fields of application being industrial acid cleaning, acid pickling, acid descaling, oil-well acid in oil recovery, and the petrochemical process. Because of the specific corrosiveness of acid solutions, corrosion inhibitors are commonly used to reduce the corrosive attack on metallic materials [3].
A corrosion inhibitor is a chemical element or combination of elements that, when added, at small concentrations, to an aggressive environment, effectively reduce the corrosion rate of the metal exposed to it. Mineral compounds such as chromates, phosphates and molybdates act as anodic inhibitors [4]. Organic compounds containing heteroatoms such as oxygen, phosphor, nitrogen, sulfur and multiple bonds in their molecules form a protective film through the adsorption of their potential sites onto the metal surface [5 and 6]. The use of organic and mineral corrosion inhibitors has been restricted, due to their toxicity to both human beings and the environment. In fact, their synthesis is often expensive and insufficiently efficient at low dosages [7], which limits their application.
Currently, research in corrosion is focused on âeco-friendly corrosion inhibitorsâ that show a low risk of environmental pollution, with good inhibition efficiency [8]. The term ââeco-friendly inhibitor'' or âgreen inhibitorâ refers to substances that are biocompatible, such as essential oils, since they are of biological origin [9]. Eco-friendly inhibitors can be used in the form of pure compounds [10-11], essential oils [5, 12-13], or plant extracts [14-16].
Plant extracts can be used in chemical cleaning and pickling processes, and all of them have been found to generally exhibit good inhibition efficiencies. The yield of eco-friendly inhibitors and their corrosion inhibition capacity widely vary, depending on the used plant parts, harvest time, climatic conditions and geographic location [17].
In the last decade, wide research has been made on some essential oils of Thymus derivatives as potential corrosion inhibitors for different metals in various acid solutions [18-24]. For instance, the protection of mild steel, tinplate and copper in HCl, H2SO4 and HNO3 solutions by Thymus derivatives essential oils, based on gravimetric and electrochemical techniques, has been reported by some researchers [18, 20, 22, 24].
Results indicate that the inhibition efficiency increased with the higher essential oil concentrations, and decreased with the rise in temperature. Similarly, Elbouchtaoui et al. [21] have investigated the effect of Thymus pallidus essential oil on carbon steel in HCl. The obtained results revealed that the essential oil reduced the corrosion rate.
El Hajjaji et al. [19] showed that Thyme vulgaris essential oil is a good corrosion inhibitor for mild steel in 1 M HCl. According to all results, Thyme derivatives essential oils acted as mixed type inhibitors on the metal surface. The aim of the present work is to study the effect of Thymus Sahraouian essential oil, (hereafter denoted TSEO), as a corrosion inhibitor for mild steel in molar hydrochloric acid. Thymus S. plant is cultivated in the southeast of Morocco, for application in the pharmaceutical industry, and for medicinal purposes.
TSEO was obtained by hydro distillation technique using a Clevenger type apparatus, and analysed by gas chromatography and gas chromatography-mass spectrometry techniques. Examination of mild steel corrosion parameters in a molar hydrochloric solution was achieved by means of gravimetric, potentiodynamic polarization and electrochemical impedance spectroscopy (EIS) methods.
The mild steel surface morphology was recorded by Scanning Electron Microscope (SEM), associated to Energy Dispersive X-ray spectroscopy (EDX). The mechanism of mild steel corrosion inhibition is herein deeply discussed, based both on the confrontation of the adsorption isotherm with temperature dependence.
Experimental procedure
Plant material and its extraction
Specimens of Thymus S. plant came from the city of Tighremt N'Imgounen (located in the southern of Morocco in the Draa-Tafilalet region). They were collected in the late spring, during the plant flowering period, and only the aerial parts (flowers, leaves, stems) were gathered. TSEO was obtained by hydro distillation realized by boiling the aerial part of Thymus S. plant for 3 h. The mean yield of this inhibitor was 1.49 mL/100 g of dry substance. TSEO was dehydrated over Na2SO4. The obtained essential oil was analysed by Gas Chromatography - Mass Spectrometry (type QP2010 Shimadzou®) and by Trace gas chromatography / Polaris Q (Gas Chromatography - Mass Spectrometry, Thermo-Electron®). The column of gas chromatography used helium as mobile phase, and it had 95 % dimethyl-polysiloxan and 5 % phenyl, with a length of 30 m, a layer thickness of 0.25 μm, and an interior diameter of 0.24 μm.
Coupons preparation
The chemical composition of mild steel specimens (wt. %) used for all the experiments was as follows: P = 0.013, Mn = 0.4, Si = 0.1, S = 0.02, C = 0.16 and Fe balance. The used mild steel specimens had a rectangular form (length = 3 cm, width = 1 cm, thickness = 0.05 cm). This size was used for weight-loss measurements and SEM analyses, whereas specimens with the size of length = 6 cm, width = 1 cm and thickness = 0.05 cm, with only 1 cm2 of exposed surface, were used as working electrodes for potentiodynamic polarization and EIS measurements.
The metal specimens were pre-treated previously to the experiments by mechanically polishing with SCI emery-papers, successively from 180 to 2000 grades. The samples were completely washed with bi-distilled water, defatted by absolute ethanol, and dehydrated with acetone at room temperature, before being immersed into the corrosive media, so that they were all in similar conditions.
Test solutions
The aggressive solution (1 M HCl) was prepared by dilution of analytical reagent grade, 37% HCl, with bi-distilled water. All the test solutions were freshly prepared before every experiment, by directly adding TSEO into the aggressive solution. The concentration of the essential oil used ranged from 0.5 to 2 g L-1, and the solution volume was 50 mL in every experiment.
Gravimetric and electrochemical measurements
The gravimetric measurements were realized in a double glass cell equipped with a thermostat cooling condenser. Hence, the gravimetric results expressed in (mg cm-2 h-1) were given after 6 h immersion time at room temperature (293 ± 1 K), by weighting the cleaned specimens before and after immersion in the corrosive solution, using a digital balance with 0.001 g of sensitivity. The exposed area of used samples was 6.4 cm2. Three experiments were performed in each case, and the mean value was reported.
The electrochemical workstation was VoltaLab Radiometer® PGZ100 potentiostat controlled by a Portable Computer, and supported by Voltamaster 4 software. The electrochemical measurements were performed using a conventional three-electrode cell with a thermostatted double wall. The mild steel specimen was used as working electrode; a saturated calomel electrode as reference electrode; and a platinum electrode as auxiliary electrode. The working electrode was the one used for weight-loss measurements, embedded in polytetrafluoroethylene (PTFE), to avoid any electrolyte infiltration. The polarization curves acquired from potentiodynamic polarization experiments were recorded in the potential range from -900 to -100 mV (SCE), with 1 mV s-1 scan rate. The potentiodynamic Tafel measurements were scanned starting from cathodic to the anodic domain, from -200 mVSCE to +200 mVSCE. The linear Tafel segments of the cathodic curves allowed providing the cathodic Tafel slopes (βc), and their extrapolation to Ecorr gave the corrosion current density (icorr).
The polarization resistance (Rp) of mild steel in the test solutions was calculated by performing linear polarization experiments in the potential range of ± 10 mVSCE, apart from Ecorr, with a scan rate of 1 mV/s. The slope of the obtained current versus potential curves yielded the polarization resistance value. The impedance experiments were realized using a transfer function analyser (Voltalab PGZ 100), in the frequency range domain from 100 kHz to 100 mHz, with a small perturbation amplitude of 10 mV peak to peak, at the open circuit potential. The working electrode was immersed for 30 min in the acidic solution, before starting the EIS measurements.
The steady-state current voltage characteristics were performed by using Ec- Lab software, where all EIS data were fitted and analysed with the Ec-Lab simulation, as well as ZView® 2.80, with respect to an appropriate equivalent circuit.
Morphological investigation
In order to examine the changes in surface morphology of the corroded and inhibited samples, SEM model FEI Quanta® 200, equipped with EDAX probe microanalysis of surfaces, was used. The micrographs were taken after immersion of the samples for 24 h in the corrosive solution, without and with 2 g L-1 of TSEO.
Results and discussion
Characterization and chemical composition of TSEO
Fig. 1 shows the spectre of gas chromatography and gas chromatography-mass spectroscopy of the essential oil dissolved in hexane.
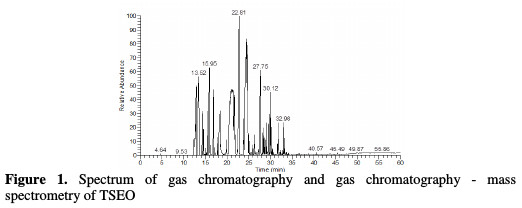
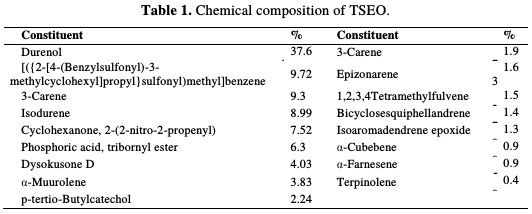
Table 1 summarizes the obtained component percentages of TSEO. The total detected for this essential oil was of 99.98 %.
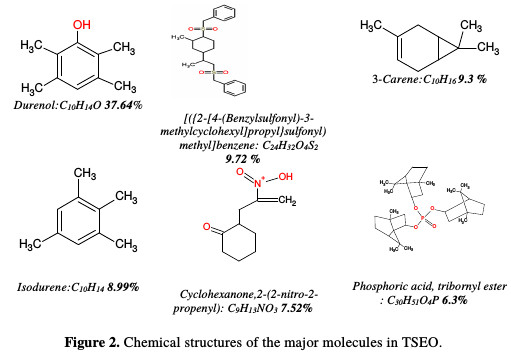
The chemical structures of the major abundant compounds are presented in Fig. 2.
Gravimetric study
The effect of TSEO, at different concentrations, on the corrosion inhibition of mild steel in 1 M HCl solution, was calculated by using the gravimetric method at 293 K, after an immersion period of 6 h. The corrosion rate (Wcorr) and the inhibition efficiency (ηWL%) are calculated by equation (1) [25]:

where Winh and W0 are the values of corrosion weight-loss in inhibited and uninhibited solutions, respectively.
The evolution of both Wcorr and ηWL% versus TSEO concentration is shown in Fig. 3.
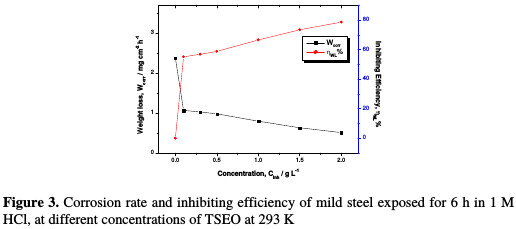
It can be concluded that the corrosion rate decreased, while the inhibiting efficiency increased with the rise of TSEO concentration in the aggressive solution. The maximum ηWL% of 78.31% was achieved at 2 g L-1 of TSEO, and any additional increase in TSEO concentration did not modify the inhibitor performance. These results imply that this essential oil is a good corrosion inhibitor for mild steel in a 1 M HCl solution, and that the corrosion inhibition can be imputed to the adsorption of some TSEO components onto the mild steel/hydrochloric acid solution interface [16].
Indeed, the adsorption of TSEO components, involving the displacement of water molecules from the mild steel surface, can occur because of the eventual formation of links between the vacant d-orbital of iron atoms, and the free lone pair electrons present on O, S, N and P atoms, along with the Ï -orbital's of the major TSEO components (cf. Fig. 2). Similar results were reported by Rani and Basu [26], and Hussin et al. [27]. Nevertheless, the inhibiting character of this essential oil can also be ascribed to a synergistic, or otherwise, effect of its various active components, despite minor compounds (Table 1). Boumhara et al. [5] revealed that the inhibitive nature of Artemisia Mesatlantica may be attributed to the synergistic intermolecular effect of the different active constituents present in the essential oil.
Electrochemical measurements
Potentiodynamic polarization study
Potentiodynamic polarization measurements have been carried out, in order to gain information about the kinetics of the cathodic and anodic reactions. Potentiodynamic polarization curves of mild steel in 1 M HCl, without and with different concentrations of TSEO at 293 K, are given in Fig. 4.
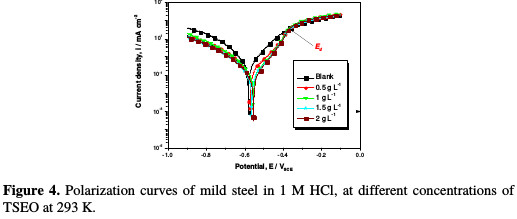
This figure shows that both cathodic and anodic current densities in the presence of the TSEO inhibitor have been significantly decreased with respect to those of the 1 M HCl solution. In addition, the shift in the corrosion potential achieved more positive potentials when TSEO was added, which corresponds to a manifest anodic inhibition. The cathodic current-potential of mild steel, in the absence and presence of different TSEO concentrations, gave rise to parallel Tafel lines, which means that the hydrogen evolution reaction was activation controlled. Thus, the reduction of H+, at the mild steel interface, essentially took place through a charge transfer mechanism [28-29]. Furthermore, in the anodic region, TSEO inhibition mode depended on the applied potential. Indeed, TSEO acted as a corrosion inhibitor only at low anodic over-potentials below Ed â 0.362 VSCE, whereas current densities sharply increased in the presence of TSEO at higher potentials than Ed [30-31]. Thus, the mechanism of the metallic dissolution reaction was changed. This behavior may be the result of a significant dissolution of iron, leading to the removal and/or deformation of the TSEO film at the mild steel surface; this potential is generally defined as the desorption potential. It is then concluded that TSEO molecules adsorption onto the mild steel surface creates a film that protects it at low anodic over-potentials. This film loses its protection when the potential is augmented to higher anodic regions. Similar results have been reported in the literature [30-33].
The corrosion inhibiting efficiency values obtained from the Tafel method are calculated, as according to equation (2):

where icorr/inh and icorr represent the corrosion current density values, with and without TSEO, respectively.
From Table 2, it is clear that TSEO addition noticeably decreased icorr, and that ηTafel% considerably increased from 50.11 to 77.82 %.

This suggests that the corrosion rate was reduced, due to the formation of a barrier film onto the mild steel surface, by adsorption of TSEO molecules. In the presence of TSEO, Ecorr is anodically shifted in the range of 5-23 mV, compared to the blank solution, but all values were lower than 85 mV. This displacement greatness is not clear enough to determine the type of inhibitor: cathodic or anodic, as given elsewhere 16, 34]. Hence, the obtained results imply that TSEO acted as a mixed-type inhibitor with anodic predominance, as reported by other researchers [35]. In addition, βc values show a slight change with increasing TSEO concentrations, indicating that the mechanism of hydrogen evolution discharge was not affected by the inhibitor; thereby, the reaction mechanism remained unchanged, as explained by Solmaz et al. [36]. The adsorbed protective film of TSEO onto the mild steel surface blocked the reaction sites of the mild steel. In this way, the actual surface area, accessible for H+ ions, was decreased. The polarization resistance values (Rp) and the related percentage corrosion inhibition efficiency value (ηS&G%) of mild steel in 1 M HCl, in the absence and presence of various TSEO concentrations (which are determined from the Linear Polarization Resistance - LPR - method, also named Stern-Geary (S-G) [37]), are listed in Table 2. However, Rp is determined from the current-potential curves slope in the vicinity of Ecorr ±10 mV, according to equation (3):

where di is the difference in the current density and dE is the difference in the applied potential. The inhibition efficiency (ηS&G%) is calculated from Rp, using the following equation:

where Rp and Rp/inh are the polarization resistance values without and with TSEO, respectively.
It can be seen from Table 2 that ηS&G% increased with a higher TSEO concentration, and achieved a maximum value of 76.97% at 2 gL-1.
The Stern method, derived from potentiodynamic polarization curves, has also been used as a third method to investigate in detail the corrosion kinetic parameters [38]. To do that, the data fitting for the experimental results was made according to equation (5):

where βc is the Tafel slope of cathodic reaction and βa is the Tafel slope of anodic reaction. Hence, for this approach, the potentiodynamic polarization studies were carried out over a potential window from -100 to +100 mVSCE, with respect to Ecorr [39]. The potentiodynamic polarization plots (experimental and fitting) using the Stern method are illustrated in Fig. 5.
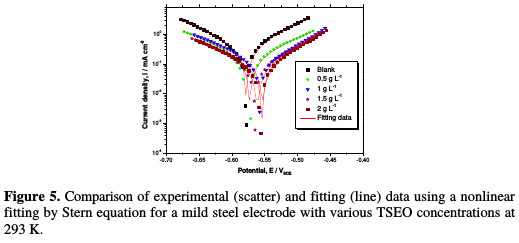
A very good concordance between the experimental and fitting polarization values is observed.
The Stern parameters, icorr, Ecorr, βc and βa, were calculated from the experimental data using the graphical data analyses software (Origin pro and Origin-Lab). The fitting quality, according to Equation (5), is judged by two parameters: the coefficient of determination (R2) and chi-square value (χ2), in which R2 reflects how close the experimental data are, when compared to the fitted regression curve, and χ2, given by equation (6), represents a measurement of expectations compared to the experimental data, according to the Stern equation:

where Ames,i are the measured experimental data, Acal,i designates the calculated model data and N corresponds to the freedom degrees.
The percentage inhibiting efficiency derived from the Stern method (ηstern%) is calculated by using corrosion current densities, according to equation (7), identical to equation (3):

Referring to Fig. 5 and Table 3, it is revealed that the TSEO inhibitor addition reduced both cathodic hydrogen evolution and anodic metal dissolution reactions.

The obtained inhibiting efficiency reached a maximum of 77.94 % at 2 g L-1 of TSEO. It is obvious that ηstern% followed the same trend as those of ηTafel% and ηS&G%. The deviation was registered in the potential region from which the electrochemical parameters were extrapolated. Furthermore, the obtained chi square-values from 0.0374 to 0.0013, and supported by the R2 values greater than 0.968, indicate that the experimental data were well described by the Stern method. In addition, the different electrochemical parameters extracted from the Stern method are in good accordance with those obtained from Tafel, and Stern-Geary methods.
EIS measurements
To confirm the potentiodynamic polarization results, and to investigate the corrosion process, in terms of resistive as well as capacitive behaviour at the mild steel/solution interface, EIS technique was used. Figs. 6a-b show the impedance diagrams of mild steel in the Nyquist and Bode representations at the open circuit potential, after an exposure period of 30 min, for 1 M HCl, in the absence and presence of different TSEO concentrations.
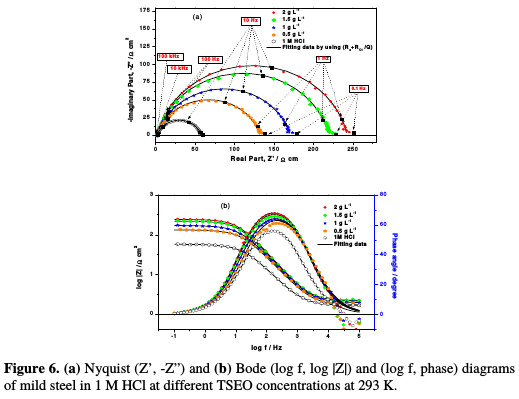
The Nyquist diagrams consist of a depressed semicircle with a single capacitive loop, of which centre is under the real axis. The deviation from a perfect semicircle is usually referred to the frequency dispersion, as well as to the in- homogeneity impurities, grain boundaries and mass transport resistance of the mild steel [40-42]. Furthermore, only one-time constant appears in log(f)-log |Z| plot (Fig. 6b), showing that the corrosion process was generally charge transfer controlled. The diameter of Nyquist diagrams increased after adding TSEO into a 1 M HCl solution, which clearly shows an enhancement in the corrosion resistance of mild steel, and indicates the adsorption of the inhibitor molecules onto the mild steel surface. The difference in real impedance at higher and lower frequencies is commonly considered as the charge transfer resistance (Rt), while the electrolyte resistance (Rs) is obtained from the abscissa axis intercept of the semicircle at high frequencies.
All the impedance spectra were analysed in terms of the simple modified Randles circuit (Fig. 7), which is a parallel combination of Rt and the constant phase element of the double layer (CPE), both in series with Rs [43].
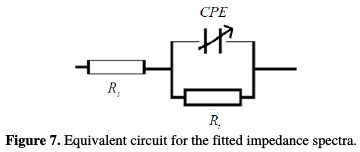
A CPE was used, instead of a pure capacitor, to compensate for the non-ideal interface capacitive response, and to get a more accurate fit of the experimental data set [44]. CPE was calculated as follows:

where Q is the proportional factor (μF sn-1), n is the CPE exponent associated to the phase shift, which can be used as a measure of surface irregularity, j is an imaginary number, and É· is the angular frequency in rad s-1. The double layer capacitance or the pseudo capacitance (Cdi) values and the relaxation time constant (τ) of the charge transfer process were obtained using equations (9) and (10), respectively.


The middle frequency region of log(f)-log |Z| plots (Fig. 6b) should report slopes (φ) that reflect the gap compared to an ideal capacitor. The chi-square (χ'2) was used in the EIS method to measure the quality of fitting to the proposed equivalent circuit, in order to evaluate the precision of the fitted data. It was calculated as follows [45]:

where Di is the standard deviation, Pmea(i) is the measured impedance at the fi frequency, Pmodel(fi' para) depends on the chosen model, and para is the model parameter (Rt, Rs and Q).
The low values of χ'2 in Table 4 indicate that the fitted data were in good agreement with the experimental results.

Thereafter, the inhibiting efficiency (ηEIS%) was evaluated using the following equation:

where Rt and Rt/inh stand for the charge-transfer resistance of the mild steel in TSEO absence and presence, respectively.
Table 4 presents the different electrochemical impedance parameters acquired from the experimental data fitting; the evaluation of the margins of error for certain parameters is also indicated. Indeed, by increasing TSEO concentrations, Rt values tend to increase and reach a maximum value of 240.7 Ω cm2 at 2 g L-1 of TSEO. The increase in Rt values demonstrates the protection effect of the inhibitor, due to the gradual replacement of water molecules and ions by the adsorption of TSEO components onto the mild steel surface, hence decreasing the degree of mild steel dissolution [46-47]. The value of the proportional factor (Q) of CPE conversely varies with TSEO concentration. Moreover, Cdl values decrease with the increase in TSEO concentration. This result is a consequence of an increase in the surface coverage by the essential oil compounds, which confirms the increase in ηEIS%. On the other hand, in TSEO absence, the calculated value of the relaxation time constant (τ) is found to be 8.54 ms. In its turn, TSEO addition to a 1 M HCl solution caused an increase in τ value at 1.5 g L-1 ( τ =13.18 ms), which remained approximately unchanged, suggesting that charge and discharge rates to the metal/solution interface, considered as an electrical capacitor, were significantly decreased.
The adsorption of TSEO molecules onto the surface decreases its electrical capacity, because they displace the ions and the water molecules initially adsorbed onto the mild steel surface [48]. However, this decrease in electrical capacity may be attributed to the formation of a protective film on the mild steel surface. Hence, the thickness of the formed film (δ) is related to Cdl, according to Helmholtz model given by equation (13) [49]:

where S is the surface area, δ is the protective film thickness, ε0 is the medium relative dielectric constant, and ε is the vacuum permittivity (ε0 = 8.85 10-14 F cm-2). However, when the inhibitor concentration increases, Cdl decreases and, thus, the thickness (δ) of the protective film increases, which means that increasingly more TSEO compounds can be adsorbed onto the mild steel surface [50].
The n parameter can be utilized as a gauge of the roughness or heterogeneity of the mild steel surface; it has a value ranged between 0-1. This result indicates a more homogenous surface. In Table 4, the value of a phase shift ranges from 0.8215 to 0.8723, and does not significantly vary, which suggests that the charge transfer controlled the dissolution mechanism of mild steel in an aggressive solution, with and without TSEO [51]. On the other hand, Bode diagrams show that the slope (φ) (Fig. 6b), ranges from -0.62 to -0.76, which is related to the imperfect structure of the metal/solution interface [52].
Comparison of the performance of some Thymus derivatives
The use of essential oils as corrosion inhibitors has been widely reported by several authors [5, 12-13]. Table 5 reports the percentage inhibition efficiency for some selected essential oils of Thymus derivatives, used as corrosion inhibitors for various materials in acidic media [18-23].
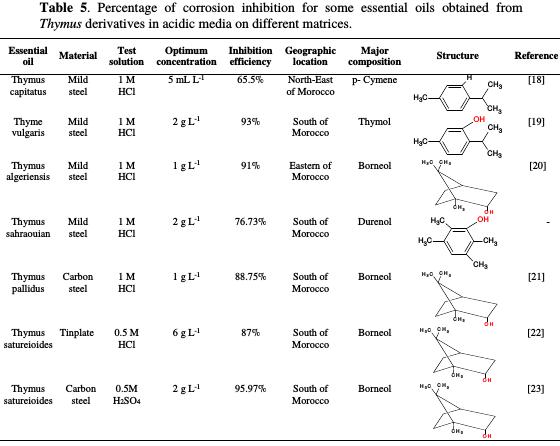
The values of corrosion inhibition efficiency, given in Table 5, derived from EIS measurements.
The comparison of the inhibitory efficiencies of Thymus derivatives [18-19] revealed that the major organic compounds of essential oils have the same skeleton, and only differ by the -OH substituent presence. Thus, the difference in the observed protective properties is predominately attributed to the electronic effect of the substituent type. Indeed, the inhibition efficiency was increasingly pronounced in the presence of a hydroxide functional group in p-Cymene molecule [19]. In addition, the presence of electron density in the phenyl ring with the hydroxide group led to an easier electron transfer from the functional groups to the metal surface, which provides greater adsorption, as reported by some researchers [53-54]. The obtained results reveal that, with an increasing donor property of the substituent, the inhibition efficiency of the inhibitor is increased.
On the other hand, inspection of Borneol chemical structure [20-21] reveals that the compound is easily hydrolysable, and that it can adsorb onto the metal surface via the lone pair of electrons present on oxygen atoms, making a barrier for charge and mass transfer, which leads to a decrease in the interaction of the metal with aggressive solutions. The formation of a layer essentially blocked H+ discharge and metal dissolution, so that the protection efficiency increased, even at low inhibitor concentrations (1 g L-1) [26,55]. However, the observed effect may not be due to the major constituents alone, as even the minor constituents may act to potentiate the inhibitive effects.
From Table 5, it is clear that the major compound of Thymus derivatives essential oils [18-20] is variable according to the harvest area and the development stage [26]. Thus, it is logical to assume that the adsorption mechanism is mainly responsible for the good protective properties of essential oils for various metals in different acidic media [18-23]. It can be easily concluded that corrosion inhibition occurs by a synergistic effect of the different active molecules present in each essential oil.
By comparing these results, we can see that TSEO is an effective inhibitor in 1 M HCl. The best value of inhibition efficiency was obtained even at lower concentrations (76.73% at 2 g L-1).
Comparison of the overall results issued from different methods Fig. 8 shows the histogram of the comparative study of the inhibition efficiency (η%) data for all investigated concentrations of TSEO extracted from the different undertaken weight loss, potentiodynamic polarization (Tafel, Stern- Geary, and Stern) and EIS methods.
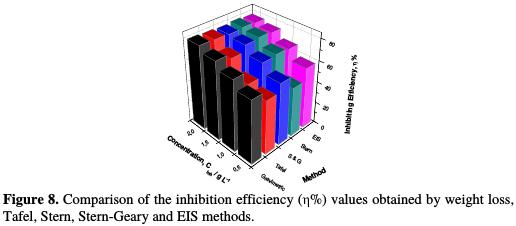
It is noted from the histogram that η% increased with higher concentrations of essential oil in the same manner from all the five methods. A good correlation was observed between the weight loss measurements and potentiodynamic polarization, along with electrochemical impedance spectroscopy studies. The best η% was achieved at 2 g L-1 of TSEO.
Effect of temperature
In order to have more information about TSEO performance and the nature of adsorption and activation processes, the effect of temperature was studied using gravimetric experiments in uninhibited and inhibited media, after 2 h of immersion in the temperature range of 293-333 K.
Fig. 9 shows that the corrosion rate (Wcorr) increases with a rise in temperature, and it is more pronounced for the blank solution.
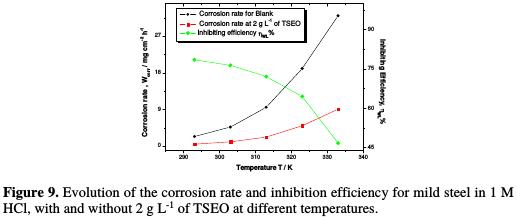
It is obvious that the weight- loss was approximately 13 and 17 times superior, at 333 K, when compared to 293 K, in the absence and presence of 2 g L-1 of TSEO, respectively. Besides, the inhibition efficiency (ηWL%) decreased with a rise in temperature from 293 to 333 K, indicating the increased rate of the dissolution process and the partial desorption of TSEO from the mild steel surface, as reported elsewhere [56]. This fact clearly means a decrease in the strength of the adsorption process at higher temperatures. Meanwhile, we can propose a physisorption mode of TSEO onto the mild steel surface.
The dependence of Wcorr on temperature can be expressed by the Arrhenius equation (14). An alternative formulation of Arrhenius is called transition state, given by equation (15).


In equation (14), Ea is the apparent effective activation energy, R is the general gas constant, T is the absolute temperature, and F is the frequency factor.
In equation (15), N is the Avogadro's number, h is the Planck's constant, ΔS* is the entropy of activation and ΔH* is the enthalpy of activation.
Fig. 10 shows the variations of the logarithm of Wcorr, in TSEO presence and absence, against the reciprocal temperature.
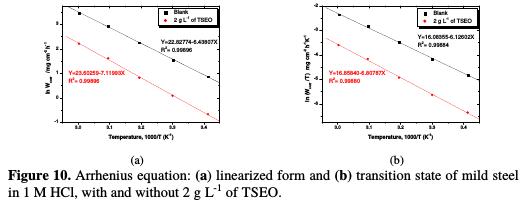
All of the kinetic parameters extracted from Fig. 10 are given in Table 6.

It is obvious that the linear regression coefficients (R2) are close to unity, indicating that mild steel corrosion in 1 M HCl can be elucidated using the kinetic model. In literature, the decrease of the inhibition efficiency (ηWL%) with a rise in temperature (which refers to a superior value of apparent activation corrosion energy (Ea), when compared to the blank), is interpreted as a physisorption phenomenon. In its turn, the inferior value of the apparent activation corrosion energy in an inhibited solution, in comparison with the blank solution, is often interpreted as an indication of a chemisorption phenomenon [57].
Furthermore, Ea given in Table 6 is found to be 53.52 and 59.19 kJ moL-1 for the corrosion process, in TSEO absence and presence, respectively. In addition, the frequency factor (F) increased by more than twice, while ηWL% decreased. However, the rise in temperature, which goes together with a slow increase in Ea by 6 kJ moL-1, can be interpreted as an indication of a columbic or physical type of adsorption [58].
The positive sign of the activated enthalpy (ΔH*) means that the dissolution phenomenon is of endothermic nature, and the higher value, in TSEO presence, reveals that the metal dissolution becomes slow [27-59]. The higher values of the entropy of activation (ΔS*) in an inhibited solution can be interpreted as an increase in disorder, as the reactants are converted to the activated complexes [6- 60]. We note that the activated enthalpy (ΔH*) value and the apparent effective activation energy (Ea) value vary in similar way, allowing to verify the corresponding thermodynamic equation [6]:

Adsorption isotherm The adsorption isotherm can be used to determine if the TSEO effect is mainly due to the adsorption onto the mild steel surface; i.e., to its blocking. Hence, the type of adsorption isotherm can offer additional information concerning the properties of the studied inhibitor. The adsorption process of TSEO components is a permutation reaction where the adsorbed water molecules are being displaced from the mild steel surface, and replaced by TSEO molecules, according to the following equation [49]:

where Org(sol) is the organic molecule in a aggressive solution, Org(ads) is the adsorbed organic molecule onto the electrode surface, H2O(ads) is the water molecule onto the electrode surface, and n is the coefficient that represents water molecules replaced by a TSEO molecule unit.
It is well established that the inhibition efficiency (η%) depends on the number and type of active sites at the mild steel interface, the molecular size of the inhibitor, the charge density, the metallic complex formation, and the mild steel- inhibitor interaction [61]. The fractional surface coverage (θ) values are calculated from weight-loss, EIS measurements and potentiodynamic polarization methods (Tafel, Stern-Geary, and Stern) at different TSEO concentrations and at 293 K, using the following equation [62]:

The most frequently used isotherms are Langmuir, Temkin, and Frumkin [63]. It has been shown that the best suitable isotherm for TSEO adsorption onto the mild steel surface in a 1 M HCl solution is the Langmuir model. The straight lines were traced using the least squares method. The experimental data (points) and fitting data (lines) for the isotherm model are plotted in Fig. 11.
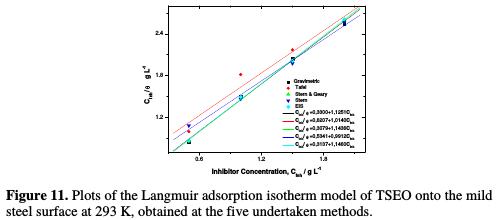
The results of linear regression are given in Table 7.

It is noticeable that the obtained fit quality refers to R2, which reached 0.99. The data fitting lines have slopes very close to unit, which suggests that the experimental data are well explained by the Langmuir adsorption isotherm [6]. Consequently, it is concluded that a single-layer inhibitor film forms on the electrode surface, and that there are no interactions between the adsorbed species onto the electrode surface [64-66].
SEM and EDX results The high-resolution SEM micrographs (50 μm) of mild steel strips are recorded, in order to examine the changes occurred during the corrosion process, before and after immersion in 1 M HCl, without and with TSEO (Figs. 12a-c).
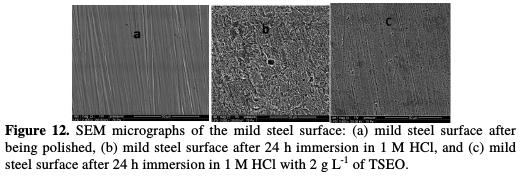
A parallel description of the polished mild steel surface before immersion in the corrosive solution is linked to the abrading scratches (Fig. 12a). Figs. 12b-c show the mild steel surface after 24 h of immersion in 1 M HCl, with and without TSEO. The SEM micrograph (Fig. 12b) shows that the mild steel surface was strongly damaged in TSEO absence, due to an excessive mild steel dissolution in the corrosive solution, and to the increased number and/or depth of pits. On the other hand, in TSEO presence (Fig. 12c), the mild steel surface was remarkably improved, and fewer corrosion attacks, except polishing lines, were observed in comparison to the mild steel surface in TSEO absence, indicating a considerable reduction in the corrosion rate. This improvement in surface morphology was probably due to the formation of a protective film of TSEO components onto the mild steel surface, which was responsible for the corrosion inhibition [7].
Thereafter, an EDX qualitative analysis (Fig. 13) and quantitative spectra (Table 8) are given to determine the principal potential sites present in the different TSEO components, and responsible for the adsorption process.
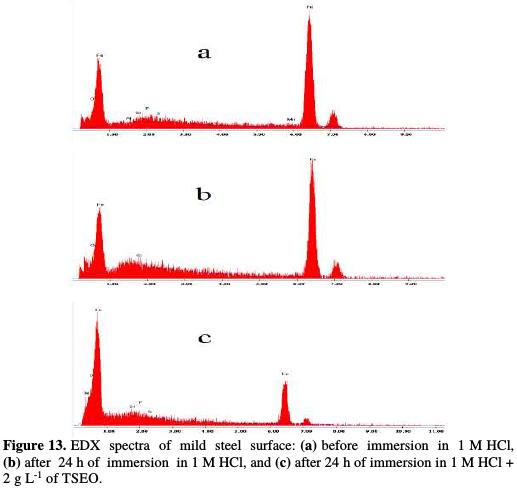

Fig. 13 presents an EDX panorama recorded for a mild steel specimen exposed for 24 h in 1 M HCl, in the absence and presence of 2 g L-1 of TSEO. In the blank solution, EDX spectrum (Fig. 13a) shows the characteristic peaks of some of the elements constituting the mild steel specimen. In TSEO presence (Fig. 13c), EDX spectrum shows an additional line characteristic of the existence of N [65]. In addition, O, S, and P signals are significantly enhanced upon adding TSEO into 1 M HCl. This indicates that TSEO molecules, as major components of the essential oil (Fig. 2), are adsorbed onto the mild steel surface. These results confirm those derived from weight loss, potentiodynamic polarization and EIS measurements, suggesting that a surface film inhibits the mild steel dissolution, and hence retards both cathodic and anodic reactions.
Conclusions
According to the experimental results, the following conclusions can be drawn:
1. The potentiodynamic polarization curves indicate that TSEO acts as mixed type inhibitor with a predominant anodic action.
2. EIS study reveals that TSEO reduced the corrosion rate by increasing the charge transfer resistance of the system, and that the equivalent circuit fitted well with a constant phase element.
3. The confrontation of gravimetric, potentiodynamic polarization (Tafel, Stern, Stern-Geary methods), and EIS measurements showed good agreement among them.
4. The increase in the frequency factor, as well as the apparent activation energy (Ea) value, along with a decrease in the inhibition efficiency suggest that TSEO underwent physical adsorption onto the mild steel surface.
5. The adsorption of TSEO molecules obeyed Langmuir adsorption isotherm model.
6. SEM examination and EDX analysis of the mild steel surface, in TSEO presence, confirmed the existence of a protective adsorbed film.
References
1. Revie RW, Uhlig HH. Corrosion and Corrosion Control: An introduction to corrosion science and engineering. 2008. [ Links ]
2. Roberge P. Corrosion engineering: principles and practice. 2008. [ Links ]
3. Zhang QB, Hua YX. Electrochim Acta. 2009;54:1881. [ Links ]
4. Halambek J, Berkovic K, Vorkapic-Furac J. Corros Sci. 2010;52:3978. [ Links ]
5. Boumhara K, Tabyaoui M, Jama C, et al. J Ind Eng Chem. 2015;29:146. [ Links ]
6. Zarrok H, Zarrouk A, Hammouti B. Corros Sci. 2012;64:243. [ Links ]
7. Solmaz R. Corros Sci. 2014;81:75. [ Links ]
8. Amin MA, Abd El-Rehim SS, El-Sherbini EEF, et al.Electrochim Acta. 2007;52:3588. [ Links ]
9. Kesavan D, Gopiraman M, Sulochana N. Chem Sci Rev Lett. 2012;1:1. [ Links ]
10. Faska Z, Majidi L, Fihi R, et al. Pigm Resin Technol. 2007;36:293. [ Links ]
11. Benabdellah M, Benkaddour M, Hammouti B, et al. Appl Surf Sci. 2006;252:6212. [ Links ]
12. [ Links ] N. National Association of Corrosion Engineers (NACE), Materials performance, National Association of Corrosion Engineers, 1974. http://cat.inist.fr/?aModele=afficheN&cpsidt=21902502 (accessed June 20, 2017).
13. Zerga B, Sfaira M, Rais Z, et al. Materiaux Tech. 2009;97:297. [ Links ]
14. Raja PB, Qureshi AK, Abdul Rahim A, et al. Corros Sci. 2013;69:292. [ Links ]
15. Bentrah H, Rahali Y, Chala A. Corros Sci. 2014;82:426. [ Links ]
16. Mourya P, Banerjee S, Singh MM. Corros Sci. 2014;85:352. [ Links ]
17. Okafor PC, Ikpi ME, Uwah IE, et al. Corros Sci. 2008;50:2310. [ Links ]
18. El Ouadi JCY, Lahhit N, Bouyanzer A, et al. Int J Dev Res. 2016;6:6867. [ Links ]
19. El Hajjaji F, Greche H, Taleb M, et al. J Mater Environ Sci. 2016;7:567. [ Links ]
20. Hamdani I, El Ouariachi E, Mokhtari O, et al. Der Pharma Chem. 2017;8:252. [ Links ]
21. Elbouchtaoui MC, Anejjar A, Salghi R, et al. Der Pharma Chem. 2014;6:406. [ Links ]
22. Bammou L, Chebli B, Salghi R, et al. Green Chem Lett Rev. 2010;3:173. [ Links ]
23. Taoufik F, Anejjar A, Asdadi A, et al. J Mater Environ Sci. 2017;8:582. [ Links ]
24. Houbairi S, Essahli M, Lamiri A. Port Electrochim Acta. 2013;31:221. [ Links ]
25. Parthipan P, Narenkumar J, Elumalai P, et al. J Mol Liq. 2017;240:121. [ Links ]
26. Rani BEA, Basu BBJ. Int J Corros. 2012;2012. [ Links ]
27. Hussin MH, Abdul A, Nasir M, et al. Measurement. 2016;78:90. [ Links ]
28. Musa AY, Kadhum AAH, Mohamad AB, et al. Corros Sci. 2010;52:3331. [ Links ]
29. Li L, Zhang X, Lei J, et al. Corros Sci. 2012;63:82. [ Links ]
30. Qian B, Wang J, Zheng M, et al. Corros Sci. 2013;75:184. [ Links ]
31. Bentiss F, Traisnel M, Vezin H, et al. Corros Sci. 2004;46:2781. [ Links ]
32. Poorqasemi E, Abootalebi O, Peikari M, et al.Corros Sci. 2009;51:1043. [ Links ]
33. Verma C, Quraishi MA, Ebenso EE, et al. J Mol Liq. 2016;219:647. [ Links ]
34. Anupama KK, Ramya K, Joseph A. J Mol Liq. 2016;216:146. [ Links ]
35. Rameshkumar S, Danaee I, RashvandAvei M, et al. J Mol Liq. 2015;212:168. [ Links ]
36. Solmaz R, KardaÅ G, Ãulha M, et al. Electrochim Acta. 2008;53:5941. [ Links ]
37. Stern M, Geary AL. Electrochemical Polarization. J Electrochem Soc. 1957;104:559. [ Links ]
38. Perez N. Electrochem Corr Sci. 2014;2014:1. [ Links ]
39. Rochdi A, Kassou O, Dkhireche N, et al. Corros Sci. 2014;80:442. [ Links ]
40. Aljourani J, Raeissi K, Golozar MA. Corros Sci. 2009;51:1836. [ Links ]
41. Behpour M, Ghoreishi SM, Soltani N, et al. Corros Sci. 2009;51:1073. [ Links ]
42. Juttner K. Electrochim Acta. 1990;35:1501. [ Links ]
43. Zarrouk A, Hammouti B, Lakhlifi T, et al. Corros Sci. 2015;90:572. [ Links ]
44. Chaitra TK, Mohana KNS, Tandon HC. J Mol Liq. 2015;211:1026. [ Links ]
45. Darowiki K. Corros Sci. 1998;40:495. [ Links ]
46. Quraishi MA, Singh A, Kumar V, et al. Mater Chem Phys. 2010;122:114. [ Links ]
47. Lebrini M, Bentiss F, Chihib NE, et al. Corros Sci. 2008;50:2914. [ Links ]
48. Tourabi M, Nohair K, Traisnel M, et al. Corros Sci. 2013;75:123. [ Links ]
49. Verma C, Singh A, Pallikonda G, et al. J Mol Liq. 2015;209:306. [ Links ]
50. Bataillon SBS, Brunet C. Electrochim Acta. 1994;39:455. [ Links ]
51. Growcock F, Jasinski R. J Elechtrochemical Soc. 1989;136:2310. [ Links ]
52. Solmaz R. Corros Sci. 2014;79:169. [ Links ]
53. Hegazy MA, Ahmed HM, El-Tabei AS. Corros Sci. 2011;53:671. [ Links ]
54. Noor EA, Al-Moubaraki AH. Mater Chem Phys. 2008;110:145. [ Links ]
55. Shyamala M, Kasthuri PK. Int J Corros. 2011;2011. [ Links ]
56. Schorr M, Yahalom J. Corros Sci. 2007;49:2144. [ Links ]
58. Popova A, Sokolova E, Raicheva S, et al. Corros Sci. 2003;45:33. [ Links ]
59. Singh P, Srivastava V, Quraishi MA. J Mol Liq. 2016;216:164. [ Links ]
60. Banerjee S, Srivastava V, Singh MM. Corros Sci. 2012;59:35. [ Links ]
61. Avci G. Colloids Surf A Physicochem Eng Asp. 2008;317:730. [ Links ]
62. Singh P, Makowska-Janusik M, Slovensky P, et al. J Mol Liq. 2016;220:71. [ Links ]
63. Haque J, Srivastava V, Verma C, et al. J Mol Liq. 2017;225:848. [ Links ]
64. El Hamdani N, Fdil R, Tourabi M, et al. Appl Surf Sci. 2015;375:1294. [ Links ]
65. Gupta NK, Verma C, Quraishi MA, et al. J Mol Liq. 2016;215:47. [ Links ]
*Corresponding author. E-mail address: bensouda@yahoo.com
Received July 25, 2017; accepted December 12, 2017


