Serviços Personalizados
Journal
Artigo
Indicadores
-
 Citado por SciELO
 -
 Acessos
Links relacionados
-
 Similares em
SciELO
Compartilhar
Portugaliae Electrochimica Acta
versão impressa ISSN 0872-1904
Port. Electrochim. Acta vol.37 no.1 Coimbra jan. 2019
https://doi.org/10.4152/pea.201901023
Electrochemical, Quantum Calculations and Monte Carlo Simulation Studies of N1,N2-Bis(1-Phenylethylidene) Ethane-1,2-Diamine as a Corrosion Inhibitor for Carbon Steel in a 1.0 M Hydrochloric Acid Solution
Fadoua El Hajjajiaa, Mohammed E. Belghitib, Meriem Drissic, Mohammed Fahimc, Rajae Salima,d, Belkheir Hammoutib, Mustapha Taleba and Ayβar Nahlee,*
aLaboratory of Engineering, Electrochemistry, Modeling and Environment (LIEME), Faculty of Sciences, University Sidi Mohamed Ben Abdellah, Fez, Morocco
bLaboratory of Applied Analytical Chemistry Materials and Environment (LCAAE), Faculty of Sciences, University of Mohammed Premier, Oujda, Morocco
cLaboratory of Materials Chemistry and Bio-technology of Naturals Products, Faculty of Sciences, University Moulay Ismail, Meknes, Morocco
dLaboratory of Separation Processes, Faculty of Sciences, University Ibn-Tofail, Kenitra, Morocco
eDepartment of Chemistry, College of Sciences, University of Sharjah, Sharjah, P.O. Box 27272, United Arab Emirates
Abstract
N1,N2-Bis(1-Phenylethylidene)ethane-1,2-diamine (PEED) was tested as a corrosion inhibitor for C-steel in a 1.0 M HCl solution, by using potentiodynamic polarization and electrochemical impedance spectroscopy (EIS) techniques. The results showed that PEED is a very good inhibitor, as its inhibition efficiency reached 93.8 %, with a concentration of 1.0x10 -3 M, at 298 K. Tafel polarization study revealed that PEED acted as a mixed type inhibitor that obeyed Langmuir adsorption isotherm. The thermodynamic activation parameters for the corrosion reaction were calculated and discussed. Quantum chemical parameters and Fukui function were obtained by DMol-3/GGA/PW91/DNP+ level of theory, which was performed using Materials Studiov 8.0 software from Biovia-Accelrys. Monte Carlo simulation was implemented to search for the equilibrium configurations of the PEED/Fe(111) adsorption system, in a 1.0 M hydrochloric acid solution.
Keywords: corrosion, inhibitor, N1,N2-Bis(1-Phenylethylidene)ethane-1,2-diamine, Langmuir adsorption isotherm, quantum chemical parameters and Monte Carlo simulation.
Introduction
Carbon steel (C-steel) is among the most widely used materials in many industrial fields, such as metal processing equipment, marine applications, nuclear power plants, fossil fuel plants and construction. Acidic solutions, especially hydrochloric acid (HCl), are often used in many industrial processes, including acid pickling, chemical cleaning, elimination of localized deposits, and removal of undesirable scale in metals working. However, materials could be corroded during these applications, resulting in waste of resources [1].
For reducing materials corrosion rate, many methods have been used, but inhibitors remain one of the most practical techniques for corrosion protection in acidic media [2], especially organic compounds containing heteroatoms, such as nitrogen (-N-), oxygen (-O-), and sulfur (-S-) [3], and also compounds with multiple bonds (π-π), as they adsorb onto the C-steel surface [4-6].
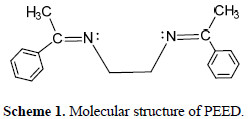
The aim of this study is to investigate the inhibition effect of N1,N2-bis(1- phenylethylidene)ethane-1,2-diamine (PEED) on C-steel corrosion, in a 1.0 M HCl solution, using electrochemical measurements. Every quantum chemical parameter was obtained by DMol3/GGA/PW91/DNP+ level of theory in an isolated form, which helped to understand PEED adsorption properties. PEED's molecular structure is shown in Scheme 1:
.
Experimental work
Synthesis of N1,N2-bis(1-phenylethylidene)ethane-1,2-diamine
N1,N2-Bis(1-Phenylethylidene)ethane-1,2-diamine (PEED) was prepared by condensation under reflux in ethanol, with two equivalents of acetophenone, and ethylenediamine (Reaction 1)..

The reaction mixture was heated at reflux for 4 hours. The solvent was evaporated under vacuum, and then cooled to 0 °C. The yellow solid was collected and washed with hexane and ether, with a percentage yield = 60%. (Table 1) shows some physical properties of the reactants and of the product.
.

IR spectroscopy of PEED
IR spectroscopy of the N1,N2-BIS(1-phenyl ethylidene)ethane-1,2-diamine ligand (PEED) showed, by comparison with the infrared spectrum of ethylenediamine and acetophenone, the disappearance of ketone's bands of vibration of .C=O, located to 1750 cm-1, and of .NH2, at 3300 cm -1, characteristic of a primary amine.
.The IR spectroscopy also showed the appearance of a new band at 1620 cm-1, corresponding to the vibration of .C=N [7], and another band at 1510 cm-1, corresponding to the vibration of .C=C, as illustrated in (Table 2).
.

Material preparation
The chemical composition of the C-steel used in this work is shown in (Table 3).

The sample surface was prepared by polishing with emery paper at various grades ranging from 100 to 1200, rinsing with distilled water, degreasing in acetone, and drying in hot air. The C-steel specimens had a rectangular shape. A 1.0 M HCl solution was prepared by dilution of analytical grade HCl (37% w/w) with distilled water.
Polarization measurements
Electrochemical experiments were carried out using a potentiostat (Voltalab-PGZ 301), coupled to a computer equipped with Voltamaster 4 software. The working electrode consisted of a 1.0 cm2 C38 steel disk. Prior to each experiment, the electrode was polished using emery papers ranging from 100 to 1200 grades. After that, the electrode was ultrasonically cleaned with distillate water. A saturated calomel electrode (SCE) was used as reference electrode. The counter electrode was a platinum plate with a large surface area. In addition, the working electrode was immersed in the test solution for 30 min, until a steady state open circuit potential was reached. Tafel polarization curves were recorded by scanning the electrode potential from - 900 mV to -100 mV, under potentiodynamic conditions corresponding to 1.0 mV/s, and under air atmosphere.
Impedance spectroscopy measurement
Electrochemical impedance spectroscopy (EIS) is an efficient method for corrosion studies of metallic materials. It was carried out using a transfer function analyzer (VoltaLab PGZ 100), with a small amplitude a.c. signal (10 mV), over a frequency domain of 100 kHz to 10 mHz. The EIS diagrams have been illustrated in the Nyquist representation. The results were then analyzed in equivalence terms.
Quantum chemical calculations
The quantum chemical calculations were carried out to elucidate the correlation between the inhibitor molecular structure and its efficiency. Quantum chemical calculations were performed using the DMol3 module implemented in material studio v8.0, distributed by BIOVIA (formerly Accelrys) [8]. The geometry of the studied compound was evaluated using GGA/PW91 level and DNP+ basis set for all atoms [9-13]. Theoretical parameters, such as energy of the highest occupied molecular orbital (EHOMO), energy of the lowest unoccupied molecular orbital (ELUMO), energy gap (ΔE g = EHOMO - ELUMO), dipole moment (µ), electron affinity (A = -ELUMO), ionization potential (I = -EHOMO), and number of transferred electrons (ΔN) were calculated.
The absolute electronegativity (.) is the measure of the ability of an atom or group of atoms to attract electrons to them [14], and can be approached as the following equations [15]:


where χ is the absolute electronegativity, η is the hardness, and σ is the softness. The dipole moment (μ) is another index that is often used for the prediction of the direction of a corrosion inhibition process. It is a polarity measure in a bond, and is related to the electrons distribution in a molecule [16]. The fraction of electrons transferred from the inhibitor to the metallic surface (ΔN) was estimated according to Pearson theory [17], by using the following equation:

where ΔN is the fraction of transferred electrons, χFe and χinh are iron absolute electronegativity and the inhibitor molecule, and ηFe and ηinhinh are iron absolute hardness and the inhibitor molecule, respectively. The theoretical value for iron electronegativity was χFe = 7 eV, and a global hardness of ηFe = 0 eV [18].
Monte Carlo simulations
The Monte Carlo (MC) simulation was used to calculate the low-configuration adsorption energy of the interactions between the single inhibitor molecule (PEED) and the clean iron surface in a 1.0 M HCl solution. The Metropolis Monte Carlo [19] methodology, with the adsorption locator module [20], implemented in the Materials Studio (Accelrys) [8] package, was used to build a system (iron substrate / inhibitor / solvent molecules). The simulations were carried out with a slab thickness of 5 Å, a supercell of 6 × 6, and a vacuum of 30 Å along the C axis in a simulation box, (25.17 × 25.37 × 40.26) Å3 with periodic boundary conditions to model the representative part of the interface devoid of any arbitrary boundary effect. For the entire simulation procedure, COMPASS force field [21] was used to optimize the structures of all the corrosion system components (PEED / Fe (111) / 110 H2O / 2 HCl). To mimic the actual corrosion environment, the effect of ions such as (H3O+) and (Cl-) was also taken into account during the simulation [22-23]. This calculation study aimed to find low energy adsorption active sites to study the preferential adsorption of inhibitory molecules onto the iron surface in an acidic medium, in order to find a relationship between the effect of the inhibitor's molecular structure and its inhibition efficiency [23].
Results and discussion
Effect of concentration
Potentiodynamic polarization measurements
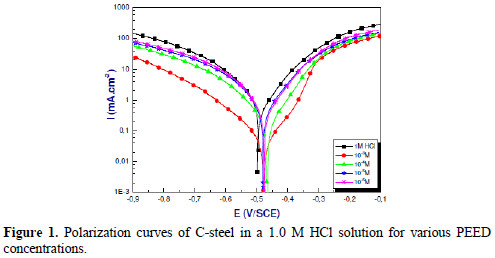
Fig. 1 shows the polarization curves of C-steel in a 1.0 M HCl solution, in the absence and presence of various inhibitor concentrations.
The inhibition efficiency for each concentration was calculated using Equation 5. The electrochemical parameters, such as Icorr, Ecorr, Tafel slopes (βc and βa) and percentage inhibition efficiency (IE %), were calculated using Equation 5.

where Icorr and I'corr are the corrosion current densities without and with various inhibitor concentrations, respectively. The corrosion current densities were determined by the extrapolation of the Tafel slopes in Table 4, where it can be seen that the current density decreases in the inhibitor presence.

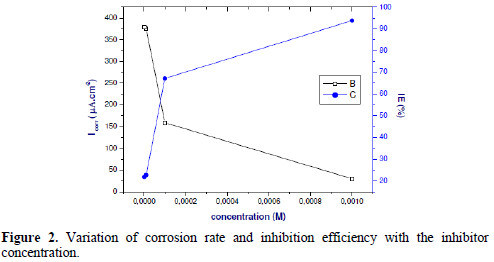
Therefore, the inhibitory efficiency increases with higher additive concentrations, reaching a maximum value of 93.8%, at 1.0x10⁻³ M (Fig. 2).
Literally, when the displacement in the potential is greater than 85 mV / Ecorr, the inhibitor may be considered as of the anodic or cathodic type; it will be considered as mixed, if the displacement in the potential is less than 85 mV / Ecorr [24]. In our case, the maximum displacement is less than 85 mV /Ecorr, suggesting that PEED acted as a mixed inhibitor. Fig. 1 shows that the potential value of 1.0x10⁻³ M is greater than -350 mV vs. SCE. The PEED compound begins to be desorbed, reflecting the formation of anodic protective films containing oxides, which explains the obtained inhibition efficiency [25].
Electrochemical impedance spectroscopy (EIS)
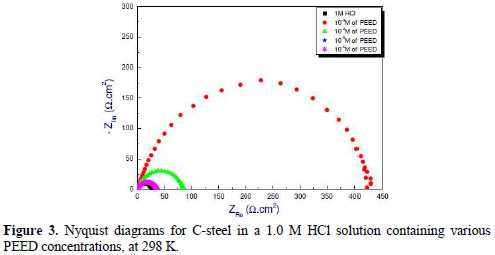
C-steel corrosion behavior in an acidic solution, in the presence of our compound, was studied by EIS at 298 K, after 30 minutes of immersion at the corrosion potential. Nyquist C-steel plots, in uninhibited and inhibited acid solutions containing different PEED concentrations, are shown in Fig. 3.
The impedance parameters derived from these plots are regrouped in Table 5.

Double layer capacitance values (Cdl) and charge-transfer resistance values (Rct were obtained from the impedance measurements. Rct values were used to calculate the inhibition efficiency (IE%), according to the following equation (6):

where Rct and R'ct are the charge transfer resistance, in the inhibitor absence and presence, respectively.
The presence of a single capacitive loop in the impedance diagrams indicates the formation of a protective layer on the metal surface, leading to corrosion inhibition. This capacitive loop is generally attributed to the electronic charge transfer process [26].
From the results shown in Table 5, it can be seen that the charge transfer resistance (Rct) increases with higher inhibitor concentrations, while the double layer capacity (Cdl) decreases. The decrease in Cdl values could be attributed to the inhibitory molecule adsorption (PEED) onto the metal surface [27], and to the replacement of the water molecules at the electrode interface by the organic inhibitor [28]. Therefore, the inhibitory efficiency increases with higher inhibitor concentrations, reaching a maximum value of 93.8%, at 1.0x10⁻³ M.
The Nyquist plots impedance was analyzed by fitting the experimental data to a simple equivalent circuit model presented in Fig. 4; it includes the solution resistance (Rs) and the constant phase element (CPE), which are placed in parallel to the charge transfer resistance (Rct).

Effect of temperature
Polarization curves
The effect of temperature on C-steel corrosion inhibition efficiency in a 1.0 M HCl solution with optimal inhibitor concentration, at temperatures ranging from 298 to 328 K, was taken by potentiodynamic polarization measurements (Fig. 5).
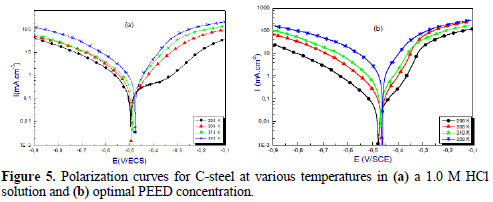
The results obtained from the polarization curves are shown in Table 6.
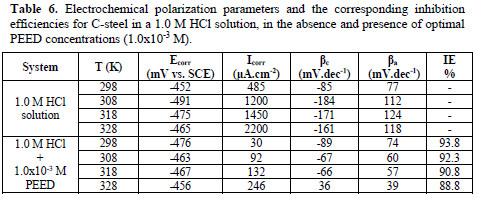
Table 6 shows that the inhibition efficiency slightly increases with the decrease in temperature in the inhibitor presence, which indicates that higher temperatures may cause a slight inhibitor desorption from the C-steel surface.
Kinetic parameters
In order to get more details on the corrosion process, activation kinetic parameters, such as activation energies in free and inhibited acidic solutions, were calculated using Arrhenius equation:

where A is Arrhenius factor, Ea is the apparent activation corrosion energy (KJ·mol-1), R is the gas constant (8.314 J·mol-1·K-1) and T is the absolute temperature (K).
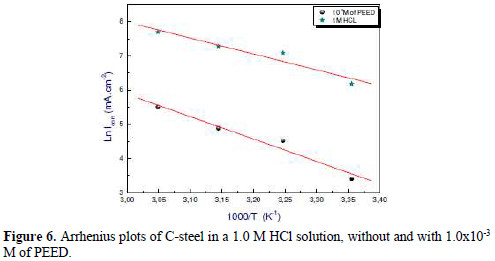
The activation energy (Ea) was calculated from the plots slope (Ln Icorr) versus (1000/T) (Fig. 6), for C-steel in a 1.0 M HCl solution, with and without 1.0x10⁻³ M of PEED, and is listed in Table 7.

The enthalpy and entropy of the corrosion process were determined from the effect of temperature, using the alternative Arrhenius formulation [29].

where N is the Avogadro's number, h is the Plank's constant, R is the gas constant, and ΔS* and ΔH* are the entropy and enthalpy of activation, respectively.
Fig. 7 shows the Ln (Icorr/T) plot of C-steel, as a function of 1000/T in a 1.0 M HCl solution, in the absence and presence of 1.0x10⁻³ M of PEED at different temperatures.
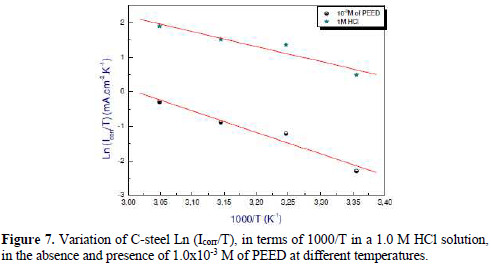
Table 7 clearly shows that the activation energy (Ea) of the inhibited solution was higher than that of the uninhibited solution. Hence, it can be suggested that the inhibitor molecule (PEED) adsorption onto the C-steel surface in a 1.0 M HCl solution was carried out via physical adsorption [26].
The enthalpies positive sign reflects the endothermic nature of the C-steel dissolution process. The entropy activation values (ΔS*) increase with the optimum PEED concentration, which implies that an increase in disordering is taking place on going from reactants to the activated complex [29].
Adsorption isotherm
Several adsorption isotherms were tested, and the Langmuir adsorption isotherm was found to be the best one to describe the adsorption behavior of the investigated inhibitor. The Langmuir isotherm is given by the following equations :


where C is the inhibitor concentration, θ is the fraction of the C-steel surface coverage, which is determined by IE%/100, K is the equilibrium constant for the adsorption/desorption process, ΔGads is the standard free energy of the adsorption reaction, R is the universal gas constant, T is the thermodynamic temperature, and the value of 55.5 is the water concentration in the solution, in mol.L-1.
The plot of Cinh/θ as a function of Cinh yielded a straight line, as shown in Fig. 8.
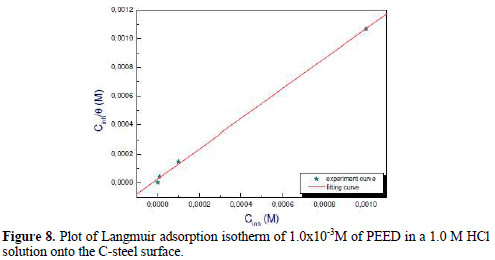
The linear regression coefficient (R2) was almost equal to 1 (R2 = 0.9999), and the slope approached unity, indicating that PEED adsorption onto the C-steel surface is well described by the Langmuir adsorption model. The calculated values of ΔG0ads and Kads for PEED are regrouped in Table 8.

When ΔG0ads values are around -20 kJ mol-1, the interaction between the inhibitor molecule and the metal surface is associated with physisorption, while those of - 40 kJ.mol-1 or higher involve a strong coordinate covalent bond, i.e., chemisorption [30-33]. In the present work, the ΔG0ads value is equal to -36 KJ.mol-1,which means that the inhibitor molecule (PEED) adsorption onto the Csteel surface is chemisorption.
Theoretical calculations
Molecular reactivity
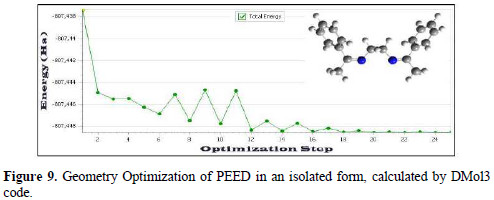
The calculated global descriptors responsible for the inhibition efficiency, obtained from theoretical calculations, such as the energy of the highest occupied molecular orbital (EHOMO), the energy of the lowest unoccupied molecular orbital (ELUMO), the energy gap (ΔE), and other descriptors obtained by DMol3 module at (GGA/HCTH/DNP+) level of theory in vacuum, are shown in Table 9.

The optimization energy curves of the single inhibitor molecule, as well as the frontier molecular orbital distributions for PEED's neutral form, are shown in Figs. 9 and 10.
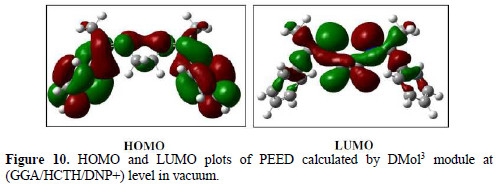
HOMO of PEED shows the electron density obtained from phenylethylidene rings, while LUMO predominantly came from the nitrogen atoms of ethanediamine; consequently, these are the favorite sites for the interaction with the metallic surface.
Generally, the inhibitor adsorbs onto the metallic surface by a donor-acceptor interaction between the vacant d-orbital of the iron atoms and the p-electrons of the compound studied [34]. The energy gap value provides a measure for the stability of the formed complex on the metallic surface. As a result, there was good inhibition efficiency, due to the energy required for removing an electron from the lowest occupied orbital to the higher unoccupied orbital [35].
If the value of the charge transfer rate (ΔN) was > 3.6, the inhibition efficiency increased with an increasing electron donor capacity on the steel / electrolyte interface [36], which was our case. The lower dipole moment values (µ) will favor the inhibitor accumulation onto the metal surface layer; therefore, a higher inhibition efficiency will be reached [37].
The calculated local Fukui functions and Mulliken atomic charges were used to analyze the local reactivity of the PEED inhibitor, and to reflect its local nucleophilicity and electrophilicity trend [37]. The calculated values of the local reactivity descriptors on the PEED's nitrogen atoms (N37 and N38) are given in Table 10.

It can be seen from Table 10 that the largest values of f- are located on the N37 and N38 heteroatoms, which indicates that these two heteroatoms prefer to form a chemical bond by electrons donation to the metallic surface. In its turn, the largest values of f+ are located on the N37 and N38 heteroatoms, which further suggests that these are responsible for forming a back bond by the acceptance of electrons from the metal surface to the inhibitor (PEED), and vice versa.
Monte Carlo simulation
Monte Carlo (MC) simulations, using the adsorption locator module implemented in the Biovia Material Studio v8.0 software from Accelrys Inc. USA, were adopted to compute the interaction adsorption energy for the PEED inhibitor molecule /Fe(111) system in an hydrochloric acid medium. Fig. 11 shows the interaction energies fluctuant curves for the PEED inhibitor molecule /Fe(111)/110H2O/2HCl) system.
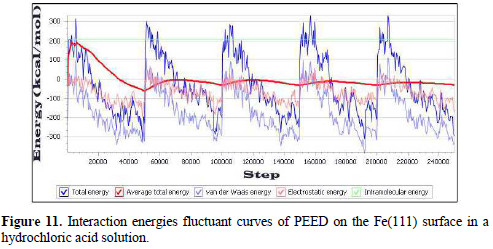
All calculations of total energy, vdWls energy, average total energy, electrostatic energy and intramolecular energy between PEED and the Fe(111) surface, in the adsorption process obtained by the adsorption locator module, are depicted in Fig. 11 .
The geometry optimization for the inhibitor molecule (PEED) was carried out using an iterative process, where atomic coordinates are adjusted until the total energy of the individual structure reaches the minimum energy, i.e., it corresponds to a local minimum in the potential energy surface. In this study, PEED has been placed on the iron (111) surface in a hydrochloric acid solution to find out the lowest adsorption energy sites, along with their suitable configuration obtained by the adsorption locator module, as shown in Fig. 12.
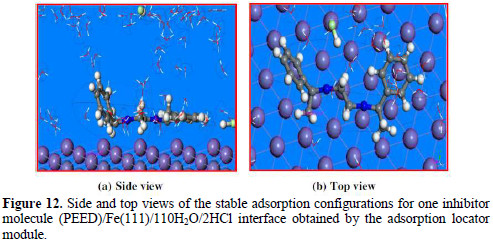
Side and top views of the stable adsorption configurations, for one inhibitor molecule (PEED)/Fe(111)/110H2O/2HCl system obtained by the adsorption. It can be noticed from Fig. 12 that the adsorption active sites of the PEED inhibitor, on the Fe (111) surface in an acidic medium, are the lone pair of nitrogen (=N37- and =N38-) atoms and π-π electrons of the benzene ring. It was also observed that PEED adsorbed almost parallel onto the Fe (111) surface in the hydrochloric acid medium (110H2O/2HCl), in order to maximize the contact and surface coverage, ensuring a strong interaction between adsorbate and substrate. This is mainly due to the extension of a high inhibition effect experimentally observed (%IE = 93.8 %). For PEED, the calculated dihedral angles around the phenyl-ethylidene ring were close to 0° or 180°, indicating planarity of the phenyl-ethylidene ring.
The measured shortest bond distances (Fig. 12) between the active sites (=N37- and =N38-) and the Fe(111) surface of the Fe-inhibitor (PEED) complex, in an hydrochloric acid solution at equilibrium, were as follows: (dFe-N37: 3.452 Å, and dFe-N38: 3.444 Å). The two distances of the bonds were above the value of 3.4 Å, which indicates that the interaction is of the vdWls type. The strong interaction of the system ensures that the chemical nature of the adsorption process is chemisorption, which was confirmed by the high energy value of R.A.E (in absolute values). This indicates that PEED inhibitor is an efficient inhibitor. Several outputs and descriptors calculated by the adsorption locator module are presented in Table 11.
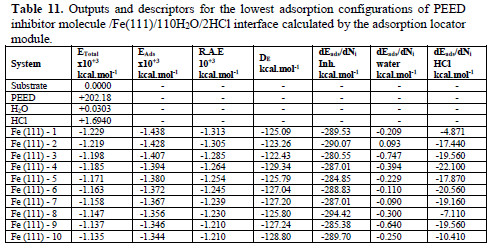
The parameters include: total energy (ETotal) for PEED inhibitor molecule /Fe(111)/110H2O/2HCl system, which is defined as the sum of the energies of the adsorbate components, the rigid adsorption energy (R.A.E), and the deformation energy (DE). The substrate energy (Fe(111) surface) is taken as zero (Table 11). The adsorption energy (EAds) is related to the energy released (or required) when the relaxed adsorbate component was adsorbed onto the substrate. The adsorption energy is defined as the sum of the rigid adsorption energy and the deformation energy for the adsorbate component. The rigid adsorption energy is related to the energy released (or required) when the unrelaxed adsorbate component (before the geometry optimization step) was adsorbed onto the iron (111) surface. The deformation energy (DE) reports the energy released when the adsorbed component was relaxed on the substrate surface. Table 11 also shows (dEad/dNi, which reports the energies of PEED inhibitor, H2O, and HCl configurations, where one adsorbate component has been removed. The values for the outputs and descriptors, calculated by the adsorption locator module for the Fe (111)/PEED/ system in an acidic solution, are displayed in Table 11.
Table 11 clearly shows that the adsorption energy value of the Fe-inhibiting (PEED) complex is negative (-1.438 ×10³ kcal.mol-1), indicating that adsorption spontaneously occurs. The large negative value indicates that the Fe-(PEED) inhibitor complex is very stable, and that strong adsorption occurs in hydrochloric acid. The adsorption energy value of the PEED configuration was -289.53 Kcal.mol-1 at equilibrium, which is much higher than that of the HCl molecules (-4.871 kcal.mol-1), and than that of the water molecules (-0.209 kcal.mol-1). This indicates the possibility of a progressive replacement of H2O and HCl molecules on the iron surface, leading to the formation of an inhibitor stable layer, which can protect the metallic surface against aqueous corrosion. These results indicate that the inhibiting molecule (PEED) has the strongest interaction on the iron surface in a hydrochloric acid solution, which corroborates very well the experimental results. The adsorption density of the inhibiting molecule (PEED), on the iron surface in a hydrochloric acidic solution, is presented in Fig. 13.
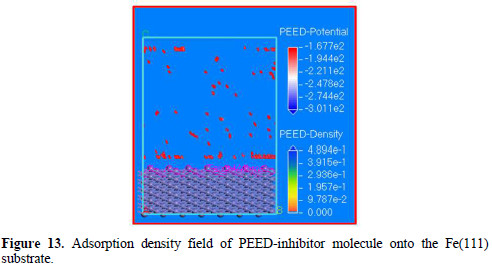
Fig. 13 shows a range from the minimum to the maximum value of the force field of PEED adsorption centers onto the Fe(111) surface in an acidic medium, and shows the minimum and average values of the entire field. The iso-surface colors change to reflect the minimum and maximum values associated with the field that has been mapped to the electron density using the electrostatic potential. Higher density of the dots means more likely adsorption actives sites onto the metal surface. In addition, the inhibitor has high binding energy to the Fe surface, as observed in Table 11.
Conclusions
•The studied PEED compound showed very good inhibition properties for Csteel corrosion in a 1.0 M HCl solution, reaching 93.8 % at a concentration of 1.0x10⁻³ M, and held at 298 K.
•The inhibition efficiency of the studied inhibitor increased with its higher concentrations.
•The polarization curves study showed that PEED compound was classified as a mixed type inhibitor.
•The electrochemical impedance study showed that the use of PEED significantly increases the charge transfer values, and decreases the double layer capacitance in a 1.0 M HCl solution, which indicates the formation of a protective film on the metallic surface.
•PEED adsorption on the C-steel surface obeys the Langmuir adsorption isotherm.
•Quantum chemical study revealed that PEED, in the neutral and isolated forms, had greater adsorption onto the iron surface. Molecular dynamic simulation also corroborated the experimental results.
References
1. El Kacimi Y, Touir R, Galai M, et al. Effect of silicon and phosphorus contents in steel on its corrosion inhibition in 5 M HCl solution in the presence of Cetyltrimethylammonium/KI. J Mater Environ Sci. 2016;7:371- 381.
2. Belghiti ME, Tighadouini S, Karzazi Y, et al. J Mater Environ Sci. 2016;7:337. [ Links ]
3. Belghiti ME, Karzazi Y, Tighadouini S, et al. J Mater Environ Sci. 2016;7:956. [ Links ]
4. Ben Hmamou D, Salghi R, Zarrouk A, et al. Int J Electrochem Sci. 2012;7:5716. [ Links ]
5. Zarrouk A, Hammouti B, Al-Deyab SS, et al. Int J Electrochem Sci. 2012;7:5997. [ Links ]
6. Zarrouk A, Zarrok H, Salghi R, et al. Int J Electrochem. 2012;7:6353. [ Links ]
7. Adly OMI, Taha A, Fahmy SA. J Molec Struct. 2013;1054-1055:239. [ Links ]
8. Materials Studio version 8.0.0.842, Accelrys Software Inc., San Diego: 2014. [ Links ]
9. Becke AD. Density-functional thermochemistry. III. The role of exact exchange. J Chem Phys. 1993;98:5648-5652. [ Links ]
10. Eddy NO, Momoh-Yahaya H, Oguzie EE. J Adv Res. 2015;6:203. [ Links ]
11. Olasunkanmi LO, Kabanda MM, Ebenso EE. Physica E: Low-Dimensional Systems Nanostructures. 2016;76:109. [ Links ]
12. Ben Hmamou D, Salghi R, Zarrouk A, et al. Int J Electrochem Sci. 2013;8:1526. [ Links ]
13. Shahabi S, Norouzi P, Ganjali MR. Int J Electrochem Sci. 2015;10:2646. [ Links ]
14. Udhayakala P, Samuel AM, Rajendiran TV, et al. J Chem Pharmac Res. 2013;5:142. [ Links ]
15. Qachchachi FZ, Kandri Rodi Y, Elmsellem H, et al. J Mater Environ Sci. 2016;7:2897. [ Links ]
16. Chetouani A, Daoudi M, Hammouti B, et al. Corros Sci. 2006;48:2987.
17. Pearson RG. Inorg Chem. 1988;27:734.
18. Arslan T, Kandemirli F, Ebenso EE, et al. Corros Sci. 2009;51:35.
19. Metropolis N, Rosenbluth AW, Rosenbluth MN, et al. J Chem Phys. 1953;21:1087.
20. Frenkel D, Smit B. Understanding Molecular Simulation: From Algorithms to Applications. 2nd Edition. San Diego: Academic Press; 2002.
21. Sun H, Ren P, Fried JR. Comp Theor Polymer Sci. 1998;8:229.
22. Sourav Kr S, Abhiram H, Naresh CM, et al. J Mol Liq. 2016;215:486.
23. Abdelahi MMM, Elmsellem H, Benchidmi M, et al. J Mater Environ Sci. 2017;8:1860.
24. Prabhu RA, Venkatesha TV, Praveen BM, et al. Trans Indian Inst Metals. 2014;67:675.
25. El Arrouji S, Ismaily Alaoui K, Zerrouki A, et al. J Mater Environ Sci. 2016;7:299.
26. Ghazoui A, Benchat N, El-Hajjaji F, et al. J Alloys Comp. 2017;693:510.
27. Bouoidina A, El-Hajjaji F, Chaouch M, et al. Der Pharma Chemica. 2016;8:149.
28. Fouda AS, Mostafa HA, El-Taiband F, et al. Corros Sci. 2005;47:1988.
29. Ech-chihbi E, Salim R, Oudda H, et al. Der Pharma Chemica. 2016;8:200.
30. Hussin MH, Kassim MJ. Mater Chem Phys. 2011;125:461.
31. El Ouasif L, Merimi I, Zarrok H, et al. J Mater Environ Sci. 2016;7:2718.
32. John S, Joseph A. Mater Chem Phys. 2012;133:1083.
33. Niouri W, Zerga B, Sfaira M, et al. Int J Electrochem Sci. 2014;9:8283.
34. Belghiti ME, Karzazi Y, Dafali A, et al. J Mol Liq. 2016;216:874.
35. Saha SKr, Ghosh P, Chowdhury AR, et al. Can Chem Trans. 2014;2:381.
36. Lgaz H, Salghi R, Larouj M, et al. J Mater Environ Sci. 2016;7:4471.
*Corresponding author. E-mail address: anahle@sharjah.ac.ae
Received June 23, 2017; accepted December 20, 2017


