


 Inglês (pdf)
 Artigo em XML
 Referências do artigo
 Enviar este artigo por email
 Citado por SciELO
  Similares em
SciELO
Similares em
SciELO 
 Permalink
Introduction
Tartrazine (TR) is a synthetic lemon yellow azo dye primarily used as a food coloring. Much food contains TR in various proportion, which depends upon the manufactures or persons preparing the food, and is harmful to human health [1-3]. TR appears to cause more allergic reactions in the human body than the other azo dyes. Serious side effects are causing potentially lethal asthma attacks, DNA damage and tumor, in the thyroid gland. Therefore, a selective and sensitive method for reliable TR determination would have a great interest. In recent years, there have been many methods that have been used to determine TR, such as spectrophotometry [4-5], high-performance liquid chromatography [6-7], electrophoresis [8] and electrochemical method [9-20].
Cyclic voltammetry (CV) is the most versatile electroanalytical technique for the study of electroactive species and is widely used in the field of electrochemistry, organic chemistry, inorganic chemistry and biochemistry. Most of the chemists, scientists and engineers have been using CV studies to evaluate the oxidation and reduction potential of functional groups and the side effects of other groups attached to them [ 21-26].
The application of surfactants modified electrodes for electrochemical detection of some biomolecules has been widely reported [27-32] and it has indicated that the presence of a small amount of surfactant on the electrode surface showed enhanced electrochemical activity for the detection of some biomolecules, as compared with a bare electrode.
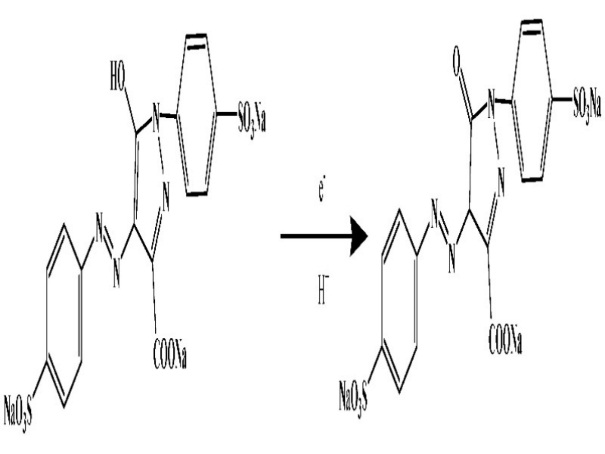
In this study, we fabricated carbon paste electrode modified by sodium dodecyl sulfate (SDS) surfactant. TR was selected as an analytical molecule for electrochemical detection. Compared to bare carbon paste electrode (BCPE), sodium dodecyl sulfate modified carbon paste electrode (SDSMCPE) shows better sensitivity and selectivity for TR determination. The proposed mechanism for TR electrochemical oxidation is shown in Fig. 1 [33].
Experimental
Chemicals and Reagents
SDS, TR, graphite and silicone oil were purchased from Nice Chemical Pvt. Ltd. Cochin. SDS stock solution (25×10-3 M) was prepared by dissolving it in double distilled water. TR was of analytical grade and used without further purification. TR stock solution (25×10-4 M) was prepared by dissolving it in distilled water. Phosphate buffer solution (PBS) was prepared by mixing 0.2 M disodium phosphate and 0.2 M monosodium phosphate. Distilled water was used throughout the preparation of solutions. Field Emission Scanning Electron Microscopy (FESEM) was obtained using the instrument operating at 5.00 kV (DST-PURSE Laboratory, Mangalore University).
Apparatus
CV and DPV were obtained using an EA -201 electroanalyser (EA - 201 Chemilink system), a conjugation with a conventional three-electrode system and a personal computer for data storage and processing. A bare or MCPE were used as working electrode, saturated calomel electrode (SCE) as reference electrode and a platinum wire as auxiliary electrode. All the experiments were carried out at room temperature.
Fabrication of BCPE and SDSMCPE
The bare carbon paste electrode (BCPE) was prepared by mixing 70% graphite powder and 30% silicone oil in an agate mortar for about 15 min, to get a homogeneous carbon paste. This carbon paste was then packed into the cavity of a Teflon tube (3 mm in diameter). Before placing the electrode for measurements, it was smoothed on a tissue paper, to get a smooth and uniform fresh surface. SDS modified carbon paste electrode was prepared by immobilizing 10 µL of SDS on the electrode surface for 5 min.
Result and discussion
CPE and SDSMCPE surface morphologies
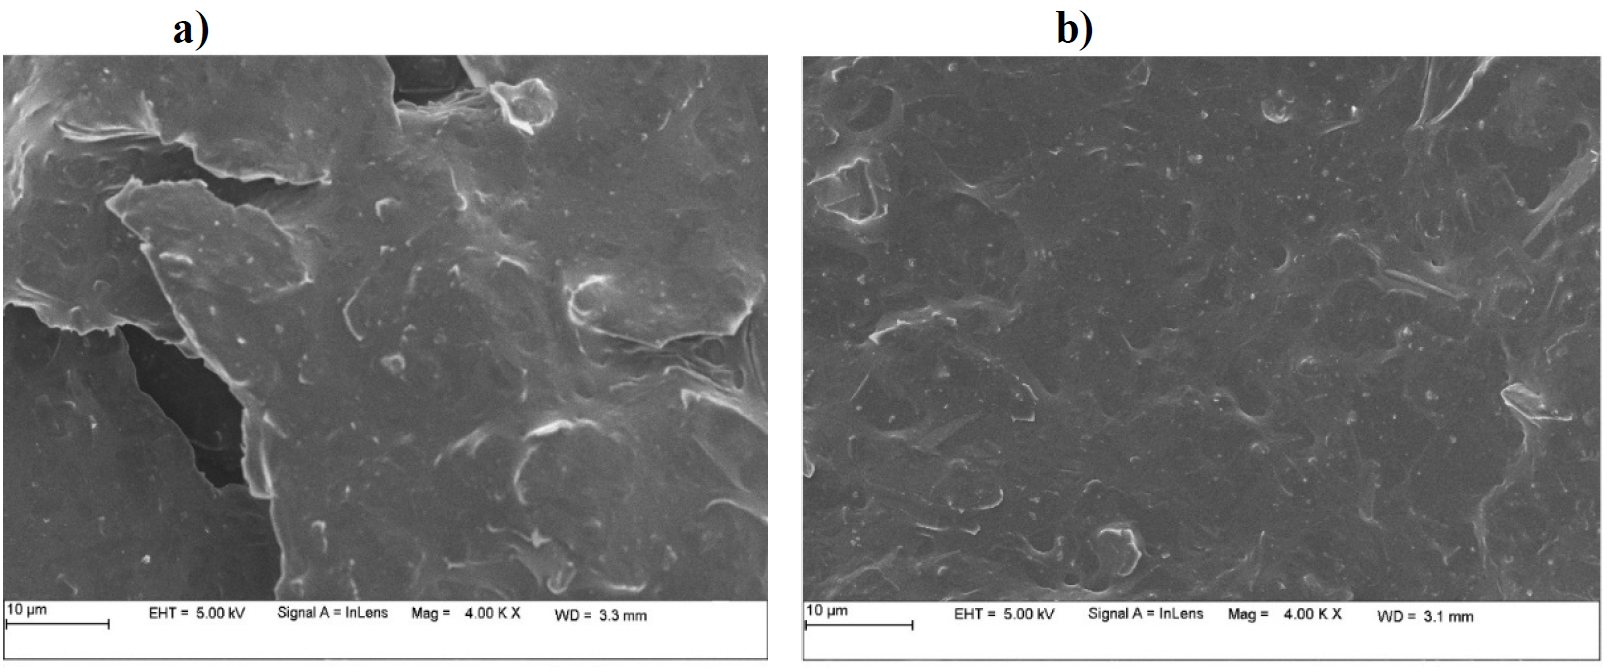
FESEM technique was utilized to characterize the surface morphology of the fabricated electrode (Fig. 2). Fig. 2 (a) shows BCPE and SDSMCPE surface morphology (Fig. 2 (b)). BCPE surface appeared to be rough. However, SDS modified surface was smooth, with an uniform SDS deposition. This confirms that the carbon paste electrode was coated with SDS surfactant.
Optimization of experimental parameters
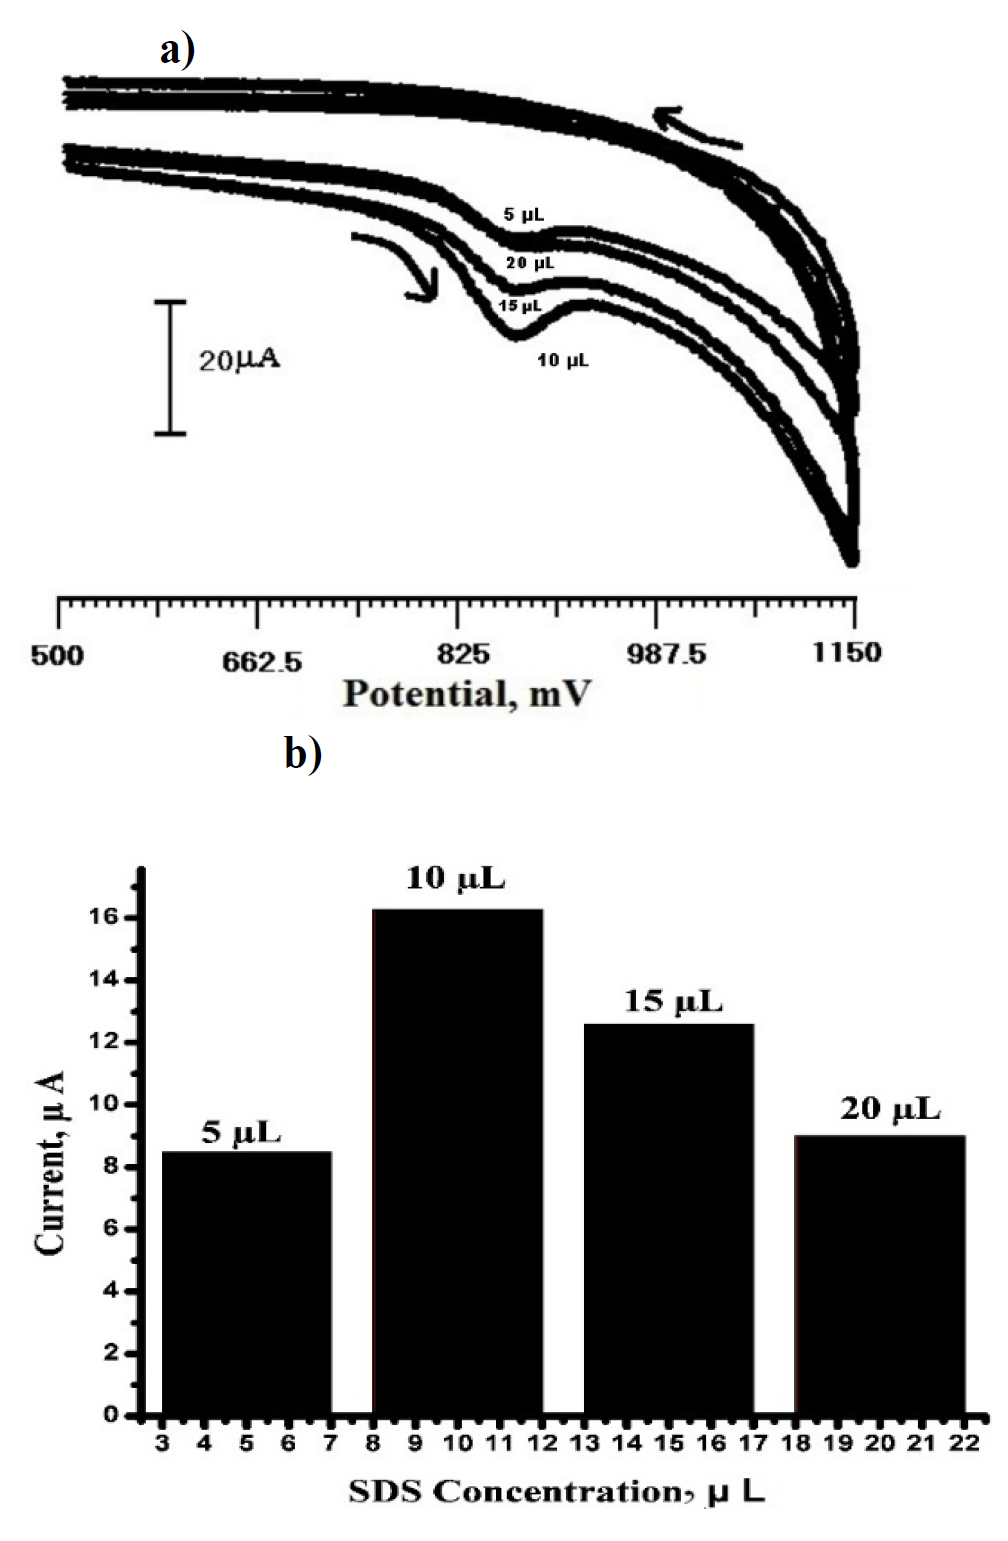
Fig. 3 shows the effect of SDS concentration that was used in the range from 5 µL to 20 µL (Fig. 3a), by immobilization on the carbon paste electrode, for investigating the variation of the oxidation peak current sensing for TR detection in 0.2 M PBS, at pH 6.5. It was observed that the peak current maximum was obtained for 10 µL of SDS immobilized carbon paste electrode. When it was used more than 10 µL of SDS immobilization of carbon paste electrode, the peak current decreased. It clearly indicates that the critical micelle concentration (CMC) was reached at 10 µL. Hence, 10 µL SDS immobilized carbon paste electrode was chosen as ideal for TR sensor studies. The dependence of the oxidation peak current of 3×10⁻⁴ M TR on different levels of SDS concentrations of immobilized carbon paste electrode is shown in Fig.3b.
SDSMCPE Stability and Repeatability
Repeatability was studied for 5 successive renewal of SDSMCPE of 3×10⁻⁴ M TR in a 0.2 M PBS buffer solution (pH 6.5). It was observed that the relative standard deviation (RSD, n = 5) was 4.35%. SDSMCPE stability was evaluated by measuring SDS peak current after continuous scanning of 40 cycles in 0.2 M PBS (pH 6.5). The percentage of SDSMCPE degradation was calculated by using the following equation:
 [] ()1
where Ipn is the nth anodic peak current and Ip1 is the first anodic peak current. The percentage of degradation was found to be 0.56 %, which shows that the modified electrode is stable.
TR Electrochemical behavior
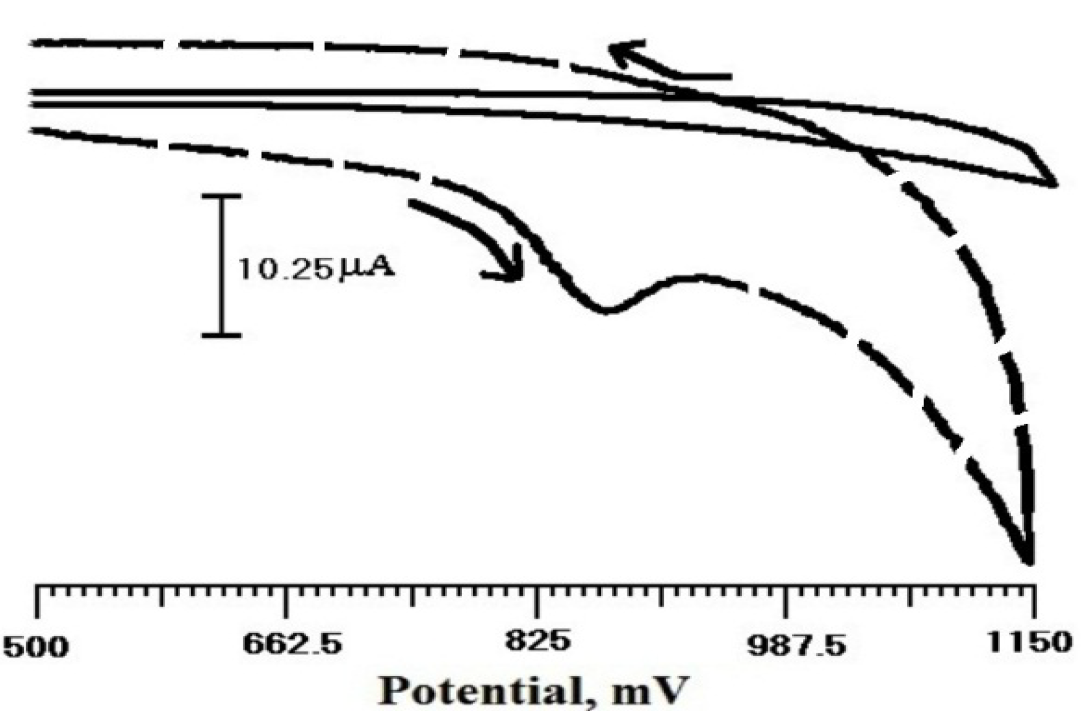
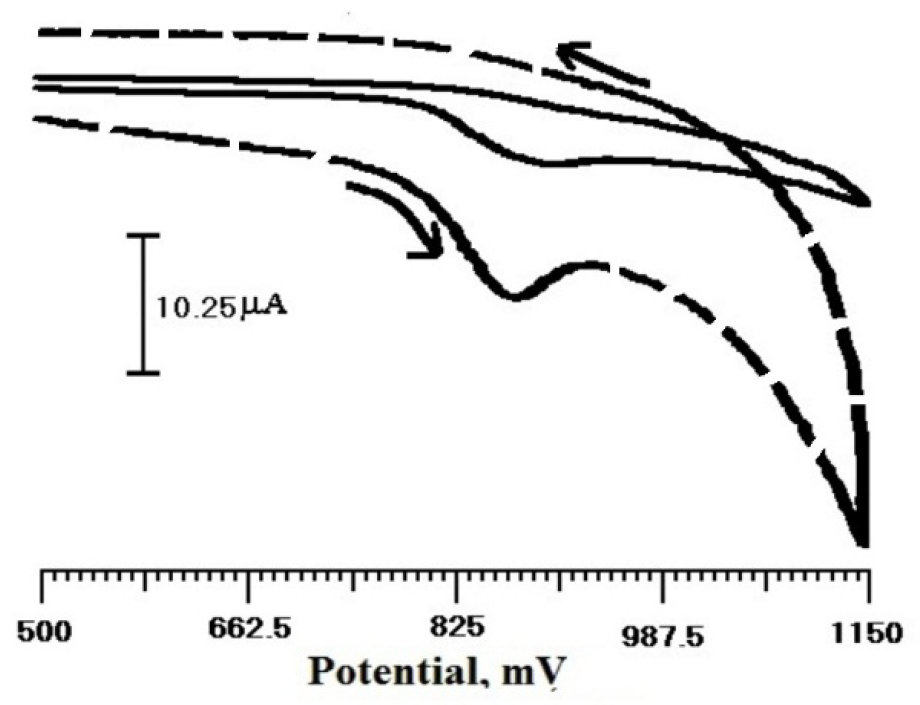
Fig. 4 shows the cyclic voltammogram of the sensor, in TR presence and absence, in 0.2 M PBS (pH 6.5), at a scan rate of 100 mV/s, within the potential window from 500 to 1150 mV. There was no peak observed (solid line) in TR absence at SDSMCPE; only a background current was observed. When TR (3×10⁻⁴ M) was added to the solution, a well-defined peak reached a potential of 873 mV, which indicates that the electrode response was proportional to the produced electroactive species.
TR Electrochemical response at SDSMCPE
The cyclic voltammogram for TR in 0.2 M PBS, with pH 6.5, at a scan rate of 100 mV/s was investigated in the potential range from 500 to 1150 mV. Fig. 5 shows TR cyclic voltammogram at BCPE (solid line) and SDSMCPE (dashed line). At BCPE, a weak and broad oxidation peak was observed at about 906 mV. However, TR oxidation current on SDSMCPE was higher than that of BCPE, indicating the catalytic activity towards TR oxidation.
Effect of scan rates on TR electrochemical response at SDSMCPE
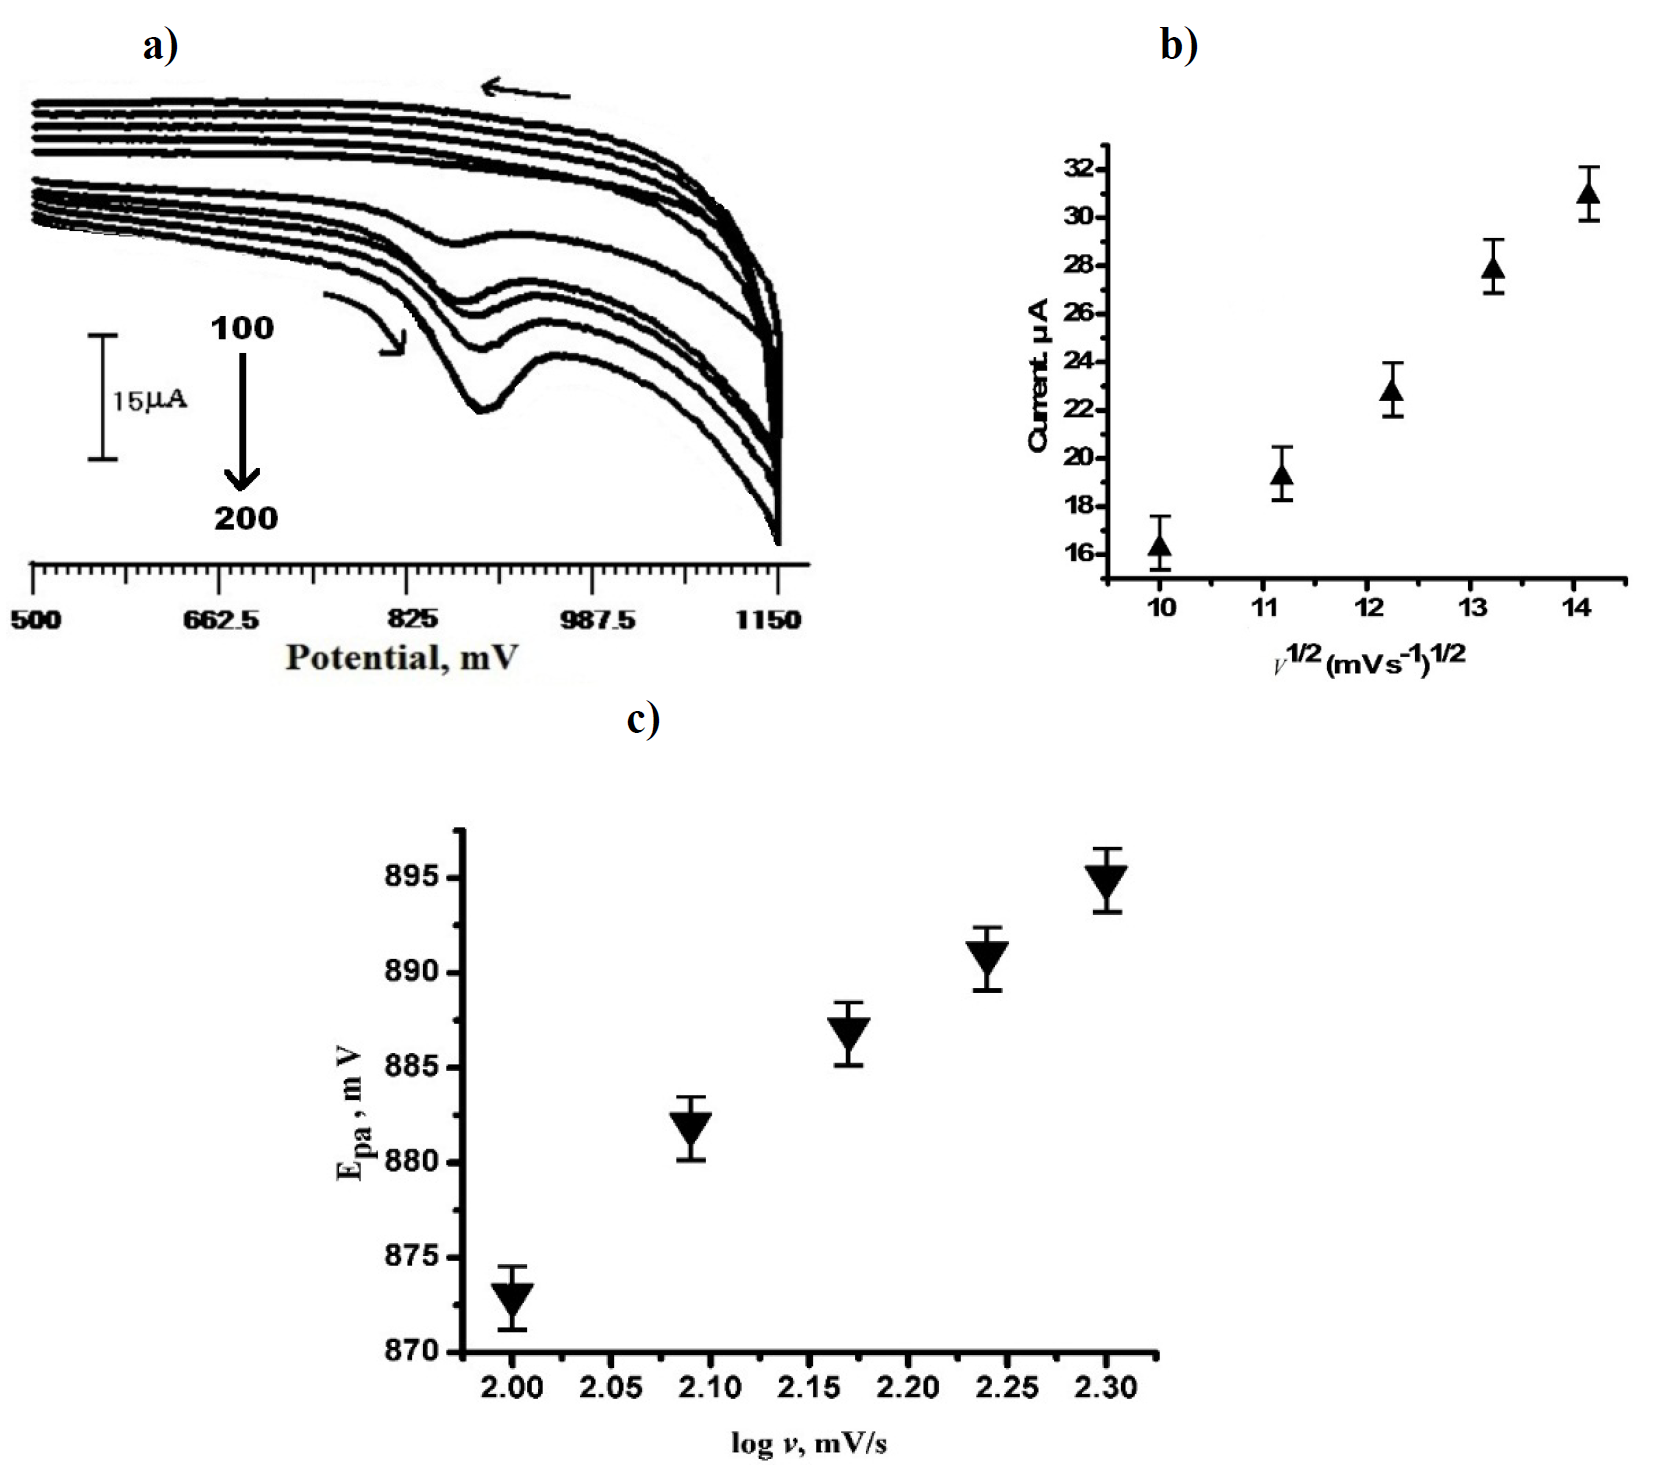
TR cyclic voltammogram (3×10⁻⁴ M) on SDSMCPE, at different potential scan rates, is shown in Fig. 6 (a), in the range from 100 to 200 mV/s, in 0.2 M PBS, with pH 6.5, as a supporting electrolyte.
With the increase in the scan rate, the oxidation peak current also increased gradually, indicating the direct electron transfer between TR and SDSMCPE surface. TR anodic peak current (Ipa) was proportional to the square root of the scan rate (v 1/2), with a linear regression equation:
 ()2
()2
with the correlation coefficient of 0.99203 (Fig. 6 b).
It indicates that TR oxidation is diffusion controlled. Peak potential, Epa, and log (v) relation are explained in the following equation:
 [] ()3
where v is the scan rate, b is the Tafel slope and also a constant value. From the Epa versus log (v) graph (Fig. 6 c), the slope is 71.2. Therefore, the Tafel slope becomes 142.4. By considering α (transfer coefficient) as 0.43, the number of electrons involved in TR oxidation reaction was calculated as 0.96~=1; the result was in accordance with the mechanism that has been explained in Fig. 1.
Effect of pH on peak potential and peak current
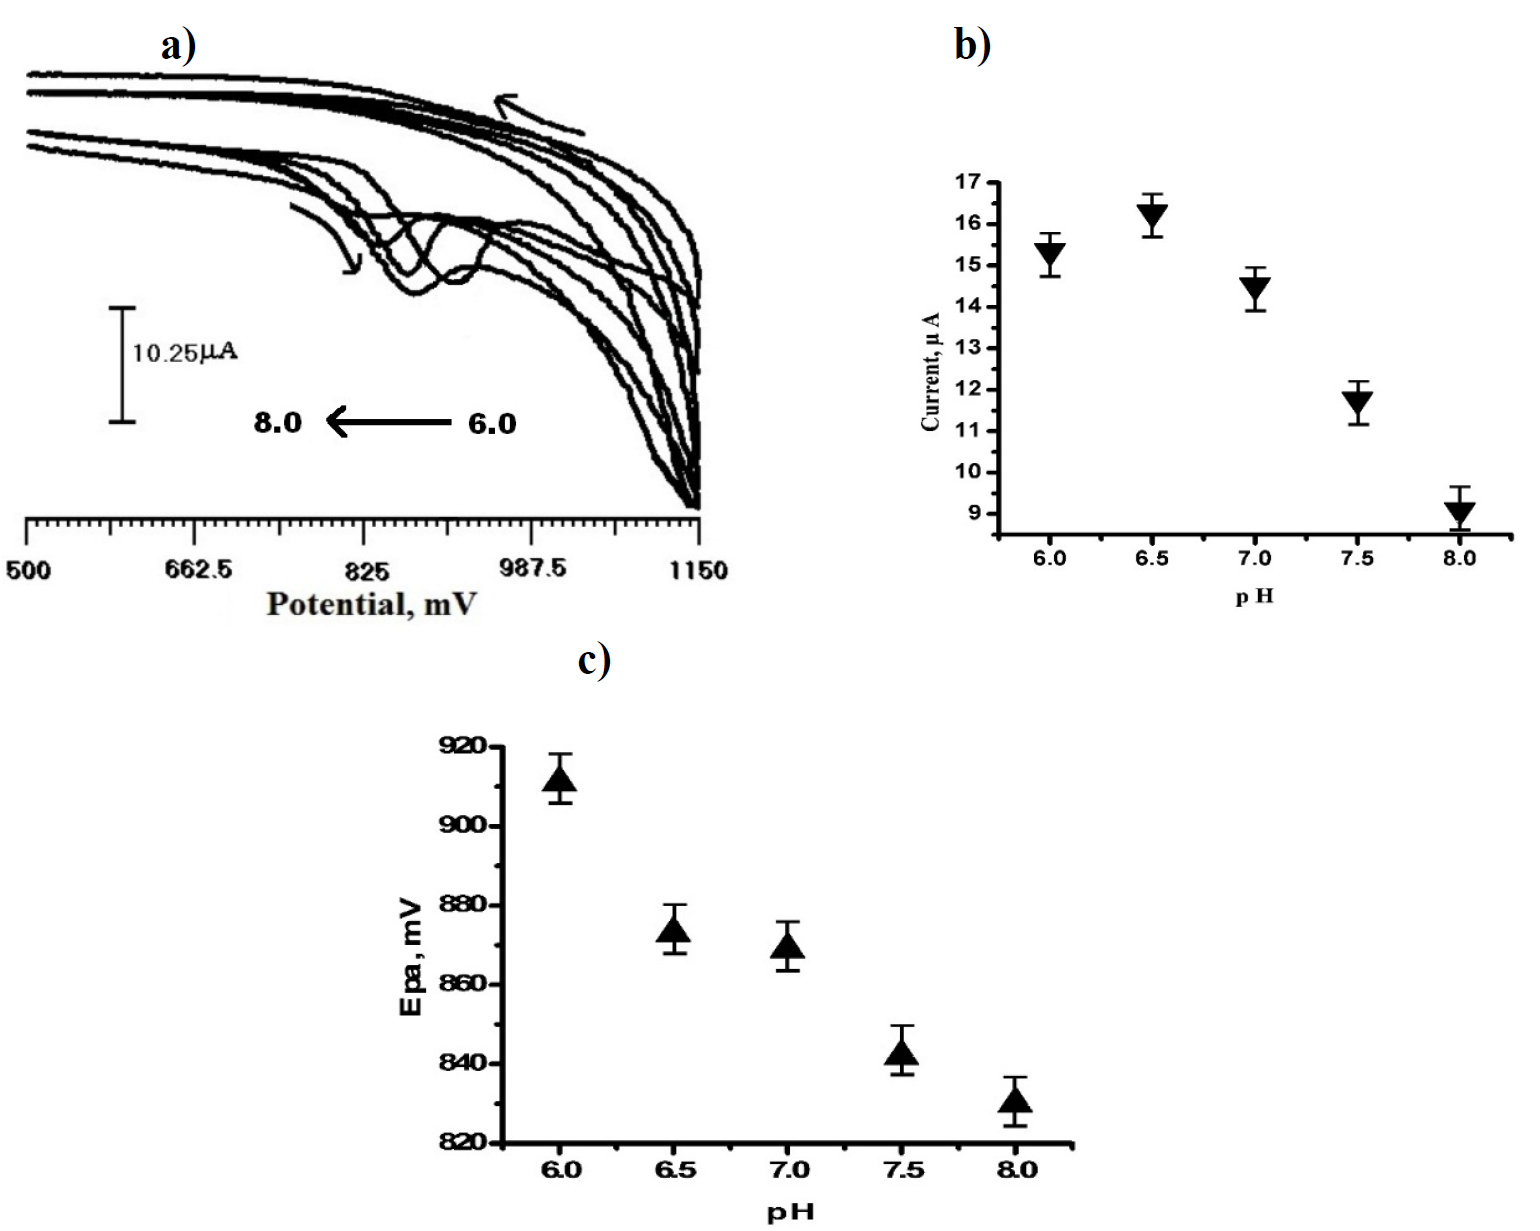
Fig. 7 (a) shows the effect of pH on SDSMCPE electrochemical response in 3×10⁻⁴ M TR, with the pH range from 6.0 to 8.0, in a 0.2 M PBS solution. As the pH increased from 6.0 to 8.0, the anodic peak potential shifted towards a negative value, and a well-defined peak obtained with high peak current, at pH 6.5, are shown in Fig. 7 (b). Thus, the solution of pH 6.5 was used for TR determination. TR anodic peak potential shifted from 911 mV to 830 mV, with respect to the pH from 6.0 to 8.0. The potential diagram was constructed by plotting anodic peak potential, Epa, Vs pH (Fig. 7 (c)). The linear regression equation is given below:
 ()4
()4
with a correlation coefficient (R) = 0.97109.
TR calibration plot and limit of detection
CV is a sensitive electrochemical technique which is used to determine TR linear range and detection limit. The calibration plot for TR determination at SDSMCPE, with pH 6.5 PBS, at the scan rate of 100 mV/s, is shown Fig. 8. TR anodic peak current response is directly proportional to TR concentration, over a range from 2×10⁻⁵ to 5×10⁻⁵ M and 6×10⁻⁵ to 1.1×10⁻⁴ M. The linear regression equation (4) is,
 ()5
()5
with a correlation coefficient of 0.99731.
The detection limit ( , where Sb is the standard deviation of the blank response and m is the slope of the calibration plot) [36-37] and limit of quantification (10Sb/m) were found at the values of 52×10-7 M and 17×10-6 M, respectively. The limit of detection and limit of quantification were used to describe the smallest concentration of an analyte that can be reliably measured by an analytical procedure. The performance of the developed electrode is compared and listed in Table 1, in reference to the already published research articles [9, 10, 11, 12]. The fabricated electrode shows a good sensitivity (0.048 µA/µM) and good stability towards TR determination.
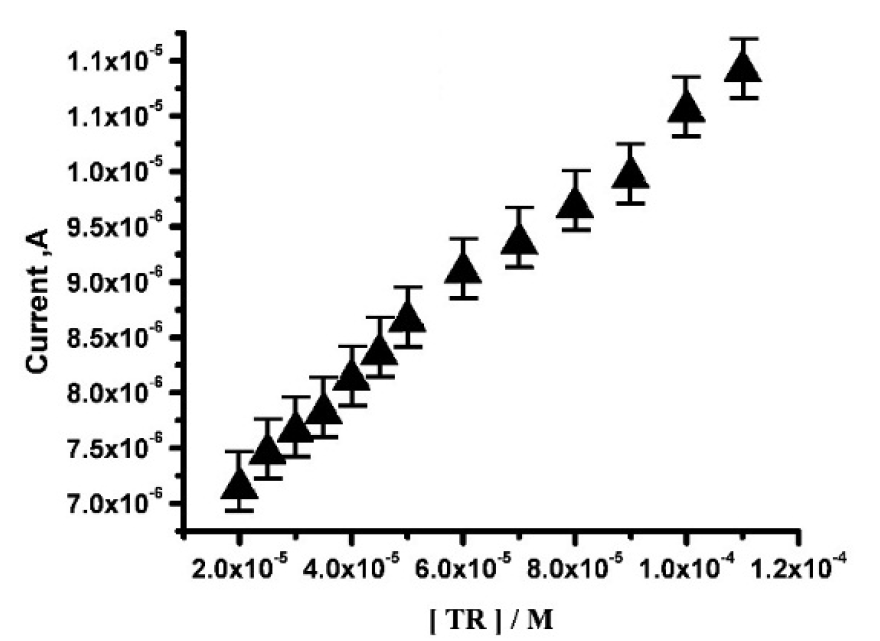
Figure 8 Calibration plot for TR determination at SDSMCPE, with PBS at pH 6.5, at the scan rate of 100 mV/s.
TR electrocatalytic oxidation by DPV, at BCPE and SDSMCPE
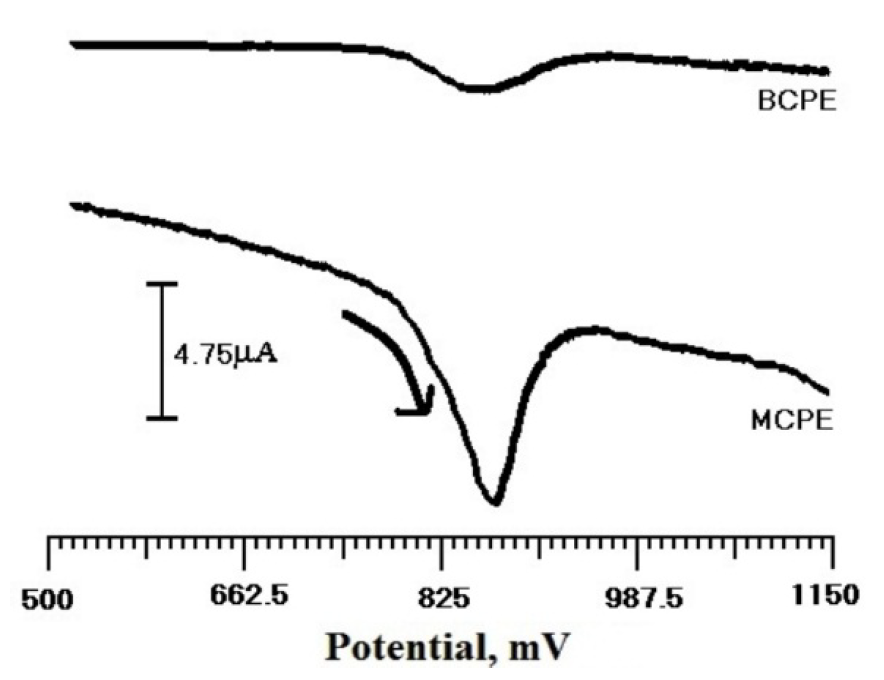
Fig. 9 depicts TR DPV response (3×10⁻⁴ M), at BCPE and SDSMCPE, in 0.2 M PBS (pH 6.5), in the potential range from 500 to 1150 mV. The anodic peak potential for TR oxidation at SDSMCPE was found to be 867 mV. The oxidation current obtained for SDSMCPE was higher than that obtained for TR at BCPE. Hence, it could be concluded that SDSMCPE improves the characteristics of TR oxidation.
Analytical application
In order to illustrate the application of the suggested sensor in real sample analysis, tiger lemon yellow powder was selected, having been purchased from a local supermarket. The content was determined using standard addition method. The value of the recovery was in the range from 97.1 to 104%, which indicated that the fabricated sensor represented a good and easy way of monitoring TR in real samples.
Conclusion
This work demonstrates that the modified CPE was fabricated by using SDS through immobilization technique. TR voltammetric behavior was investigated by CV in 0.2 M PBS (pH 6.5). The influence of different parameters on TR oxidation, such as pH, scan rate and concentration was also investigated. TR oxidation was found to be irreversible with a controlled diffusion process. SDSMCPE exhibited excellent electrocatalytic activity and well voltammetric performance during TR oxidation. The sensor was characterized by a good sensitivity, selectivity and fast response and low detection limit (52×10-7 M), with satisfactory stability, repeatability and good potential application towards the TR determination in a real sample.

