Introduction
Mild steel is the most extensively investigated metal for corrosion studies, due to its wide application in various corrosive media. For instance, in oil industries, aqueous acidic media are used for descaling, and acid pickling and treatment. In this case, the exposure of these metals to aqueous acidic solutions causes corrosion. The use of inhibitor substances is one of the most practical approaches to protect the metals from corrosion in acidic environments [1-6]. Organic molecules with polar groups (including N, S, and O), heterocyclic compounds with polar functional groups, and conjugated double bonds can effectively inhibit steel corrosion, due to their chelating action and to the formation of an insoluble physical diffusion barrier on the substrate surface [7-15]. Moreover, the inhibitor substance adsorption onto the steel/corrosive solution interface is affected by the inhibitor molecule chemical structure, the metal nature and charged surface, the distribution of charge over the whole inhibitor molecule, and the type of corrosive medium. If a substitutive polar group (-NH2, -OH, -SH, etc.) is added to the N-heterocyclic ring, its electron density will subsequently increase, facilitating the adsorption capacity.
As important N-heterocyclic compounds, Schiff bases are also used as efficient corrosion inhibitors for mild steel in HCl media, due to the -C=N- group presence [16,17]. The lone pair of electrons on N and O atoms, and the planarity of the molecule inhibitor are important for its adsorption onto the metal surface [18]. Since Schiff's bases are non-toxic and biodegradable, the testing of their corrosion protective properties is significant, in the context of the current priority to synthesize inhibitor molecules with low environmental impact.
Several authors have demonstrated that, not only the p electron of the Schiff bases enters unoccupied orbitals of transition metals, but also that the π* orbital can accept the electrons of transition metal d-orbitals, to form feedback bonds [19], thus enabling the existence of a metal-inhibitor bond. In addition, Schiff bases have recently been reported as effective corrosion inhibitor substances for various metals, such as steel, aluminum and copper, in acidic media. The greatest advantages of Schiff bases are [20, 21]: (a) they can be conveniently synthesized from inexpensive raw materials; (b) they contain an electron cloud on the aromatic ring or electronegative atoms, such as nitrogen and sulfur, in relatively long chain compounds; (c) and they are harmless to the environment, which encouraged us to test this type of inhibitor.
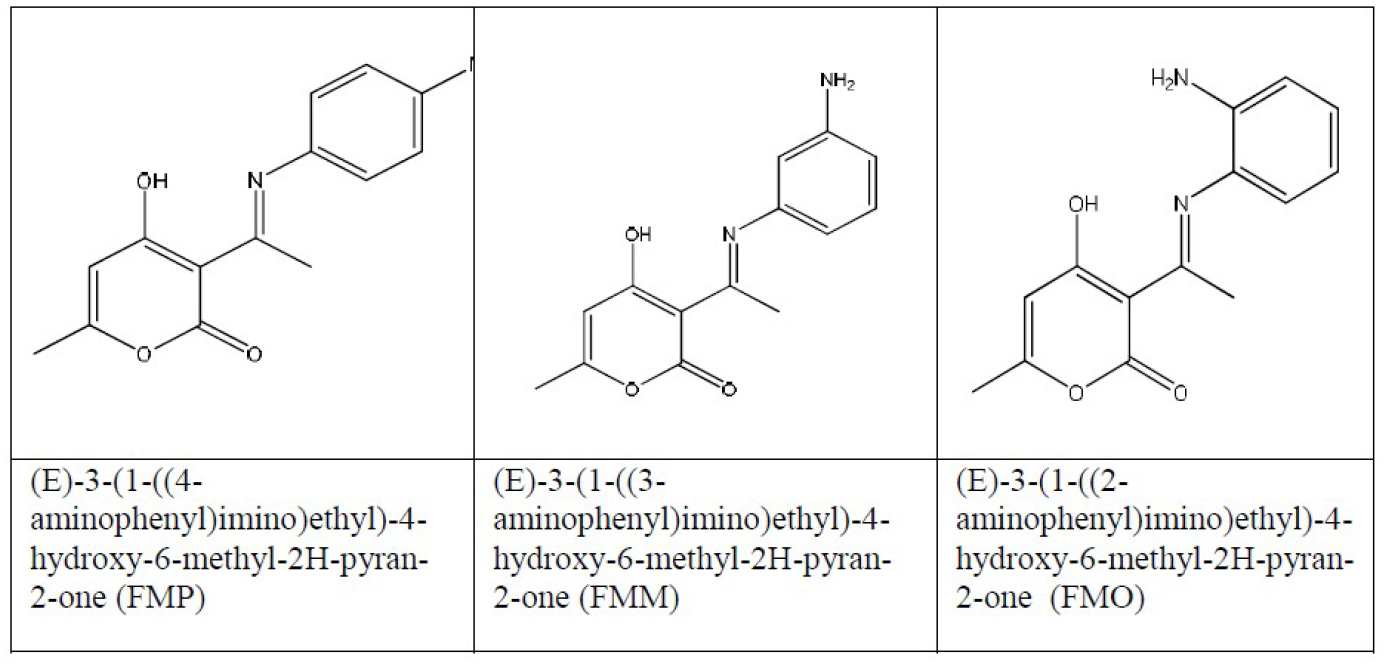
In the present work, FMO, FMM and FMP corrosion inhibitive behavior, mechanism and effectiveness, on mild steel in hydrochloric acid solutions, was examined and studied by DFT (Density Functional Theory) and Monte Carlo simulation. The structures of these tested inhibitors are shown in Fig. 1.
Experimental details
Materials
The steel used in this study was mild steel, with a chemical composition (in wt %) of 0.09 %P, 0.01 % Al, 0.38 % Si, 0.05 % Mn, 0.21 % C, 0.05 % S, and the remainder iron (Fe). The specimens and solutions were prepared as reported earlier [22].
Solutions
The 1.0 M HCl aggressive solutions were prepared by dilution of analytical grade 37% HCl with distilled water. The concentration of (E)-3-(1-((2-aminophenyl)imino)ethyl)-4-hydroxy-6-methyl-2H-pyran-2-one (FMO), (E)-3-(1-((3-aminophenyl)imino)ethyl)-4-hydroxy-6-methyl-2H-pyran-2-one (FMM) and (E)-3-(1-((4-aminophenyl)imino)ethyl)-4-hydroxy-6-methyl-2H-pyran-2-one (FMP) ranged from 1.0x10⁻⁵ M to 1.0x10⁻³ M.
Corrosion tests
Weight loss measurements
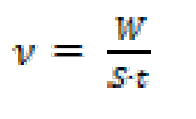
Gravimetric experiments were performed according to the "ASTM G 31-72" standard method [23]. Weight loss experiments were carried out as described in the literature [22]. All experiments were performed in triplicate, average values were reported, and good reproducibility was obtained. The corrosion rate (ν) and the inhibition efficiency (η) were calculated using the following equations [24]:
where W is the three-experiment mild steel average weight loss, S is the total surface area of the specimen, t is the immersion time and ν0 and ν are the corrosion rate values, without and with FMO, FMM and FMP addition, respectively.The fractional surface coverage, (, can be easily determined from weight loss measurements by the ratio η(%)/100, if one assumes that η(%) values do no differ substantially from (.
Electrochemical measurements
The electrochemical measurements were carried out using a Volta lab (Tacussel- Radiometer PGZ 100) potentiostat, and controlled with Tacussel corrosion analysis software model (Voltamaster 4), under a static condition. The electrochemical experiments were conducted as reported earlier [22]. From the obtained polarization curves, the corrosion current (Icorr) was calculated by curve fitting, using the following equation:
where βa and βc are the anodic and cathodic Tafel slopes, respectively, and ∆E is E - Ecorr.
The inhibition efficiency was evaluated from the measured Icorr values using the following relationship:
where Icorr and Icorr(i) are the corrosion current densities for mild steel electrode, in the uninhibited and inhibited solutions, respectively.
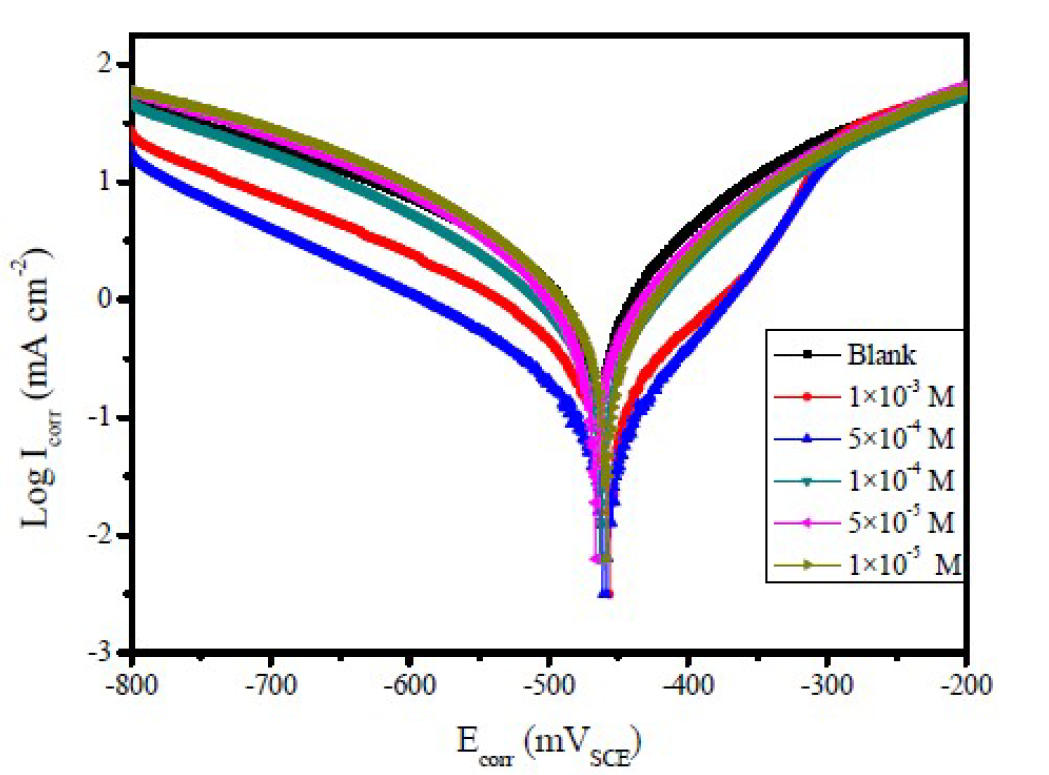
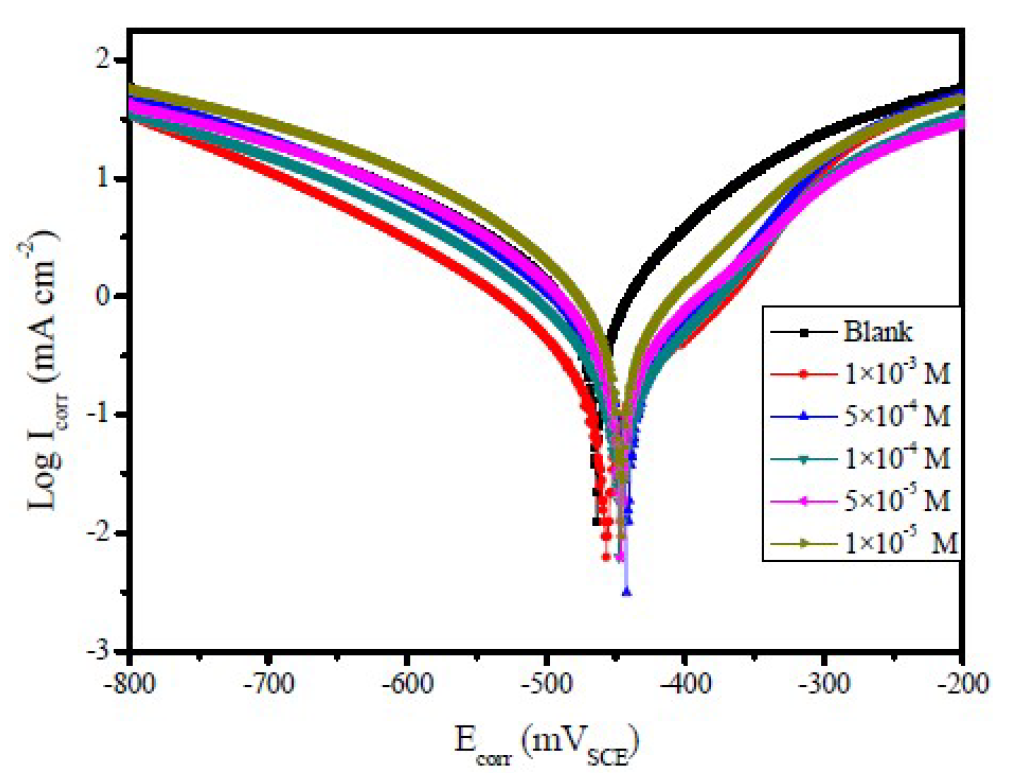
Figure 2 Polarization curves of mild steel, in 1.0 M HCl, with and without different FMM concentrations, at 308 K.
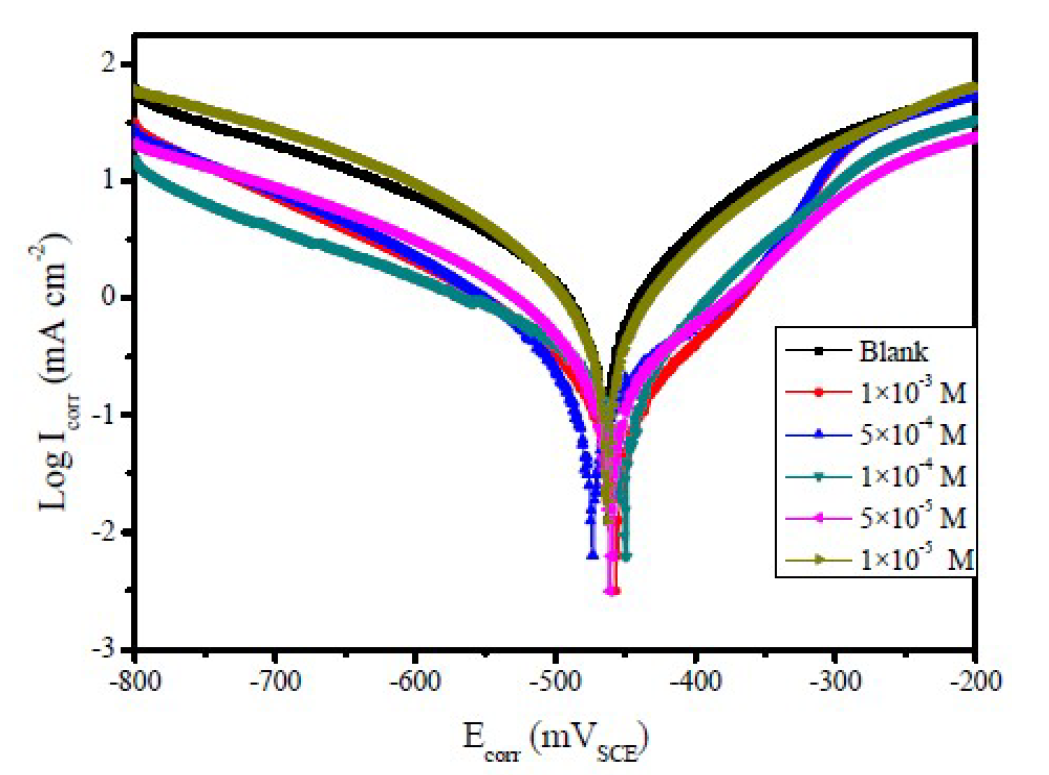
Figure 3 Polarization curves of mild steel, in 1.0 M HCl, with and without different FMO concentrations, at 308 K.
Results and discussion
Potentiodynamic polarization curves
Figs. 2 to 4 show the typical Tafel curves obtained for mild steel, in 1.0 M HCl with and without FMO, FMM and FMP compounds.
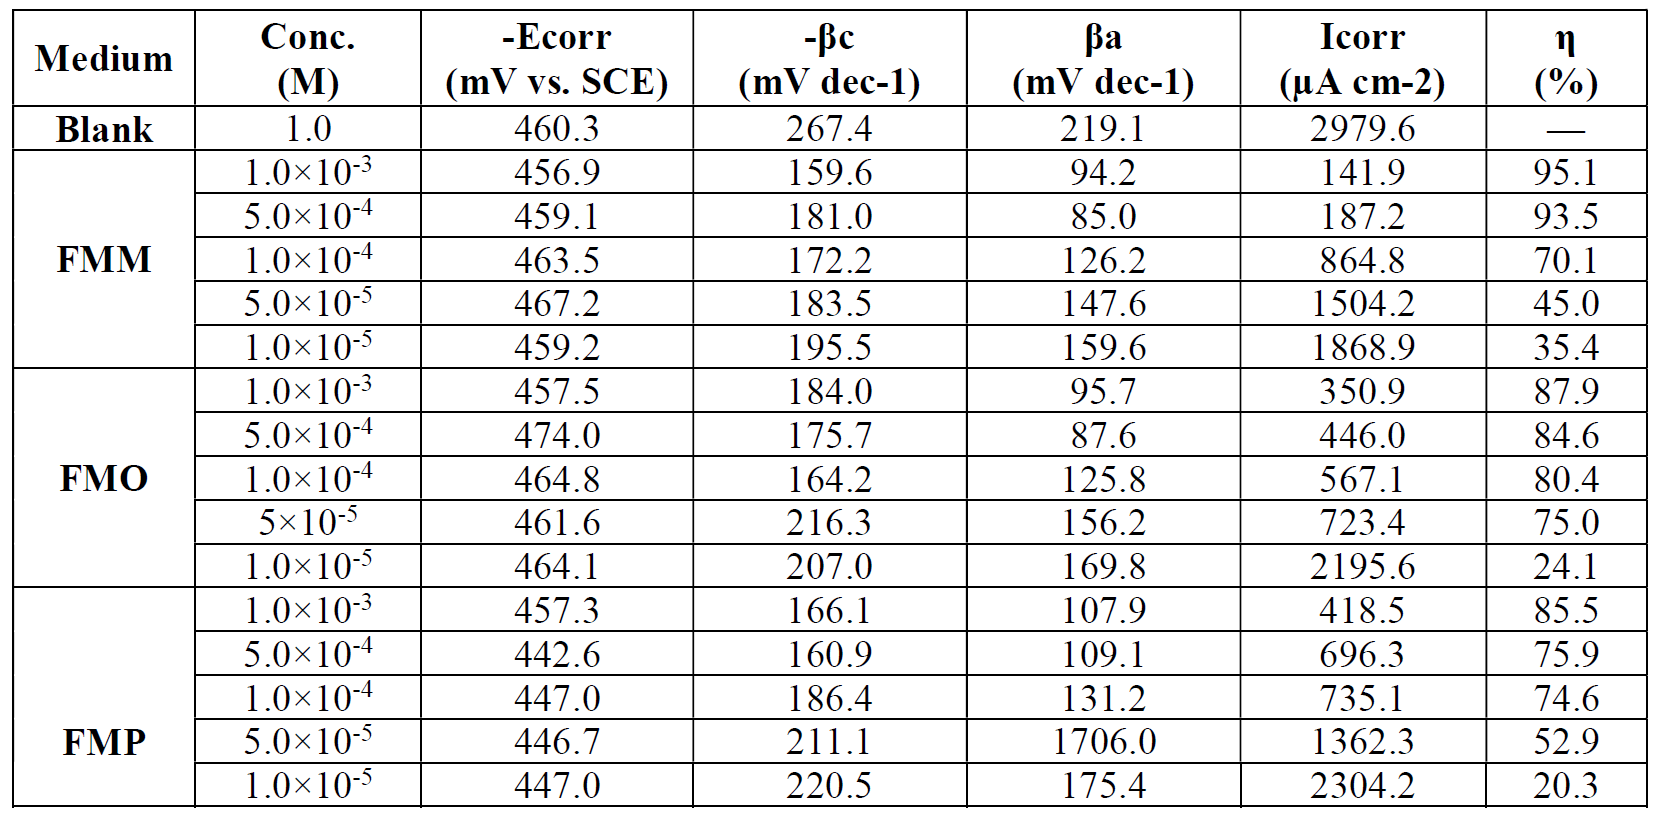
The values of potentiodynamic kinetics parameters, i.e. corrosion potential (Ecorr), corrosion current density (Icorr), anodic Tafel slopes (βa), cathodic Tafel slopes (βc) and inhibition efficiency (η(%)) values were determined from the polarization curve, being presented in Table 1.
Table 1 Electrochemical parameters for mild steel, in a 1.0 M HCl solution, without and with different concentrations of Schiff base derivatives, at 308 K.
In FMO, FMM and FMP inhibitors presence, the curves shift towards a lower current density region, compared to the blank acid medium. This suggests that the studied FMO, FMM and FMP molecules reduce the corrosion current and, therefore, decrease the corrosion rate. The polarization curves also exhibit some shifts in potential towards more anodic or cathodic regions, relatively to the acidic blank solution. The direction of the shift is not uniform, as it varies with FMO, FMM and FMP concentrations. This suggests that FMO, FMM and FMP compounds affect both the anodic and cathodic corrosion reactions. The parallel cathodic polarization curves, shown in Figs. 2 to 4, indicate that FMO, FMM and FMP molecules do not change the mechanism of hydrogen reduction, and that the hydrogen evolution is activation-controlled.
The Tafel slopes, βa and βc values show a change with the added FMO, FMM and FMP concentrations, being generally lower than those of the blank. Obviously, a greater decrease in Icorr values was observed at high FMO, FMM and FMP concentrations. In general, an inhibitor can be classified as of the anodic or cathodic type, if the shift in Ecorr is higher than 85 mV, with respect to the blank Ecorr, and as a mixed type inhibitor, if the shift in the Ecorr is lower than 85 mV [25, 26]. In our present investigation, maximum displacement in the Ecorr values was 6.9 mV for FMM, 13.7 mV for FMO and 17.7 mV for FMP.
Table 1 shows a decrease in the corrosion rate, in FMO, FMM and FMP presence. This effect is hugely marked at higher FMO, FMM and FMP concentrations. The inhibitive action is more explicit using η(%) data, increasing with higher inhibitor concentrations, reaching 85.5 % for FMP, 87.9 % for FMO and 95.1 % for FMM, at 1.0x10⁻³ M. FMO, FMM and FMP inhibited mild steel corrosion in 1.0 M HCl, but the FMM inhibitor was found to exhibit the best inhibition action. The protective properties of such compounds are probably due to the interaction between π-electrons of the benzene and pyran rings, and the positively charged mild steel surface. The oxygen and nitrogen atoms are the adsorption centers for their interaction with the metal surface [27].
Electrochemical impedance spectroscopy (EIS)
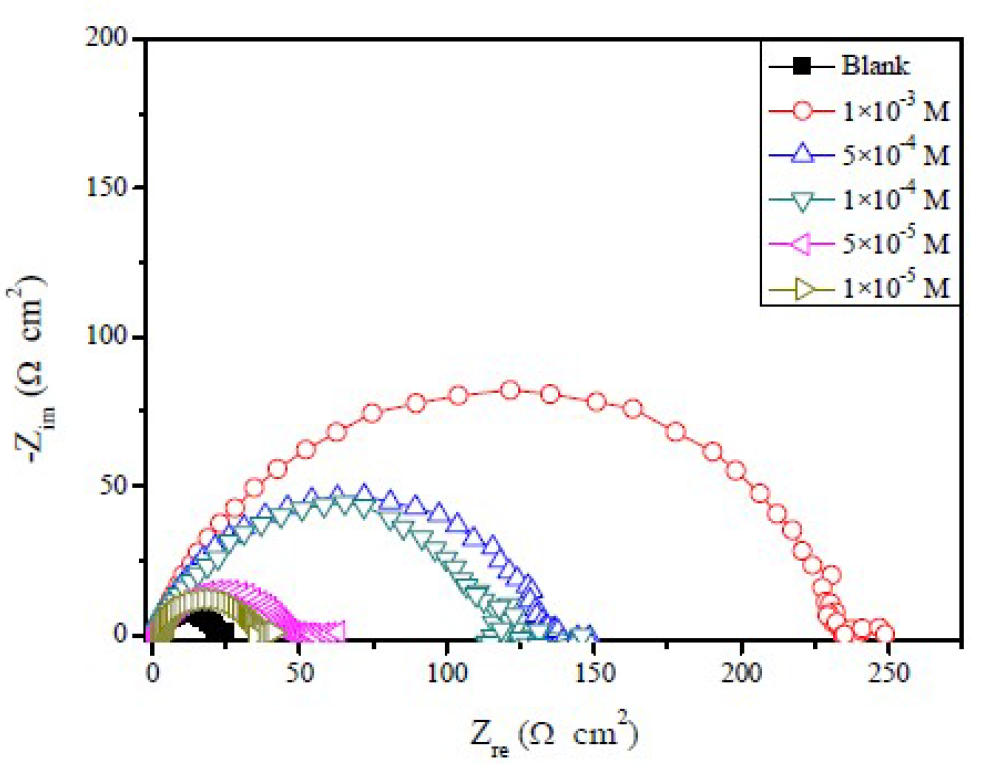
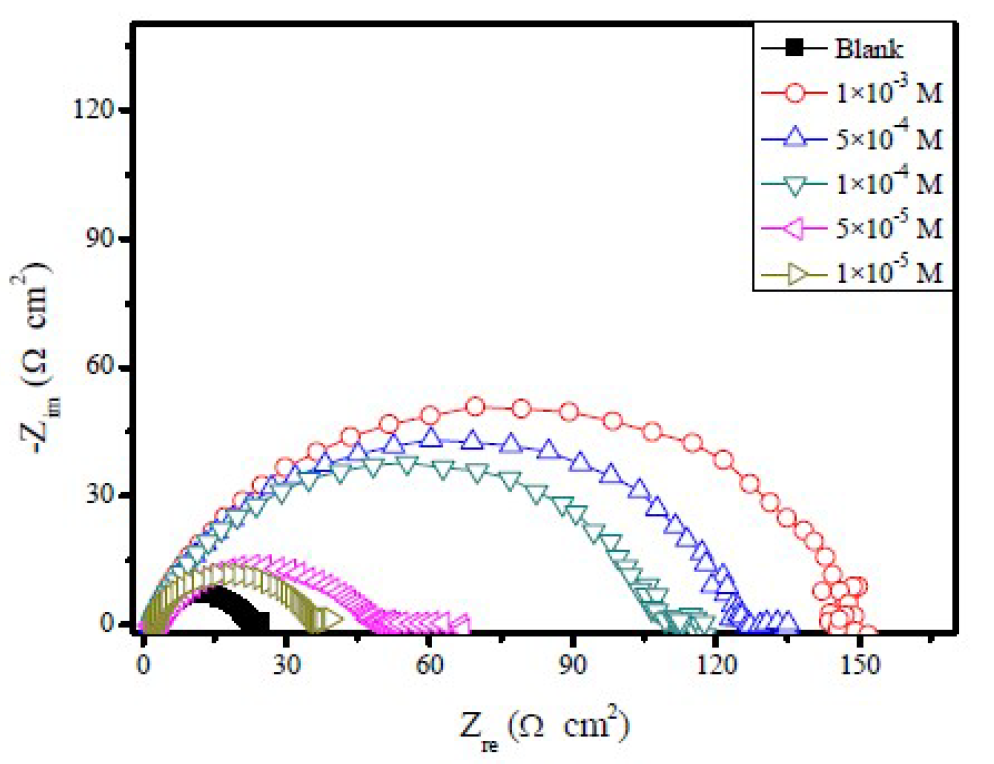
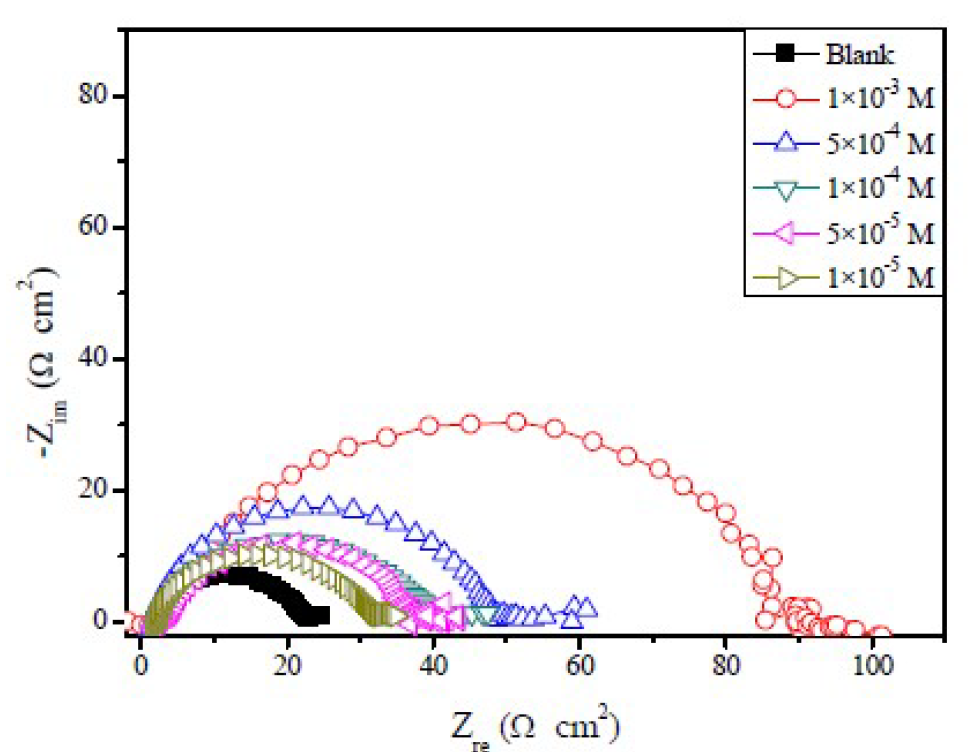
The effect of FMO, FMM, and FMP on mild steel corrosion inhibition, in 1.0 M HCl, was also investigated by EIS method. The Nyquist plots obtained for mild steel in 1.0 M HCl, in the absence and presence of different FMO, FMM and FMP concentrations, are shown in Figs. 5 to 7.
It is obvious that the EIS spectra of FMO, FMM and FMP with and without solutions show similar characteristics, suggesting that the mild steel corrosion mechanism is similar in both cases. The impedance spectra, at different concentrations of the investigated Schiff base derivatives, showed a single capacitive loop, which suggests that FMO, FMM and FMP adsorption took place through simple surface coverage, and that the studied compounds behaved as primary interface inhibitors [28]. It is also evident, from Figs. 5 to 7, that the diameter of the Nyquist plots increases with higher FMO, FMM and FMP concentrations, which is attributed to the formation of a protective film on the mild steel surface, leading to a successful retardation of the corrosion process [29].
For a metallic system corroding in an acidic solution (in our case, 1.0 M HCl), the replacement of capacitance by CPE gives a better approximation 30. CPE is defined in impedance representation, as follows:
where Q is the CPE constant, ω is the angular frequency (rad s-1), i2 = -1 is the imaginary number and n is a CPE exponent that can be utilized as a gauge of the surface heterogeneity or roughness [31].
Depending on n value, CPE can represent resistance (n = 0, A = R), capacitance (n = 1, A = C), inductance (n = −1, A = L) or Warburg impedance (n = 0.5, A = W).
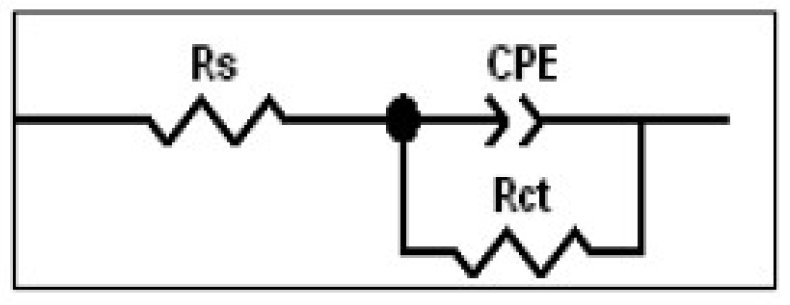
The transfer function is, thus, represented by an equivalent circuit that has been previously used [31, 32] with only one time constant (Fig. 8). Parallel to the double-layer capacitance (simulated by a CPE) is the charge transfer resistance (Rct); and Rs is the electrolyte (in our case, 1.0 M HCl) resistance.
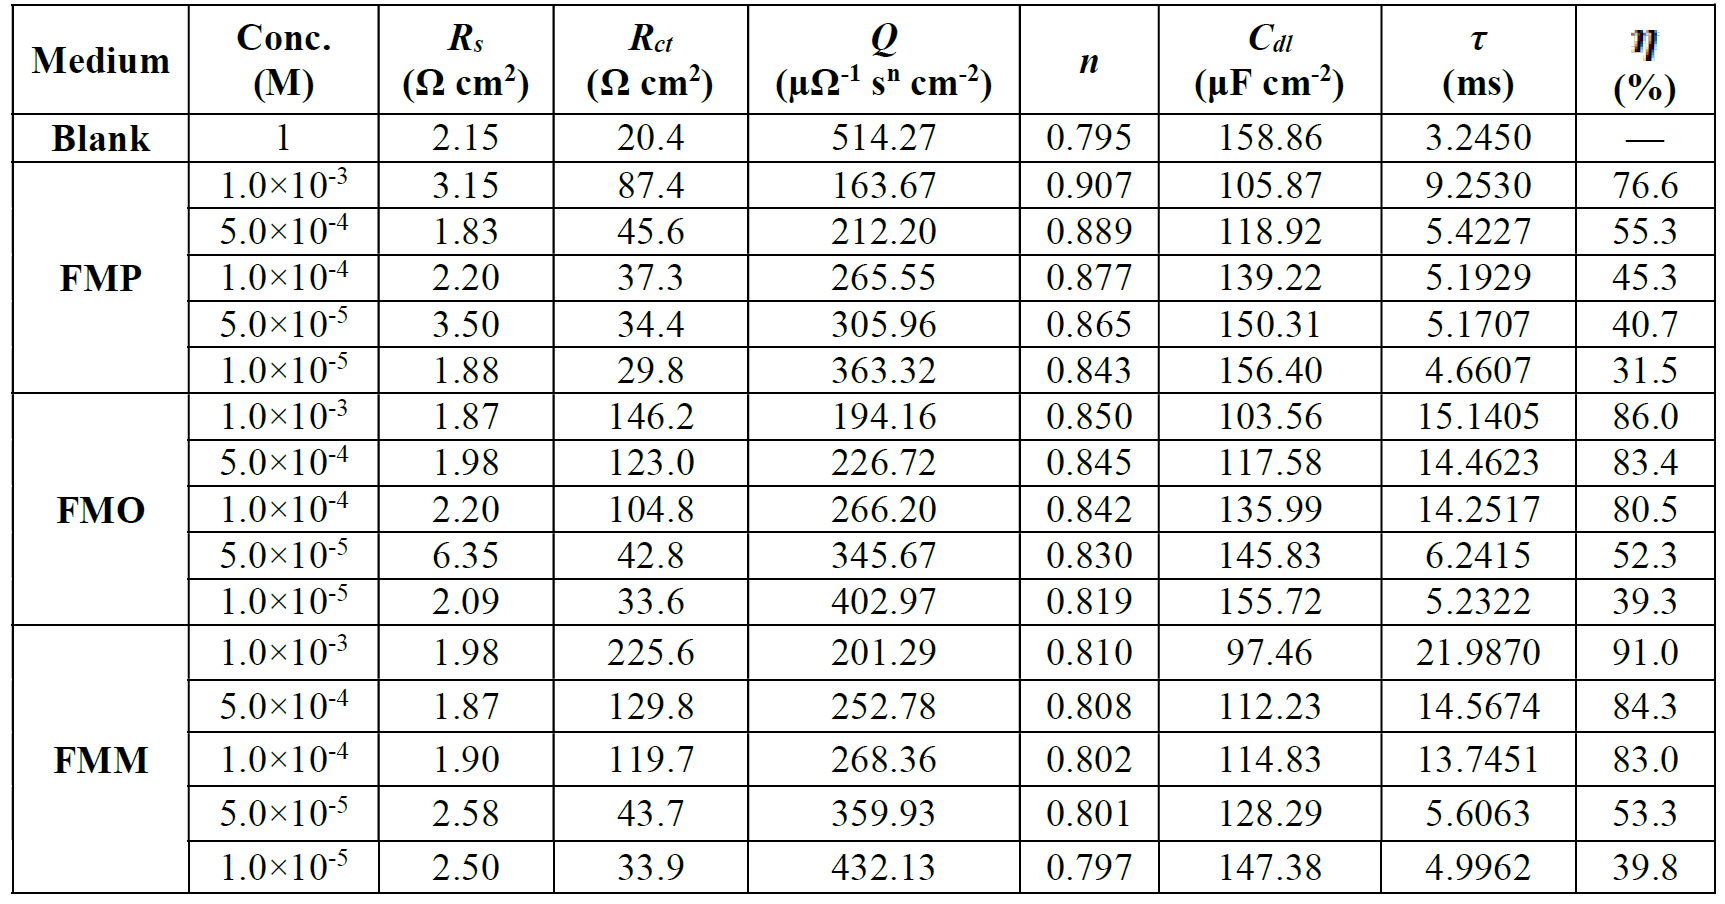
The electrochemical parameters, obtained from fitting the recorded EIS data using the equivalent circuit of Fig. 8, are presented in Table 2. This table shows the calculated “double layer capacitance” values, Cdl, extracted from the CPE parameters, according to [33]:
where Cdl is the double layer capacitance, Q is the CPE constant, Rct is the charge transfer resistance and n is a CPE exponent.
The relaxation time constants were calculated according to the dielectric theory:
where fmax is the frequency at which the maximum in the -φ curve (phase shift) vs. log f appears. The relaxation time (τ) of a surface state is the time required for the return of the charge distribution to equilibrium, after an electrical disturbance; and, in the case, when no distributed element is enclosed to replace the double layer capacitance, it is defined [34] as:
where  is the relaxation time, Cdl is the double layer capacitance and Rct is the charge transfer resistance.
From Table 2, the lower values of the constant phase element (CPE), Q, in FMO, FMM and FMP presence, compared to the blank, indicate that the inhibitor substances are adsorbed onto the mild steel surface, forming a protective layer.
It is apparent that the mild steel charge transfer resistance (Rct) value, in a 1.0 M HCl solution, increases significantly after FMO, FMM and FMP addition. FMO, FMM and FMP addition to the corrosive solution decreases the double layer capacitance. The double layer between the charged metal surface and the solution is considered as an electrical capacitor. The decrease in this capacity could be attributed to FMO, FMM and FMP adsorption, which forms protective adsorption layers onto the metal surface [35]. The time constant (τ) calculated values, obtained in FMO, FMM and FMP presence, were found to be higher than those of the uninhibited solution.
Table 2 Impedance parameters and inhibition efficiency values for mild steel, in 1.0 M HCl, at different concentrations of Schiff base derivatives, at 308 K.
The inhibitory efficiency, η(%), is calculated by Rct , using equation (9):
where η(%) is the inhibition efficiency,  is the charge-transfer resistance value, without and with inhibitor, and
  is the charge-transfer resistance value with inhibitor. It is obvious from the results that the inhibition efficacy, calculated from electrochemical impedance, is in agreement with the effectiveness calculated from polarization measurements.
Weight loss measurements
Effect of inhibitor concentration
The η(%) and the corrosion rate (ν) values, obtained from weight loss method, at various FMP, FMO and FMM concentrations, are summarized in Table 3. It has been found that the FMP, FMO and FMM compounds inhibit mild steel corrosion, at all the studied concentrations. The lone pair of electrons on the nitrogen and oxygen atoms, and also the presence of a higher electron density in the inhibitor molecules, will coordinate with the metal active sites, which causes a stronger interaction with the metal surface. The presence of π electrons on nitrogen and oxygen atoms enhances the inhibitor substances adsorption onto the metal surface, and, hence, inhibits the corrosion process [36].
Table 3 Weight loss data for mild steel, in 1.0 M HCl, without and with different concentrations of Schiff base derivatives, at 308 K.
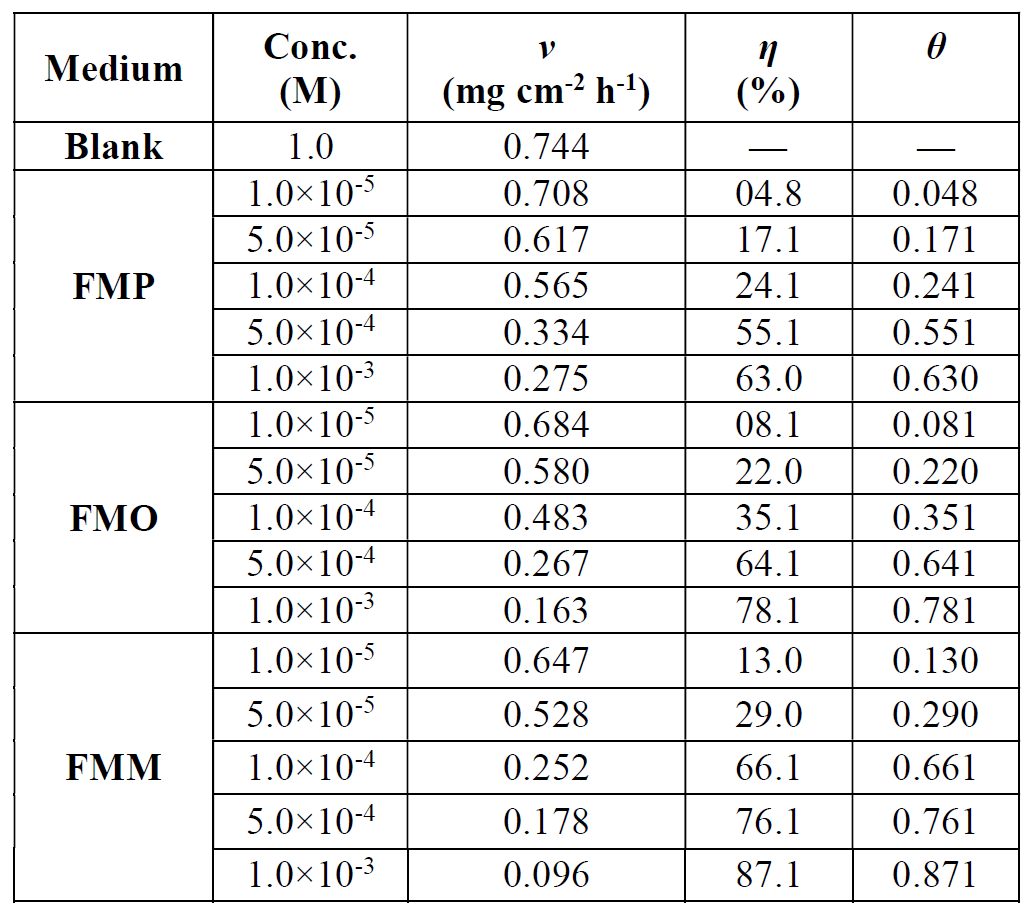
Table 3 shows that the corrosion rates, in FMP, FMO and FMM presence, were 0.275 mg cm-2 h-1, 0.163 mg cm-2 h-1 and 0.096 mg cm-2 h-1, respectively, at the concentration of 1.0x10⁻³ M, and that they decreased significantly, compared to the blank solution (0.744 mg cm-2 h-1). This significant decrease in the corrosion rate suggests that the FMP, FMO and FMM molecules are highly effective corrosion inhibitors, even at higher concentrations of the acidic solution.
Adsorption considerations
A direct relationship between the percentage inhibition, η(%) and the degree of surface coverage (θ) [η(%) = 100 × θ] can be assumed for the different FMP, FMO and FMM concentrations. The degree of surface coverage (θ), for the different FMP, FMO and FMM concentrations, has been evaluated from the weight loss measurements, in 1.0 M HCl, at 308 K. The data were graphically examined by fitting to several adsorption isotherms, including Freundlich, Temkin, Flory-Huggins, Bockris-Swinkles, Langmuir and Frumkin isotherms. The correlation coefficient (R2) was utilized to determine the best fit isotherm which was obtained for Langmuir. According to this isotherm, θ is related to FMP, FMO and FMM concentrations, using the following equation (10) [37]:
where θ is the surface coverage, C is the concentration and Kads is the equilibrium constant of the adsorption process expressed in L mol-1. Kads is associated to the standard Gibbs free energy of adsorption ( ) and is calculated by equation (11) [38]. The data were plotted in Fig. 9. The intercept of the lines in Fig. 9 yielded Kads in L mol-1, and the corresponding standard Gibbs free energy of adsorption, in (kJ mol-1), was calculated using equation (11) [38]:
where Kads is the equilibrium constant of adsorption process, Csolvent is the molar concentration of water ( = 55.5 mol dm-3),
  is Gibbs free energy of adsorption, R is the gas constant and T is the temperature expressed in K.
Using equation 11, the various adsorption parameters were calculated from the studied isotherm, including the standard Gibbs free energy of adsorption of FMP, FMO and FMM on the mild steel surface, at 308 K, and are presented in Table 4.
Fig. 9 shows the plot of C/θ versus C, and linear plots were obtained for FMP, FMO and FMM, indicating that these inhibitors adsorption followed Langmuir isotherm. The various adsorption parameters obtained from this isotherm are listed in Table 4. The correlation coefficients were very good, and Kads values increased with higher inhibitors concentrations, showing that FMP, FMO and FMM molecules were adsorbed onto the mild steel surface.
Although the plots are linear, as depicted by R2 values (0.99), the slopes pervert from the unity value, as expected from the ideal Langmuir adsorption equation. This remoteness may be explained on the basis of the interaction among adsorbed species on the metal surface. It has been posited in the derivation of Langmuir isotherm equation that adsorbed molecules do not interact with each another. However, this is not true in the case of large organic molecules with polar atoms or groups which can be adsorbed on the cathodic and anodic sites of the metal surface. Such adsorbed species interact by mutual repulsion or attraction. It is also possible that the FMP, FMO and FMM are adsorbed on the anodic and cathodic sites, which results in a deviation from the unit gradient. Similar observations have been mentioned in the literature [39, 40].
However, it is observed that the slope (Table 4) has remarkably deviated from the unity required by an ideal Langmuir isotherm model. Langmuir equation has been derived under the assumption that adsorbed species do not interact with each other [41]. This assumption is not true, as authors [42-44] have demonstrated that adsorbed inhibitor species are capable of interacting with each other on the metal surface. For this reason, θ values were fitted into El-Awady [43] kinetic/thermodynamic adsorption model, which is a modification of the Langmuir isotherm, and takes into consideration the omitted interaction parameter by Langmuir isotherm. Equation (12) [45] gives the description of the El-Awady kinetic/thermodynamic adsorption model [43].
where K’ is a constant and y is the number of inhibitor molecules occupying one active site.
A tracing of Ln (θ/1-θ) versus Ln C gives a straight line of slope y and the intercept of Ln K’, as presented in Fig. 10. The equilibrium constant corresponding to the adsorption isotherm is given by Kads = (K’)1/y, when the value of y > 1. This implies the formation of inhibitors multilayers onto the metal surface; and when the value of y < 1, this means that the inhibitor molecules will occupy more than one active site.
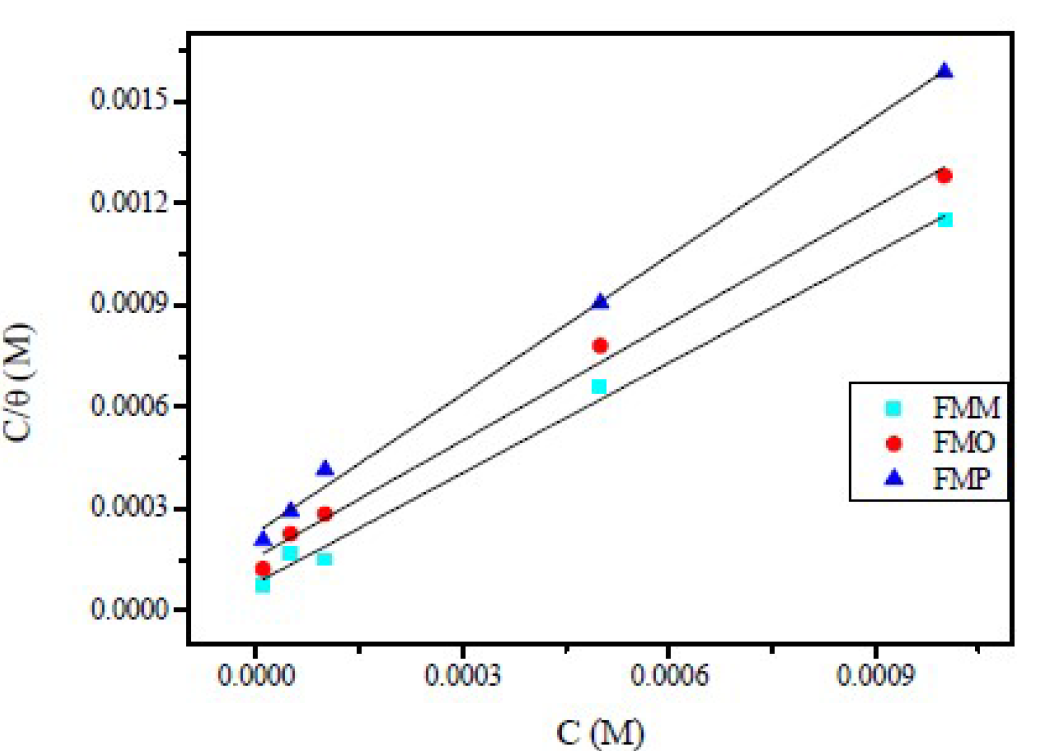
Figure 9 Langmuir adsorption isotherm model for mild steel, in 1.0 M HCl, with Schiff base derivatives, at 308 K.
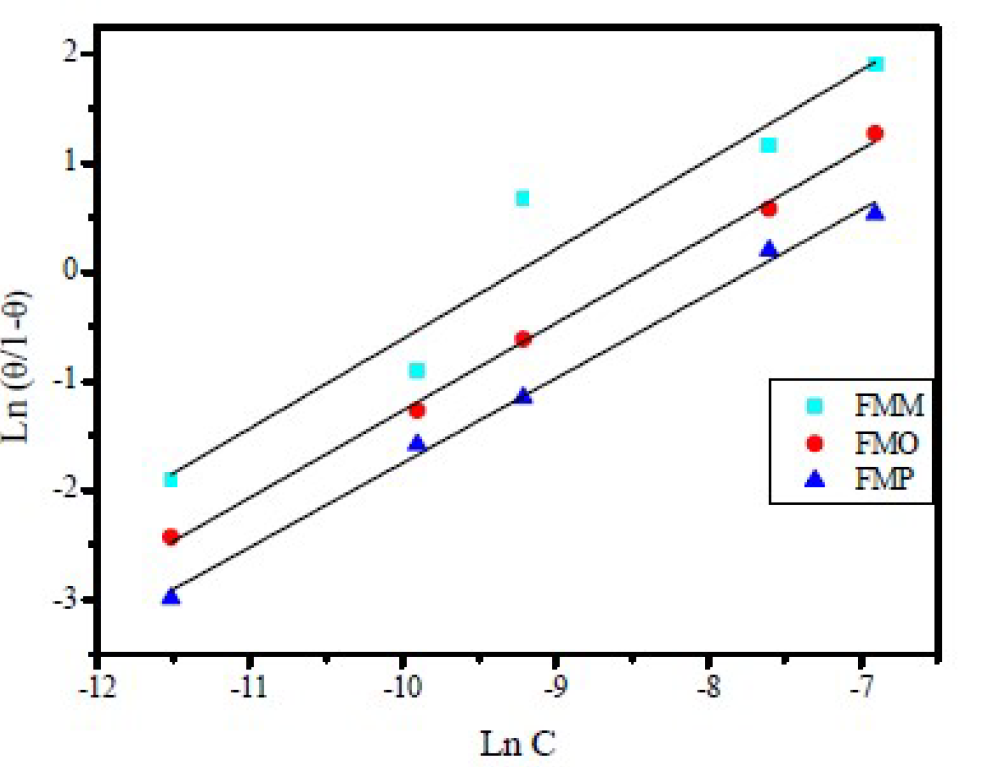
Figure 10 El-Awady et al. [43] Kinetic/thermodynamic isotherm for Schiff base derivatives in 1.0 M HCl, at 308 K.
All the adsorption parameters derived from Figs. 9 and 10 are listed in Table 4 The behavior of equilibrium constants harvested from Langmuir model was similar to the values which were collected by El-Awady kinetic-thermodynamic model. The free energy of adsorption,  , can also be calculated using the equation (11).
Table 4 Adsorption parameters from Langmuir and El-Awady et al. [43]. Kinetic/thermodynamic isotherms for mild steel, in 1.0 M HCl, in the absence and presence of different concentrations of Schiff base derivatives, at 308 K.

As shown in Table 4, 1/y values are higher than the unity, implying that FMM, FMO and FMP inhibitor species occupied more than one active site on the mild steel surface. In addition, Kads follows the order: FMM > FMO > FMP. Generally, Kads high values mean that the inhibitor is easily and strongly adsorbed onto the metal surface, which then results in a better inhibition. This is consistent with η values shown in Table 3.
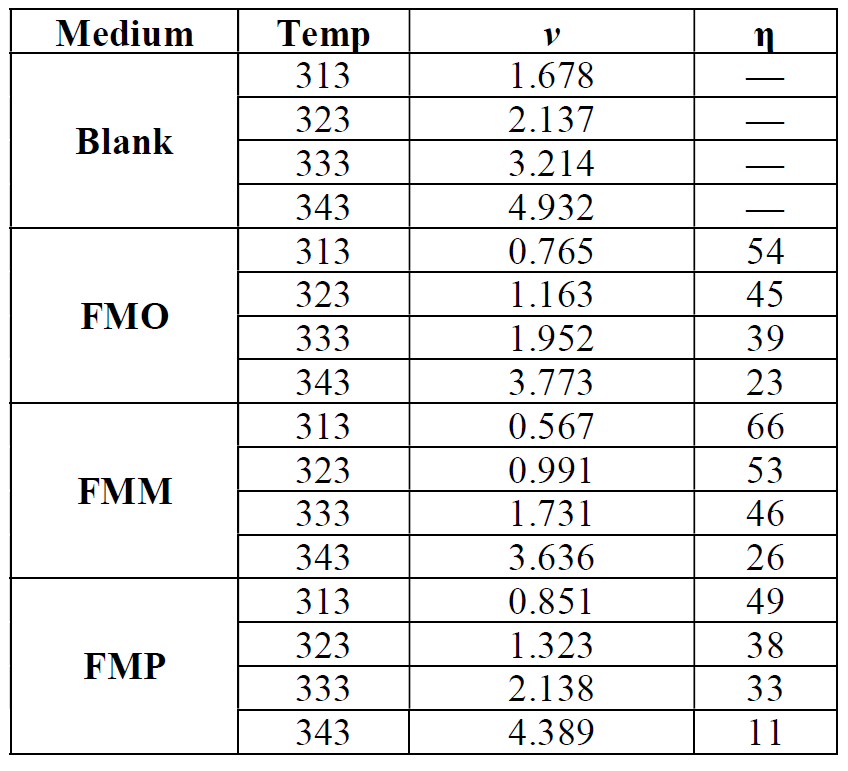
Table 5 Effect of temperature on mild steel corrosion rate (ν) and percentage inhibition (η%), in a 1.0 M HCl solution, without and with optimum concentration (1.0x10⁻³ M) of Schiff base derivatives.
The results presented in Table 4 indicate that the free energies values are negative. The negative values signify that FMP, FMO and FMM molecules adsorption is carried out via a mixed adsorption mechanism. The literature demonstrates that the standard Gibbs free energy of adsorption values, in an aqueous solution around -20 kJ mol-1 or lower (more positive), indicate an adsorption with electrostatic interaction between the adsorbent and the adsorbate (physisorption), while those around or higher (more negative) than -40 kJ mol-1 involve charge sharing between the molecules and the metal (chemisorption) [46]. Physisorption is consistent with electrostatic interaction between the charged molecules and a charged mild steel surface, while chemisorption is consistent with charge sharing or charge transfer from the inhibitor constituents to the metal surface, to form a coordinate type of bond. The observed range of free energies in the present study suggests that FMP, FMO and FMM adsorption onto the mild steel surface is of “mixed mode”. This implies that FMP, FMO and FMM adsorption onto mild steel, in a 1.0 M HCl solution, involves both physisorption and chemisorption processes [47, 48].
Effect of temperature
Table 5 shows the effect of temperature on mild steel percentage inhibition (η%) and corrosion rate (ν), in a 1.0 M HCl solution, without and with optimum concentration (1.0x10⁻³ M) of Schiff base derivatives.
The results depicted in Table 5 show that higher temperatures lead to an increase in the mild steel dissolution and corrosion rate, for inhibited and blank solutions. The effect of temperature on metallic dissolution in an inhibited solution is highly complex, because, at elevated temperatures, several changes, such as rapid etching, desorption and decomposition and/or rearrangement of the inhibitor substance, take place. Arrhenius equation (13) and transition state equation (14) were used [49] to calculate the activation thermodynamic parameters of the corrosion process, such as the apparent activation corrosion energy, (Ea), the entropy of activation (∆Sa) and the enthalpy of activation (∆Ha):
where Ea is the apparent activation corrosion energy expressed in KJ mol-1, R is the universal gas constant expressed in J mol-1 L-1, k is the Arrhenius pre-exponential factor, h is Plank's constant, N is Avogrado's number, ∆Sa is the entropy of activation and ∆Ha is the enthalpy of activation.
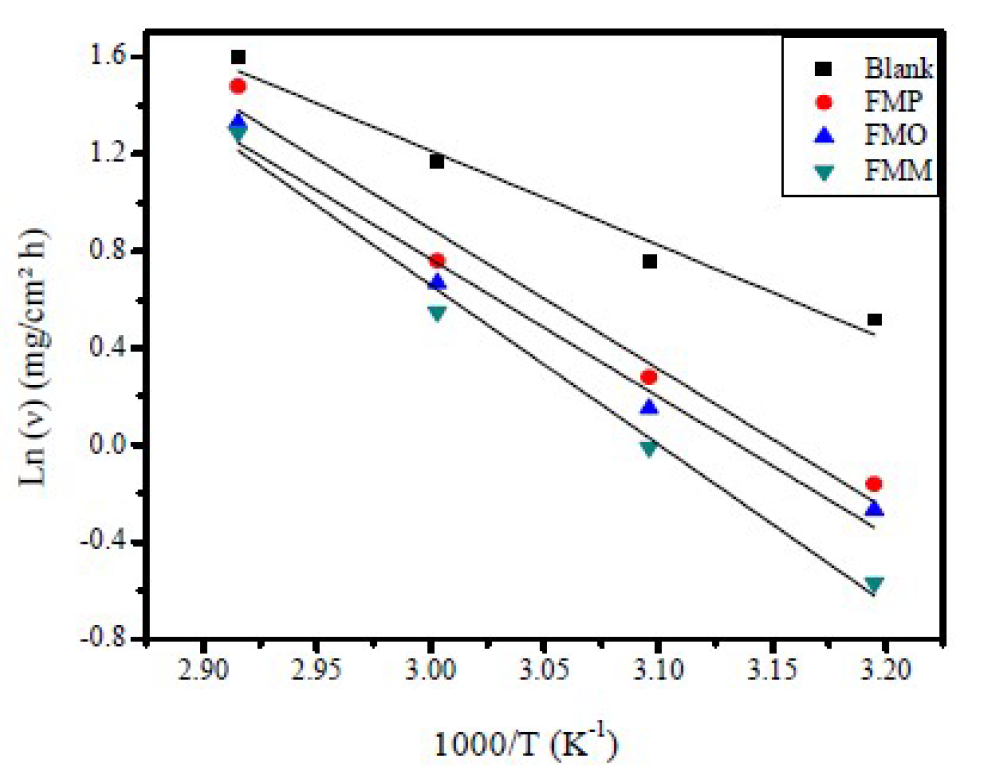
Figure 11 Arrhenius plots, in the absence and presence of optimum concentration (1.0x10⁻³ M) of FMO, FMM and FMP, for mild steel in a 1.0 M HCl solution.
Arrhenius plots for mild steel corrosion rate (ν) are presented in Fig. 11. The values of apparent activation energy of corrosion (Ea) for mild steel in 1.0 M HCl, with FMP, FMO and FMM absence and presence, at optimum concentration (1.0x10⁻³ M), were determined from the slope of Ln (ν) versus 1/T plots, being shown in Table 6.
Table 6 Activation parameters for mild steel dissolution in 1.0 M HCl, in the absence and presence of FMO, FMM and FMP at optimum concentration (1.0x10⁻³ M).
Table 6 shows that Ea values, in FMO, FMM and FMP presence, are higher than those of the uninhibited acid solution (32.38 KJ mol-1). The fact that the activation energy, in the inhibitor presence, is higher was explained in different ways in the literature. According to Riggs and Hurd [50], the decrease in apparent activation energy (Ea), at higher inhibition levels, arises from a shift in the net corrosion reaction, from one on the uncovered surface to one directly involving the adsorbed sites. This also reveals that the entire process is surface-reaction controlled, since the corrosion process energy of activation (Ea), both in the inhibitor molecule absence and presence, was higher than 20 kJ mol-1 [51]. Szauer and Brand [51] explained that the increase in the activation energy could be due to an appreciable decrease in the inhibitor molecule adsorption onto the mild steel surface, at higher temperatures [52]. The increase in activation energy, after FMP, FMO and FMM addition to the 1.0 M HCl solution, can indicate that physical (electrostatic) adsorption occurs in the first stage [53].
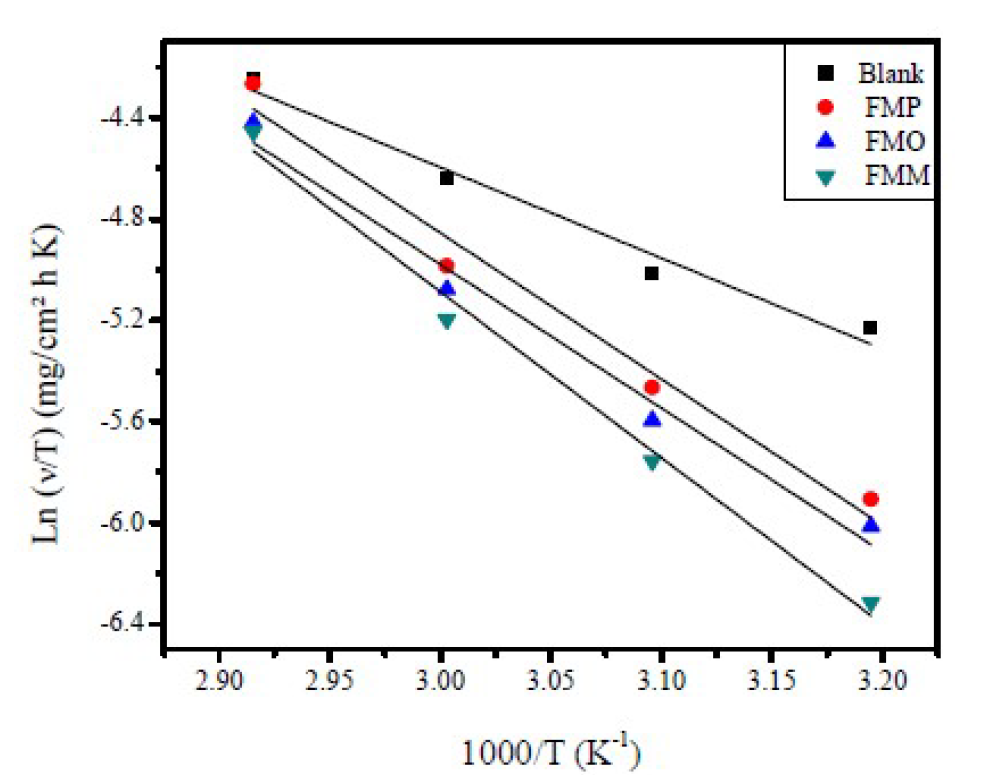
Figure 12 Transition Arrhenius plots, in FMO, FMM and FMP absence and presence, for mild steel in a 1.0 M HCl solution.
Fig. 12 shows a plot of Ln (ν/T) versus 1/T. The straight lines are obtained with a slope (ΔHa/R) and an intercept of (Ln R/Nh + (ΔSHa/R), from which ΔH and ΔS values are calculated and shown in Table 6.
Inspection of these data revealed that the entropy of activation, ΔSa, in FMP, FMO and FMM absence and presence, is high and negative. This suggests that the activated complex, in the rate-determining step, represents an association, rather than a dissociation step, meaning that a decrease in disordering takes place on going from reactants to the activated complex [54]. ΔHa positive sign reflects the endothermic nature of the steel dissolution process, suggesting that steel dissolution is slow [55], in FMP, FMO and FMM presence.
Theoretical calculations of molecular reactivity
Quantum chemical indices
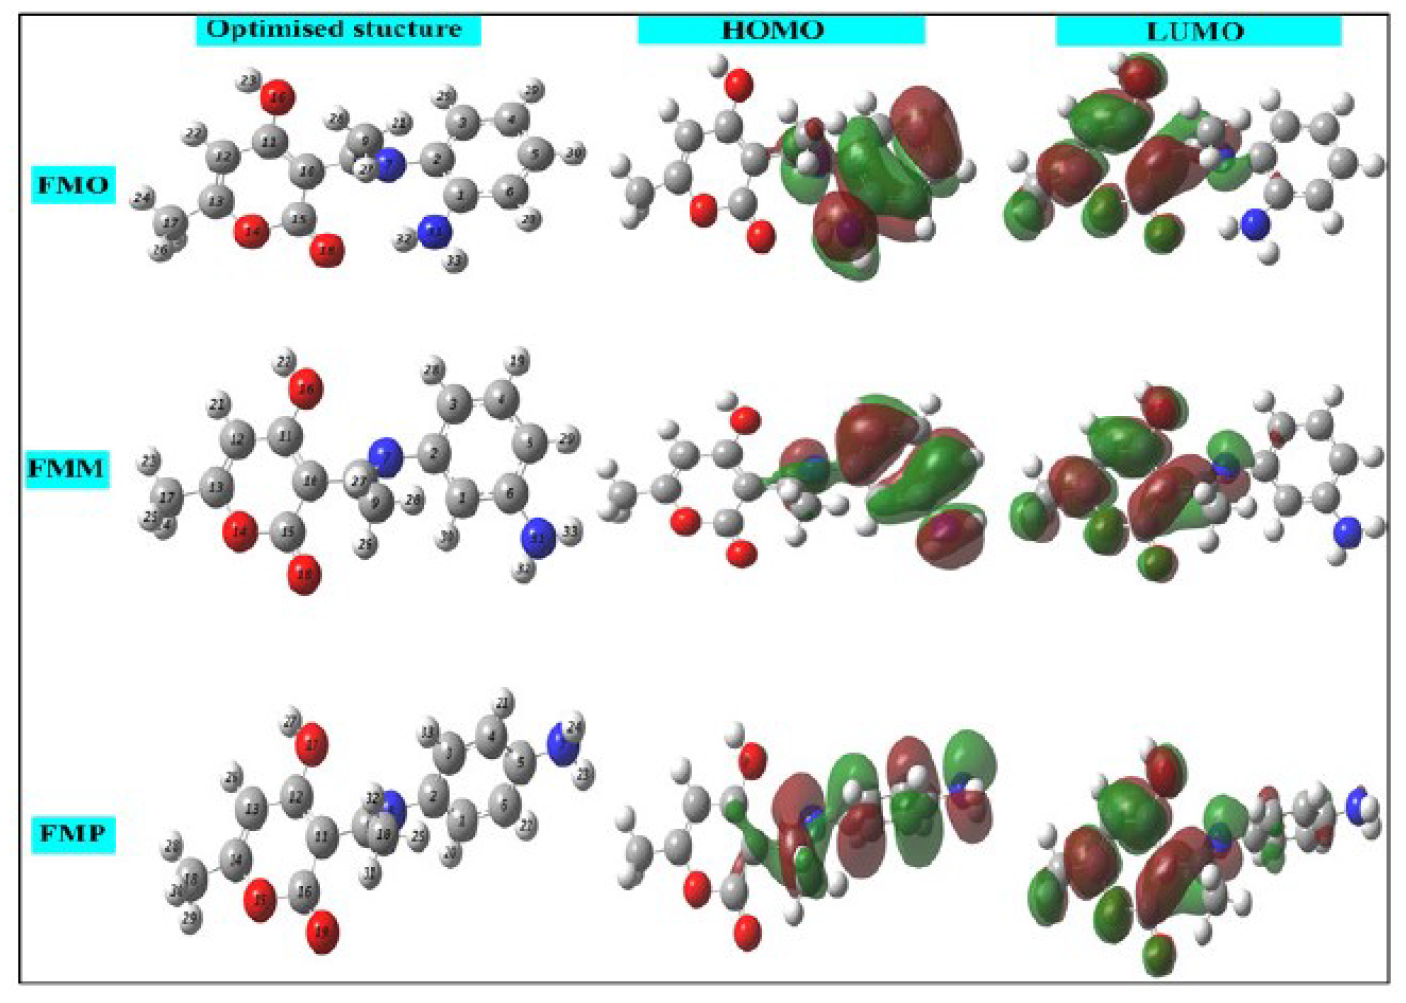
The use of theoretical study by the Density Functional Theory (DFT) method is a very important tool for several theorists to study the inhibitor molecules reactivity [56]. This property was determined by the use of very specific descriptors in this study. The first factor is HOMO and LUMO densities. These are shown in Fig. 13, with FMO, FMM and FMP optimized molecules. From this figure, it is clear that the HOMO electronic density is located on the whole molecular surface of aminophenylimino-ethyl, while LUMO density is distributed around the 4-hydroxy-6-methyl-2H-pyran-2-one ring, for the three studied molecules.
EHOMO and ELUMO energies values are calculated at the level of the B3LYP/6 -31G (d, p) method, with the help of Gaussian 09 software [57, 58]. From these values, it is possible to extract different structural quantum parameters of the FMO, FMM and FMP compounds: gap energy (ΔEgap), dipole moment (μ), electronegativity ((), hardness (η), number of electrons transferred from the inhibitor to the metal surface, or electron transfer fraction (ΔN110) and the total energy (ET). These parameters are shown in Table 7.
The ionization potential (IP), the electron affinity (EA) and gap energy (ΔEgap) are found from EHOMO and ELUMO, using equations (15), (16) and (17):
The hardness (η) and the electronegativity (() are given by the following relations [59, 60]:
The fraction of transferred electrons (ΔN110) is calculated using equation (20) [61]:
where φ and χinh denote the inhibitor molecule work function and electronegativity, respectively; and (Fe and (inh represent Fe absolute hardness and the inhibitor molecule, respectively. The ΔN value calculation is more appropriate by the use of the (φ) work function. Theoretically, the values obtained for the φ function are 3.91 eV, 4.82 eV and 3.88 Ev, for the Fe (100), (110), and (111) surfaces, respectively [62, 63]. The hardness of Fe = 0, assuming that, for a metal, IP mass = EA, because these surfaces are softer than the neutral metal atoms [64]. The main quantum parameters are shown in Table 7. In line with Frontier Molecular Orbital (FMO) theory, an inhibitor with high EHOMO energy value is associated with a strong electron donating ability and, thus, with better inhibition efficiency [65, 66]. In contrast, low ELUMO energy of a compound reflects its ability to accept electrons from the metallic surface and, therefore, higher inhibition efficiency. The gap energy (ΔEgap) is a very important parameter to value the degree of interactions between an inhibitor and the metal surface. That is, the low ΔEgap value shows that this inhibitor adsorption onto the metal surface is high [67]. Examination of the results in Table 7 shows that the FMO compound has a higher EHOMO value (-4.722 eV) and a lower ELUMO value (-1.498 eV) than those obtained for FMP and FMM compounds, respectively. This reflects that FMO molecule ability to give and accept electrons is very significant. In addition, ΔEgap value is low for the FMO compound; this indicates that the adsorption capacity of this inhibitor increases onto the metal surface. The dipole moment (µ) is considered as a quantity reflecting the polarity of a molecule. In the literature, some authors claimed that increasing the dipole moment of a molecule can lead to an increase in the adsorption performance [68]. The data in Table 7 show that FMO, FMM and FMP inhibitors dipole moment values are 7.335 D, 4.899 D, and 4.232 D, respectively; and that the evolution of the inhibitory efficiency is in the following order: FMO > FMM > FMP. Concerning the electron transfer fraction (ΔN110), if ΔN110 < 3.6, the inhibitor performance is good and increases with the higher electron donating capacity of this molecule to the metal surface [69, 70]. In this sense, ΔN110 value is also recorded in Table 7, and shows that the inhibition power resulting from electron donation is in very good agreement with Lukovits’ study [71]. FMO compound has a higher value of transferred electrons, compared to those obtained for FMP and FMM, which facilitates its adsorption onto the metal surface. Finally, the minimum value of FMO total energy (ET) indicates that this compound is well adsorbed onto the studied mild steel surface. This result is overlapping with the following order of inhibition efficiency: FMO > FMM > FMP. This order of inhibition efficiency did not match with those obtained using electrochemical techniques, weight loss, and Monte Carlo simulation, because it resulted from the very close values of the compounds total energy (ET), which were -877.106, -877.104, and -877.102 for FMO, FMM and FMP, respectively, and this difference was 0.002 between one compound and the others.
Active sites of the inhibitor molecules
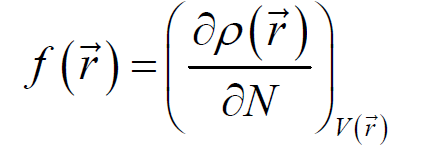
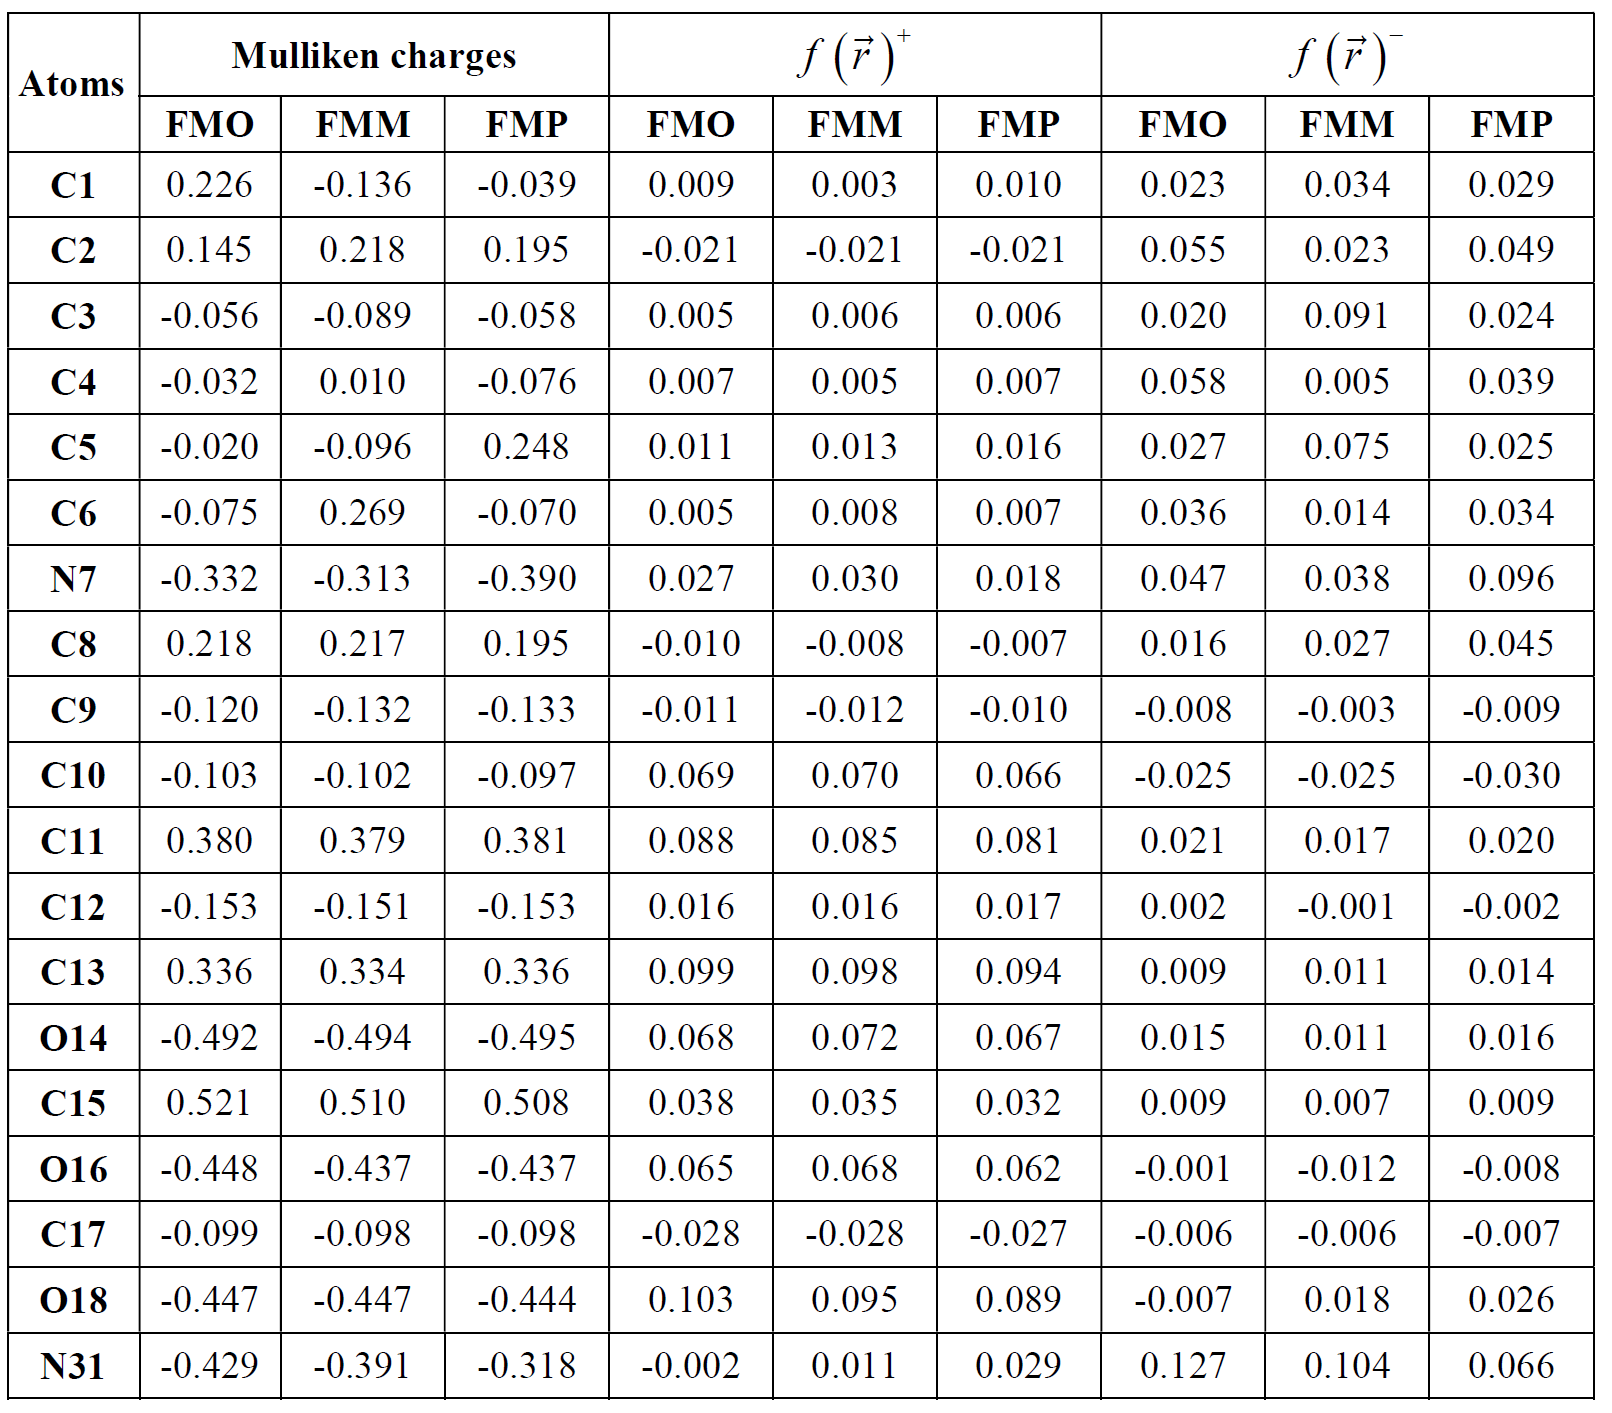
An organic molecule is considered a good metal corrosion inhibitor, if it carries atoms and heteroatoms responsible for nucleophilic and/or electrophilic attack [72]. For this reason, we have used very popular methods, such as Mulliken's atomic charges and Fukui's indices (listed in Table 8). Atoms bearing negative Mulliken charges are considered as electron donor sites (Nucleophiles), when interacting with the iron surface, to form coordination bonds. Therefore, Table 8 shows that the oxygen and nitrogen atoms are carrying more negative atomic charges for the three FMO, FMM and FMP compounds, at the same time, according to the following sequence: N7, O14, O16, O18, and N31; whereas the C11, C13, and C15 carbon atoms carry high density of positive charges. This indicates that these atoms are considered electron acceptor active sites from iron d orbital, forming retro-donation bonds. The Fukui function ( ) is calculated according to equation (21) [73]:
The nucleophilic and electrophilic attack Fukui functions,  and
and , respectively, can be calculated as follows [19]:
where qi (N+1), qi (N) and qi (N-1) are the charge values of i atom, forh cation, neutral and anion, respectively.
The studied Fukui functions values are calculated by the Materials Studio 8 software, from Biovia-Accelrys Inc., using the Dmol3 module. The calculations were performed using the correlation BOP function and the digital double polarization (DNP).
Table 8 Mulliken atomic charge distribution and Fukui functions for the FMO, FMM and FMP compounds.
Generally,  and
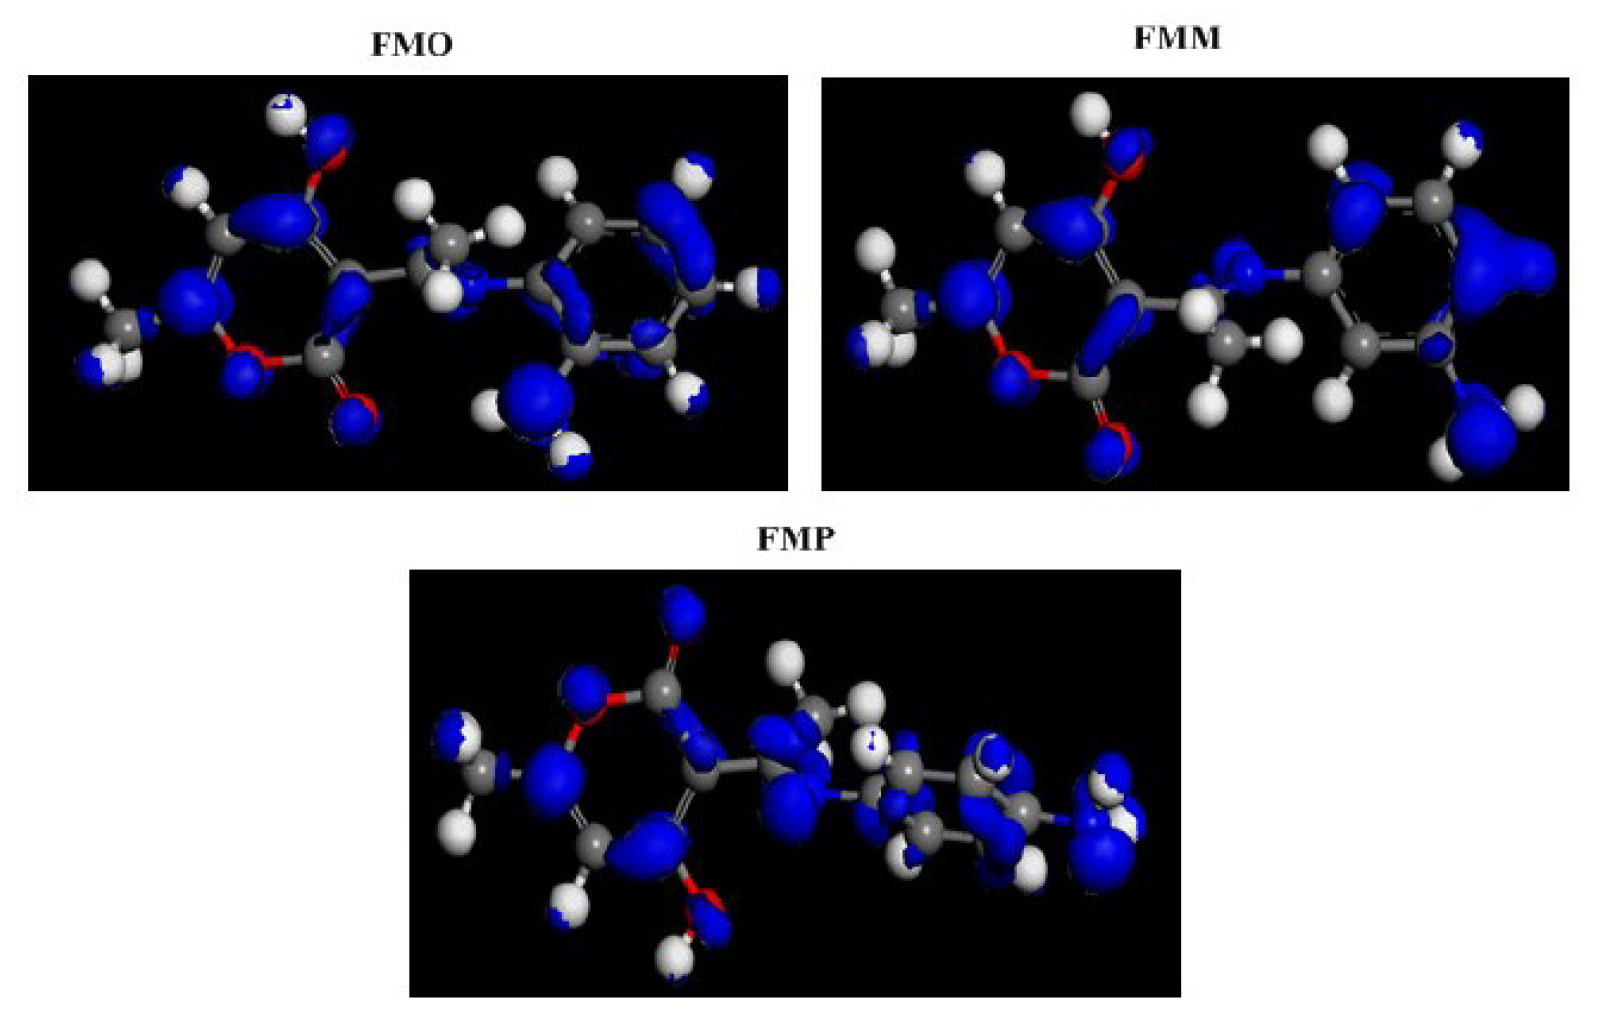
and  high values indicate the high capacity of the atom to gain and lose electrons, respectively. From Table 8, on the nucleophilic attack, the most reactive sites are C2, C3, C4, C6, N7 and N31, for the three studied compounds. On the other hand, the C10, C11, C13, O14 and O18 atoms can accept electrons from the metal surface. The sites responsible for both attacks are shown in Fig. 14.
Effect of protonation on quantum parameters
The studied compounds have several active sites available for protonation, but, in this work, we chose the nitrogen atom (N31) of the aminophenyl group, as a more favorable site for protonation. Our choice is based on considerations such as the theoretical calculation of pH, pKa and proton affinity (PA). PA is calculated from the studied compounds total energies, according to the following equation:
PA is a very important descriptor for determining the chemical reactivity of a molecule. Indeed, this molecule reactivity increases when the PA value is high. Table 9 summarizes the different chemical quantum parameters values of protonated and unprotonated FMO, FMM and FMP molecules.
Table 9 shows that after FMO, FMM and FMP compounds protonation, their EHOMO values are shifted to more negative values than those of the neutral FMO, FMM and FMP molecules. This indicates that the protonated forms of the test compounds have an ability to accept electrons [74]. We have also noted, from Table 9, that the electron donor capacity (ΔN110) of the studied protonated molecules was decreased and negative, compared to the non-protonated forms. This means that donating electrons from the inhibitory molecules to the metal surface is no longer possible [74]. These results are probably due to the electrostatic effect between the positively charged molecules and the chlorine ions adsorbed onto the iron surface.
As shown in Table 9, the proton affinity values are more negative for the FMO protonated compound. This indicates that this compound is more reactive than FMM and FMP compounds.
The molecular reactivity of the tested products is in the following order: RM(FMO) > RM(FMM) > RM(FMP). The polarity of the studied molecules is totally changed after the protonation, and is done in the following order: μ(FMO) > μ(FMM) > μ(FMP). This result does not agree with the inhibition efficiency.
Table 9 Different values of the quantum parameters of protonated and unprotonated molecules (FMO, FMM and FMP).
| Inhibitors | PA (Kcal mol-1) | E LUMO (eV) | E HOMO (eV) | ΔEgap (eV) | μ (D) | ΔN110 (eV) | E T (u.a) |
| FMO | - | - 1.498 | -4.722 | 3.224 | 7.335 | 0.530 | -877.106 |
| FMO(N31) H+ | -426.706 | -4.973 | -9.243 | 4.270 | 1.025 | -0.5358 | -877.510 |
| FMM | - | -1.353 | -5.085 | 3.732 | 4.899 | 0.429 | -877.104 |
| FMM(N31) H+ | -405.371 | -4.169 | -8.523 | 4.354 | 15.393 | 0.350 | -877.474 |
| FMP | - | -1.308 | -4.844 | 3.536 | 4.232 | 0.493 | -877.102 |
| FMP(N31) H+ | -405.370 | -3.989 | -8.463 | 4.474 | 18.915 | -0.314 | -877.472 |
Monte Carlo simulations
The interaction between the investigated inhibitors (FMO, FMM and FMP) and Fe(110) plane surface was carried out using Monte Carlo simulations. The adsorption locator code implemented in the Material Studio 8.0 software, from Biovia-Accelrys Inc. USA, was adopted in this simulation. The COMPASS (condensed phase optimized molecular potentials for atomistic simulation studies) force field was used for the simulation of all molecules and systems.
The simulation of the corrosion inhibitor molecules designated as FMM, FMO and FMP, on the Fe(110) surface, was carried out in order to locate the low energy adsorption sites of the potential corrosion inhibitors on the Fe surface. MD simulations were performed in a NVT canonical ensemble, at 308 K, with a time step of 1.0 fs and a total simulation time of 1000 ps, using an Anderson thermostat. Interaction energies (adsorption energy) (Eint) between the inhibitor molecules and the Fe(110) surface were calculated using the following equation [75-80]:
Where Etotal is the total energy of an inhibitor molecule and of the metal surface system, EFe-surface is the energy of the Fe surface, without the adsorption of any inhibitor molecule, and Einh represents the energy of isolated inhibitor molecules (FMO, FMM and FMP). It is important to note that the binding energy (Ebinding) is the negative value of the interaction energy, being calculated according to the following equation:
Nowadays, Molecular Dynamics Simulation (MDS) approach is known as one of the useful tools which are considered to investigate the adsorption behaviors of inhibitor molecules onto metal surfaces. In order to determine the more suitable adsorption configuration of FMM, FMO and FMP molecules, we have considered the above mentioned approach. Calculated total energy, adsorption energy, rigid adsorption energy, and deformation energy values are shown in Table 10.
The most stable adsorption configurations of FMM, FMO and FMP molecules on the Fe(110) surface are depicted in Fig. 15.
Table 10 Outputs and descriptors calculated by Monte Carlo simulation, for FMM, FMO and FMP adsorption onto the Fe(110) surface, in gas phase (in kcal mol-1).
| Systems | Total energy | Adsorption energy | Rigid adsorption energy | Deformation energy | dEad/dNi inhibitor |
| Fe(110) + FMM | -256.293 | -148.823 | -152.146 | 3.322 | -148.823 |
| Fe(110) + FMO | -262.502 | -148.773 | -152.048 | 3.275 | -148.773 |
| Fe(110) + FMP | -219.669 | -144.431 | -151.037 | 6.605 | -144.431 |

Figure 15. Side views of the most stable configurations, for the adsorption of (a) FMM, (b) FMO and (c) FMP, on the Fe(110) surface, calculated using Monte Carlo simulations.
Higher negative adsorption energy values indicate a more stabilized and stronger interaction between a metal and an inhibitor molecule. In other words, it can be said that a larger Ebinding value implies that the corrosion inhibitor combines more easily and tightly with the iron surface, and that the inhibitive performance is higher and spontaneous [81]. The calculated interaction energy values for FMM, FMO and FMP inhibitors were -148.823, -148.773 and -144.431 kcal mol-1, respectively. It is apparent, from these values and information given above, that FMM has the highest interaction energy value and corrosion protection capability among the studied inhibitor molecules (FMO, FMM and FMP). According to the calculated interaction and binding energy values, the corrosion inhibition efficiency ranking of the studied molecules can be given as follows: FMM > FMO > FMP; and this ranking is in good agreement with the experimental inhibition efficiency values.
Conclusions
The inhibition efficiency increased with higher concentrations, but decreased with the increase in temperature, and the order of inhibition efficiency decreased as follows: FMM > FMO > FMP. Tafel polarization curves indicated that the corrosion current density decreased with the inhibitor molecules addition, while the corrosion potential has slightly changed. Therefore, the Schiff base derivatives can be described as mixed type inhibitors, for mild steel, in a 1.0 M HCl solution. EIS results show that Cdl values tend to decrease, and that both Rct and η% tend to increase, with higher inhibitors concentrations. These results can be attributed to an increase in the thickness of the protective film formed on the mild steel surface. FMM, FMO and FMP were found to obey Langmuir adsorption isotherm and thermodynamic- kinetic model of El-Awady, from the fit of experimental data. The adsorption equilibrium constants values suggest that these inhibitors are strongly adsorbed onto the mild steel surface. The free energy of adsorption values indicate that it is a mixed physical and chemical adsorption. The results obtained from the theoretical studies provided good corroborative explanations of the experimental results.


