Introduction
Corrosion is a thermodynamic inevitable process that can be controlled. The injection of chemical inhibitors is a veritable method of internal corrosion control for pipeline steel, due to its flow regime. Most of the chemical inhibitors in use in the industries are toxic. These substances manifest their toxicity either during synthesis and handling, or after application. These inhibitors affect humans and cause an imbalance in the eco-system. Researchers are shifting attention to plant extracts as a possible replacement for those toxic corrosion inhibitors [1-5].
Phyto-chemical constituents have a similar chemistry to corrosion inhibitors, because they possess similar functional groups and adsorption sites [3, 6-9]. However, there is skepticism about the interaction of crude plants extracts with industrial processes and products, because of the un-established chemistry between them. The application of chemical substances, as corrosion inhibitors, derivable from plant extracts, will stop this skepticism.
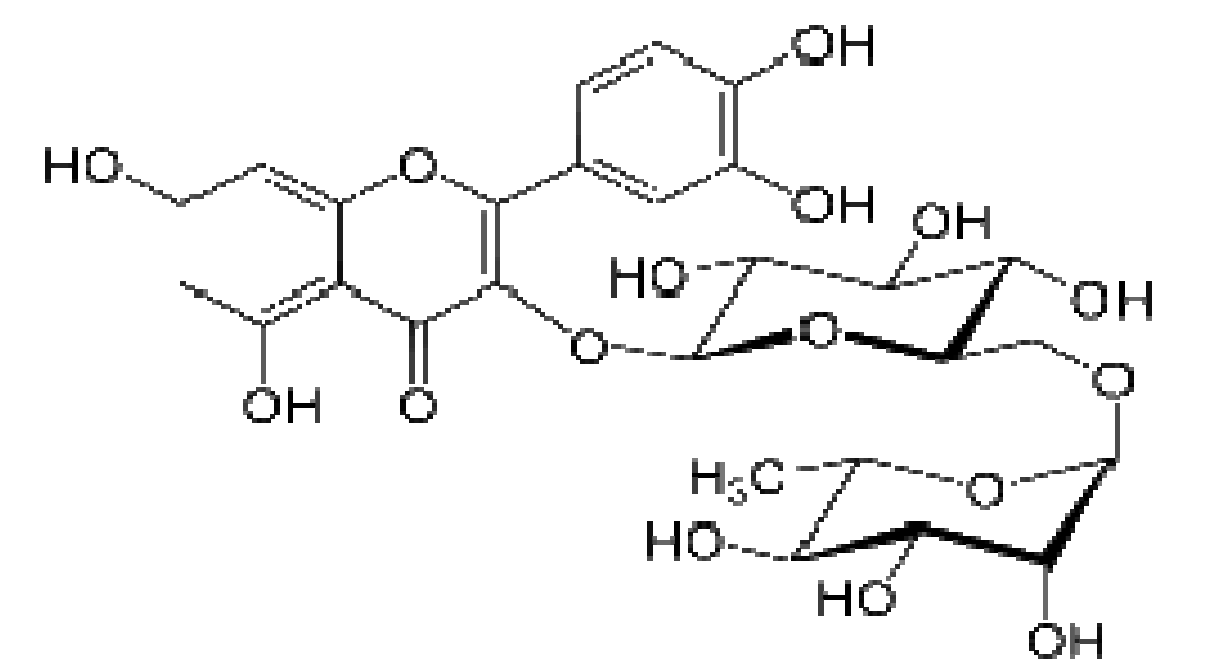
Therefore, Rutin, a biomass molecule derivable from the fruit of the citrus specie, buckwheat, apple peel and black tea, was tested for its corrosion inhibition potential, in an acidic environment. Rutin is one of the poly-hydroxyl phenols in citrus mesocarp. It is a flavenol glycoside made up of flavenol quercetin and disaccharide rutinose. It is a solid substance, pale yellow in appearance and slightly soluble in water. It is also called quercein-3-rutinoside and sorphorin. The molecular formula is C27H30O16, while the molecular mass is 610.517 g/mol. Rutin antioxidant properties have been reported in literature [10-11]. The commercial rutin compound used for these work was procured from Tianjin mark biotechnology co., Ltd, China, with 97 % purity. Rutin structure is shown in Fig. 1.
Experimental
Electrochemical measurements
The electrochemical determinations were carried out in a conventional three electrode aerated cell, using a Perstat 2273 advanced electrochemical system. The pipeline steel was used as working electrode (WE). The WE was prepared as previously reported, as well the chemical composition [12]. The WE was faced to a platinum counter electrode, whereas a saturated calomel electrode (SCE) coupled to a fine Luggin capillary was used as reference electrode. The following experimental setting was followed. The potentiodynamic polarization curve started from cathodic potential of -250 mV to anodic potential of +250 mV vs. OCP, at a scan rate of 1 mV s-1. Power suit software was used to extrapolate the corrosion current density (Icorr), equilibrium corrosion potential (Ecorr) and other tafel parameters. Inhibition efficiency was determined using Icorr values by applying the following equation:
where  and
and  are corrosion current densities in the uninhibited and inhibited systems, respectively.
Electrochemical impedance spectroscopy (EIS) experiments were carried out at open circuit potential, from frequencies of 100 kHz to 10 mHz, using a signal of 10 mV amplitude. The cell was allowed to achieve a stable open circuit potential before the EIS test. The electrochemical data were analysed using Zsimpwin software. The corrosion inhibition efficiency was determined using the charge transfer resistance with the following equation:
where Rcti and Rct are the charge transfer resistance, in CR absence and presence, respectively.
Corrosion surface morphology
Corrosion surface morphology determination was carried out with an Oxford x-Max Scanning Electron Microscope (SEM). The test specimens were grinded with a 200 to 2000 grit Silicon Carbide paper, using a metallographic grinder, rinsed with distilled water and cleansed in absolute ethanol. The cleaning procedure was performed as quickly as possible, to avoid premature corrosion. Thereafter, the first specimen was immersed in 0.5 M H2SO4, while the second specimen was immersed in 0.5 M H2SO4 with 0.01 M CR, for 8 hours. The coupons were retrieved, rinsed and dried, and the corrosion surfaces were subjected to SEM examination.
Fourier transform infrared spectroscopy
The pipeline steel specimens were immersed in a 0.5 M H2SO4 solution with 0.01 M CR, for 24 hours. The pipeline steel samples were retrieved, rinsed with distilled water and dried. The nature of the film, formed by the presence of CR functional groups in the corrosion product, was tested by a Magna-IR 560 Spectrometer ESP Nicolet. This was compared with the CR FT-IR.
Results and discussion
Potentiodynamic polarization
The characteristics of current-potential curves resulting from pipeline steel electrochemical polarization, in 0.5 M H2SO4, in the absence and presence of different concentrations of commercial Rutin (CR), at 303 K, were investigated and are shown in Fig. 2.
The corrosion tafel parameters derived from Fig. 2 include corrosion current density (Icorr), corrosion potential (Ecorr), cathodic Tafel slope (βc), anodic Tafel slope (βa) and corrosion inhibition efficiency (η%), which are shown in Table 1.
From Table 1, the cathodic and anodic current densities, as well as the corrosion current density, decreased in CR presence. This implies that CR presence retards the pipeline steel corrosion reaction in sulphuric acid [13-14]. Consequently, CR can be termed as a mixed type inhibitor, because it decreased both the cathodic and anodic current, and the change in the equilibrium corrosion potential, due to CR presence, was lower than 85 mV [15].

Figure 2 Potentiodynamic polarization curves for pipeline steel, in 0.5 M sulfuric acid, in the absence and presence of different concentrations of commercial Rutin, at 303 K.
Table 1 Potentiodynamic polarization kinetic parameters for pipeline steel, in 0.5 M H2SO4, in the presence and absence of different concentrations of commercial Rutin, at 303 K.
| Inhib conc (M) | Blank | 0.00001 | 0.0001 | 0.001 | 0.01 |
|---|---|---|---|---|---|
| Inhib. Eff. (%) | - | 82.28 | 90.00 | 91.71 | 97.45 |
| icorr (A/cm2) | 1.47 e+4 | 2.61e+3 | 1.474 e+3 | 1.22e+3 | 3.75 e+2 |
| βca (mV dec-1) | 324.72 | 247.38 | 208.99 | 137.75 | 163.08 |
| βan (mV dec-1) | 343.22 | 210.75 | 135.12 | 106.02 | 68.99 |
| Ecorr (mV vs SCE) | -442.69 | -523.39 | -514.01 | -510.01 | -486.09 |
Fig. 1 shows a pronounced shift in cathodic current density, in CR presence. CR corrosion inhibition mechanism appreciably affects both the anodic and cathodic corrosion sites/reactions. Ecorr shifted to the cathodic region with CR introduction and, thereafter, shifted towards the anodic region with higher CR concentrations. It could be inferred that CR corrosion inhibition mechanism, in an acidic environment, though cathodically controlled, becomes more anodically controlled with higher CR concentrations.
CR corrosion inhibition efficiency increased with higher inhibitor concentrations, to an optimum value of 97.45%, at 0.01 M CR, within the experimental condition.
The effect of temperature rise on CR corrosion inhibition efficiency was investigated with pipeline steel, in 0.5 M H2SO4 with 0.01 M CR, at varying temperatures, being shown in Fig. 3, while the corrosion kinetic parameters are shown in Table 2. The increase in temperature from 303 to 313 K slightly increased CR corrosion inhibition efficiency, with a slightly decrease at 323 k, and increased again at 333 k. The other parameters followed similar variations, though the variations were small. From Table 2, there is also a small shift in Ecorr, βc and βa values, indicating that a further increase in temperature did not significantly affect CR corrosion inhibition mechanism. The overall enhanced CR corrosion inhibition performance may support a hypothesis that its adsorption is more a chemisorption than a physisorption process [16].
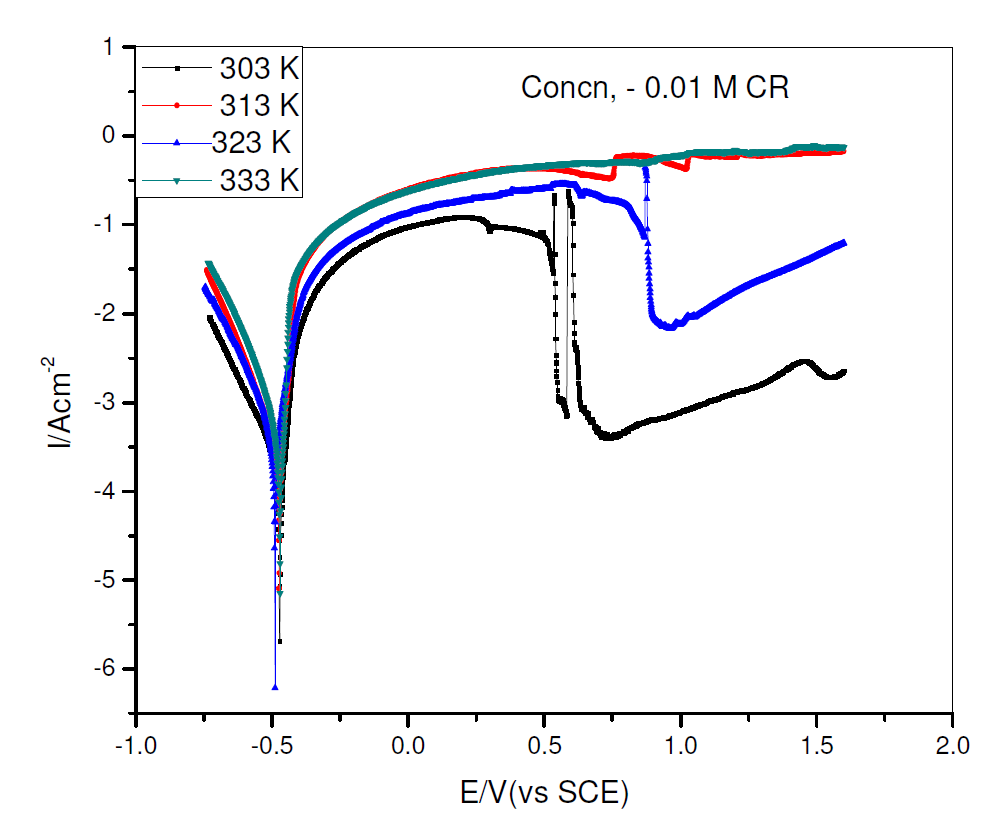
Figure 3 Potentiodynamic polarization curve for pipeline steel, in 0.5 M sulfuric acid with 0.01 M CR, at 303, 313, 323 and 333 K.
Table 2 Potentiodynamic polarization parameters for pipeline steel, in 0.5 M H2SO4 with 0.01 M CR, at 303, 313 and 323 K.
| 0.01 M 303 K | 0.01 M 313 K | 0.01 M 323 K | 0.01 M 333 K | |
|---|---|---|---|---|
| Icorr (A/cm2) | 3.75 e+2 | 8.22e+2 | 1.39 e+3 | 1.45+3 |
| βca (mV dec-1) | 163.08 | 150.03 | 104.23 | 155.48 |
| βan (mV dec-1) | 68.99 | 51.81 | 104.23 | 56.01 |
| Ecorr (mV vs SCE) | -486.09 | -492.37 | -502.60 | 491.66 |
| Inhib. Eff. (%) | 97.45 | 97.74 | 96.95 | 97.53 |
Electrochemical impedance spectroscopy
Electrochemical impedance spectroscopy (EIS) has been used to study the electrochemical process characteristics and kinetics, at the metal/solution interface, because it basically provides information on the resistive and capacitive behavior at the interface [17-19].
The electrochemical impedance Nyquist curves for pipeline steel, in 0.5 M sulphuric acid, in the absence and presence of different CR concentrations, at 303 K, are shown in Fig. 4, while the impedance parameters for Fig. 4 are shown in Table 3. Fig. 4 curves are in the form of semicircles with depressed centers under the X axis. This has been attributed to roughness and other surface inhomogeneties of the solid electrode [2, 20]. An examination of the Nyquist semicircles diameters shows that they increased in direct proportionality with an increase in CR concentration, which indicates higher charge transfer resistance and consequent increase in CR corrosion inhibition capacity, while the CPE value decreased [1].
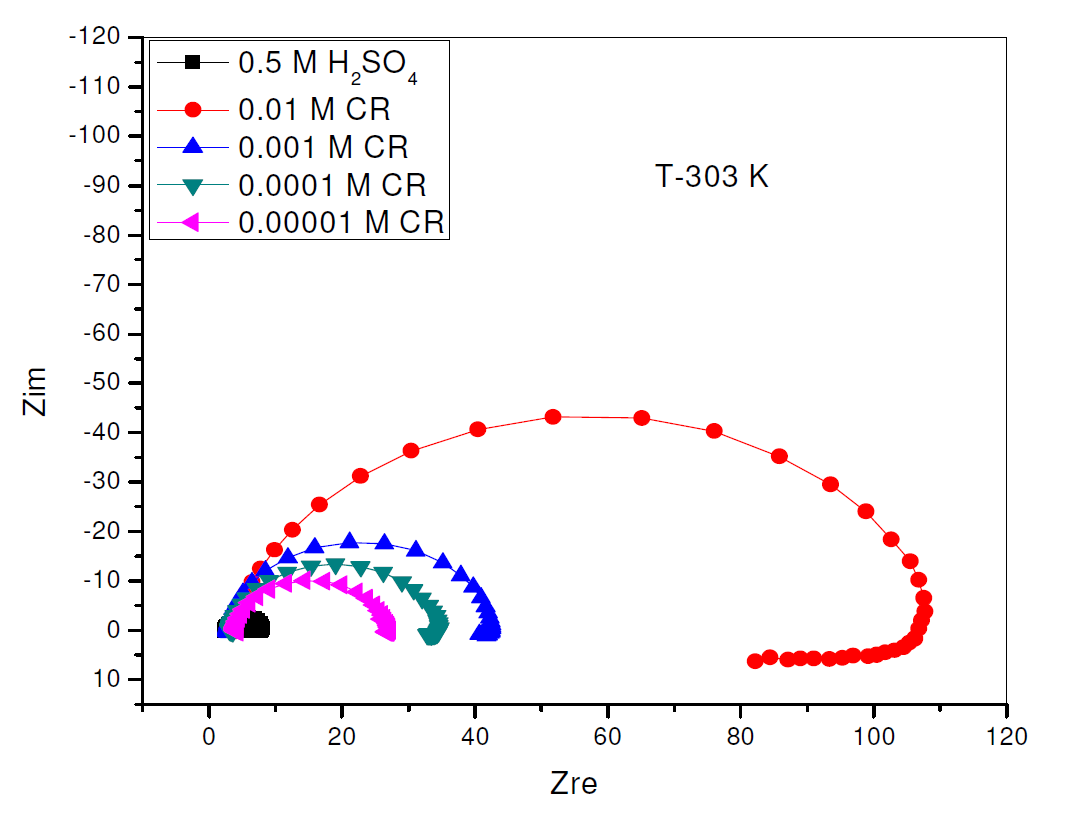
Figure 4 Nyquist plot for the electrochemical impedance of pipeline steel in 0.5 M H2SO4, in the presence and absence of different concentrations of Commercial Rutin, at 303 K.
The values of the charge transfer resistance (Rct) and of the interfacial double layer capacitance (CPE) were derived using the equivalent circuit in Fig. 5, while the values of the equivalent circuit elements were derived by using Zsimpwin software, being shown in Table 3. The resultant corrosion inhibition efficiency that was calculated with the Rct values was in agreement with the polarization results. From Fig. 5, the first resistance represents the solution resistance (Rs), the second represents the charge transfer resistance (Rct), while Q represents CPE. The circuit comprises Rct and CPE in a parallel relationship and both are in series with Rs. CPE ZCPE impedance is represented as follows:
where Yo is a proportional factor and n is the phase shift. When: n = 0, CPE represents a resistance; n = 1, a capacitance; n = 0.5, a Warburg element; and when n=-1, an inductance. ω is the angular frequency (rad s-1) and j2 = -1 is an imaginary number. [15].
Table 3 Impedance parameters for pipeline steel in 0.5 M H2SO4, in the presence and absence of different concentrations of commercial Rutin.
| Conc (M) | Rs (Ωcm2) | Rct (Ωcm2) | CPE Yo(S-sec ̂n/CM2) | n | η (%) |
|---|---|---|---|---|---|
| Blank | 2.37 | 5.29 | 0.00028 | 0.97 | -- |
| 0.00001 | 3.87 | 22.99 | 0.00011 | 0.93 | 77,00 |
| 0.0001 | 3.16 | 30.91 | 0.000076 | 0.91 | 82.89 |
| 0.001 | 2.80 | 39.47 | 0.000056 | 0.94 | 86.60 |
| 0.01 | 3.53 | 98.56 | 0.000050 | 0.89 | 94.62 |
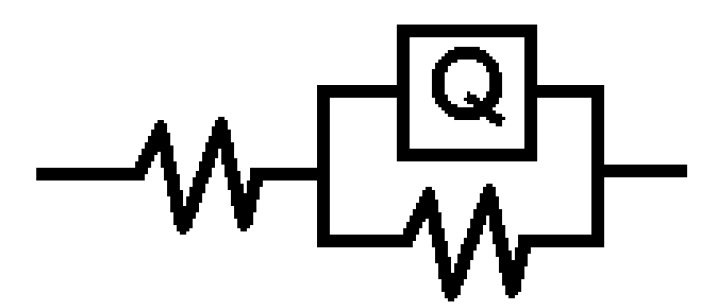
Figure 5 Electrochemical equivalent circuit for the electrochemical impedance response of pipeline steel in sulphuric acid with CR.
The time effect on CR inhibition corrosion, on pipeline steel in a sulphuric acid environment, which is shown in Fig. 6, was also evaluated by electrochemical impedance spectroscopy, because there is less perturbation in the system during measuremen. CR presence visibly increased the charge transfer resistance, with the resultant increase in its corrosion inhibition, with time. However, this trend was reversed on the 5th day to the 7th day, though CR showed an appreciable inhibition capacity all through the study time [21].
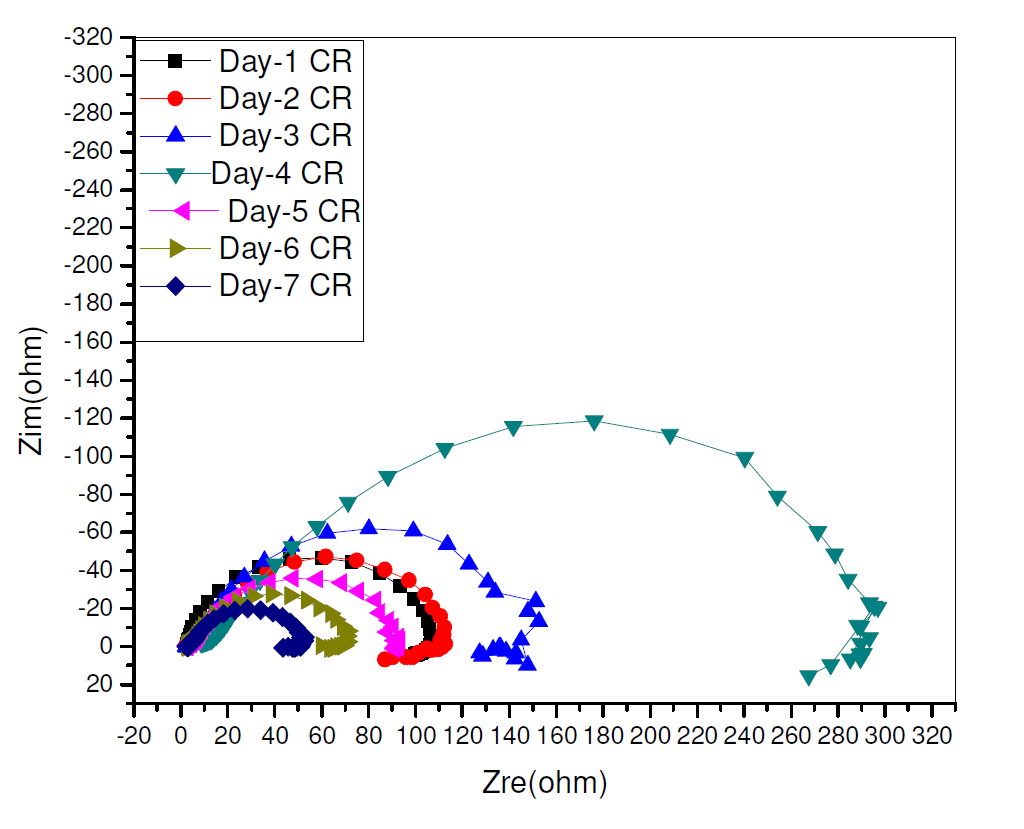
Figure 6 Nyquist plot for time effect of electrochemical impedance response on pipeline steel in 0.5 M H2SO4, in the presence and absence of different CR concentrations, during seven days.
Surface morphology
The corrosion surface morphology of two pipeline steel coupons immersed in, firstly, 0.5 M H2SO4 and, secondly, in 0.5 M H2SO4 with 0.01 M CR, which is shown in Figs. 7 and 8, respectively, was recorded using a scanning electron microscope micrograph, at 5000 magnification.
Fig. 7 shows the roughness of pipeline steel surface, as a result of corrosion in the acidic environment, while Fig. 8 shows a smoother surface, compared to Fig. 7, as a result of CR corrosion inhibition on the surface. This corroborates the electrochemical test results.
The corrosion inhibited (Fig. 8) surface may be attributed to the adsorption of the formed insoluble complex between hydroxyl oxygen p-electrons in rutin and iron d-electrons in pipeline steel. Similar inhibitor-metal surface interaction has been previously reported [5, 4]. Hydroxyl functional group usually ionizes in aqueous media, to form a proton and oxygen-anion. The oxy-anions in the rutin molecule will likely bond with the electrovalent iron surface, forming the rutin-iron complex. This will likely form a strong bond on the metal surface, because of the many oxy-adsorption sites in rutin. This suggests that rutin molecule is adsorbed at many points onto the steel surface.

Figure 8 Pipeline steel corrosion surface morphology in 0.5 M H2SO4 with 0.01 M CR, at 5000 magnification.
The slight corrosion damage shown in Fig. 8 could have occurred due to the fact that the inhibitor surface coverage was lower than 100%. So, a level of corrosion took place, even in the inhibitor presence, before the inhibitors molecules substituted water molecules, and were initially adsorbed onto the metal surface. Bockris and Swinkels, (1964) [22], had earlier reported that the adsorption onto the metal surface is a pseudo substitution process between water molecules and inhibitor molecules, which is expected to take some time [12].
Fourier transform infrared spectroscopy (FT-IR) spectra
Fourier Transform Infrared Spectroscopy Spectra have been used to establish the inhibitors chemical structure and adsorption onto the metals surfaces [23-24]. CR FT-IR spectrum and its surface film on pipeline steel, in sulphuric acid with 0.01 M CR, are shown in Fig. 9. From Fig. 9, it is possible to see similarities between both spectra in peaks and relative intensities. This shows that Rutin preserves its integral structure after its adsorption onto the pipeline steel surface. Also, new peaks and peak shifts were noticed, suggesting an interaction of Rutin with the pipeline steel surface, or of Rutin and sulphuric acid with the pipeline steel. Similar observations have been reported [25]. The spectrum of Fig. 9 ranges from 500 to 4000 cm-1. Some of the peaks are attributable to some functional groups: 1300-1000 cm-1 for s=o stretch; 1440-1400 cm-1 for OH bend; 1640-1610 cm-1 for C=C conjugate stretch; 1750-1735 cm-1 for C=O stretch; and 3580- 3650 cm-1 for Alcohol and Phenolic stretches. All these indicate the adsorbed CR molecule presence in the pipeline steel surface film immersed in a CR-acid solution.
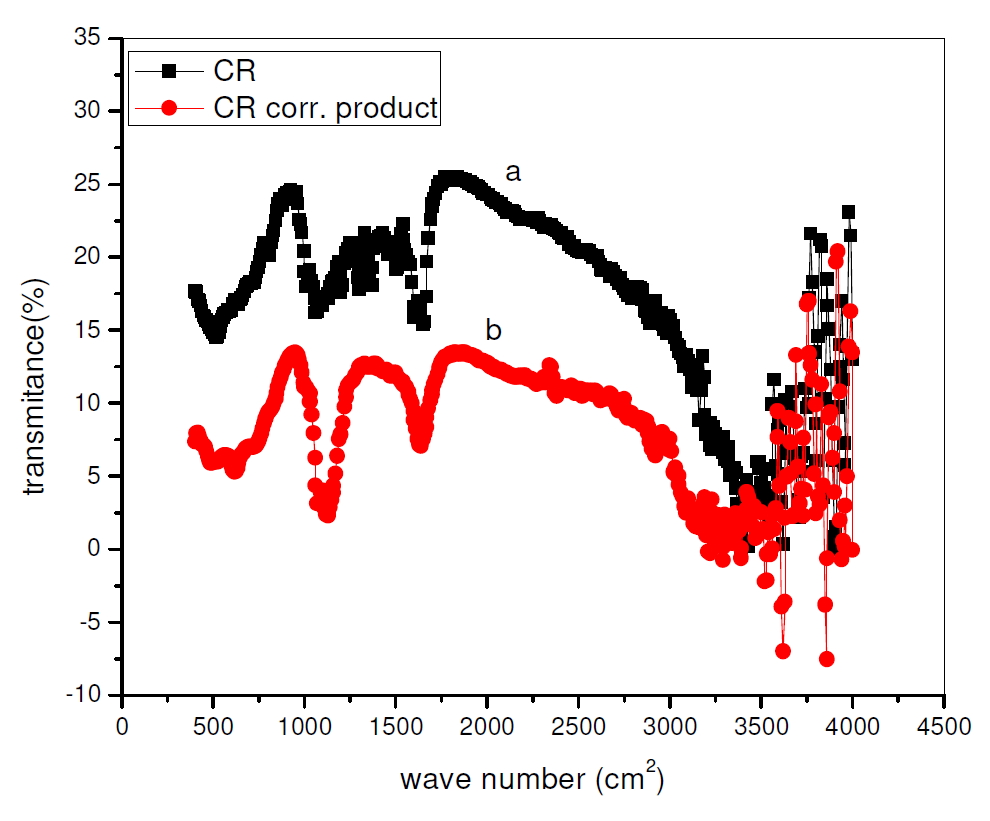
Figure 9 FT-IR spectrum of (a) CR and (b) CR surface film on the pipeline steel surface, after immersion in a H2SO4 solution with 0.01 M CR.
Adsorption isotherm
Corrosion inhibition by organic compounds has been attributed to their ability to get adsorbed onto the metal surface, forming a protective film [26-27]. The determination of an appropriate adsorption isotherm provides a useful insight into the metal-inhibitor interaction. In order to understand the CR molecules interaction mode with the pipeline steel surface, potentiodynamic polarization data (equation 4) were used to obtain their surface coverage data, which are shown in Table 4.
Table 4 Surface coverage data of different CR concentrations in 0.5 M H2SO4 on pipeline steel.
| Concentration (C) | Surface coverage (θ) |
|---|---|
| 0.00001 | 0.82 |
| 0.0001 | 0.90 |
| 0.001 | 0.92 |
| 0.01 | 0.98 |
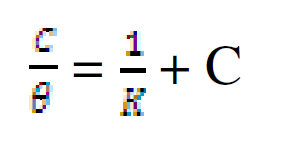
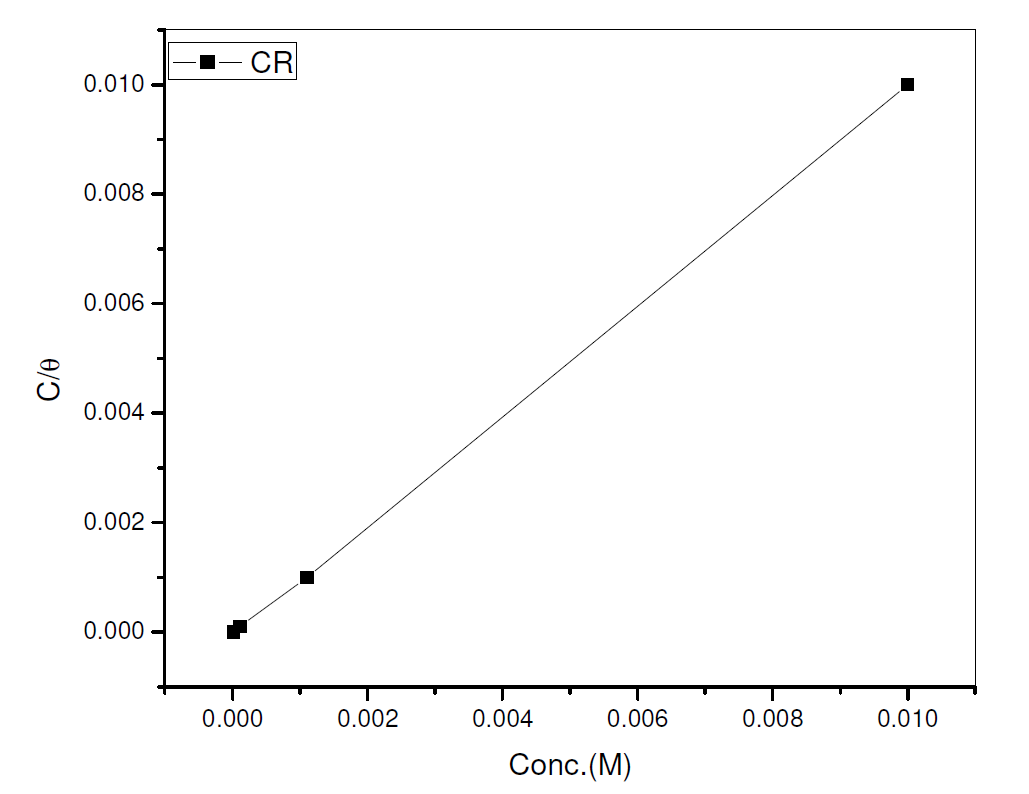
The data were graphically tested to find suitable adsorption isotherms. A plot of C/θ versus C showed a straight line shown in Fig. 10. The plot fitted into Langmuir adsorption isotherm (equation 5). Also, a straight line was obtained from a plot of Log θ versus Log C, which corresponded to Freundlich adsorption isotherm (Fig. 11).
where C represents CR concentration and θ represents inhibitor surface coverage.
Conclusion
This study showed an approach to corrosion inhibition using biomass derived molecule rutin. This approach gave a better understanding of the interaction between the corrosion inhibitor and the industrial process. Rutin showed high corrosion inhibition efficiency which is attributable to its multi-adsorption sites through the oxy-anion. CR corrosion inhibition capacity showed an overall increase with time and temperature, suggesting a chemical adsorption interaction with the pipeline steel surface.


