


 Inglês (pdf)
 Artigo em XML
 Referências do artigo
 Enviar este artigo por email
 Citado por SciELO
  Similares em
SciELO
Similares em
SciELO 
 Permalink
Introduction
Organic molecules containing imine groups have been of interest to inorganic chemists. These categories of molecules were found to be good ligands and to have utility in a broad range of applications [1-5]. Undoubtedly, the Schiff base ligands receiving the most attention have been those classified as Salen type ligands. Schiff bases constitute a potential class of corrosion inhibitors and, besides this, they have various important proprieties and extensive usages in medicine [6], pharmaceutical fields [7] and material science [8].
The application of organic corrosion inhibitors is a promising key alternative. Various types of organic structures have been designated to act as corrosion inhibitors [9-11]. The existing statistics indicate that the majority of organic inhibitors proceed by adsorption onto the metal surface. Most of the effective inhibitors utilized in industry are organic compounds, which mainly contain oxygen, sulfur, nitrogen atoms and multiple bonds. Those compounds inhibitory effect is attributed to their interactions with the metal surface, by adsorption. It has been detected that adsorption mainly depends on some physicochemical inhibitors characteristics, for example: electron density of the contributor atom, π-orbital character and the molecule electronic structure [12]. The functional groups contained in the organic structures act as reaction sites for the adsorption process [2]. The -C=N- group presence in Schiff bases enhances the corrosion inhibitor adsorption capacity and effectiveness [13]. These inhibitors are frequently adsorbed onto the mild steel surface, by the creation of a covalent bond (chemical adsorption), or by the electrostatic interaction between the metal and the inhibitor (physical adsorption). In addition, Schiff bases have shown a variety of biological actions through the azomethine bond that is accountable for several antibacterial, antifungal, herbicidal, clinical and antioxidant activities [14-17].
The objective of this work is the synthesis and characterization of a novel Schiff base ligand (L1); L1 = di[(4-phenylamino)-2,4-dihydroxy-salicylaldehyde)] ether, which involves N2O2 donor centers. The corrosion inhibition of this ligand (L1), on X48 mild steel in a 1 M HCl medium, was examined by weight loss, polarization method, electrochemical impedance measurements, quantum chemistry calculations and molecular dynamics simulations.
Experimental procedures
Mild steel composition
The mild steel (X48) containing (wt. %) of 0.09 % C, 0.058 % Si, 0.91 % Mn, 0.014 % P, 0.002 % S, 0.048% V, 0.001 % Ti, 0.056 % Nb, 0.044 % Al and balance Fe was submitted to electrochemical examination.
Inhibitor
4,4’-diaminodiphenyl ether and 2,4-dihydroxy salicylaldehyde were purchased from Sigma-Aldrich, France. The inhibitor, L1 ether, di (4-henylamino)2,4-dihydroxy salicylaldehyde, was synthesized in our laboratory.
Solution
The 1 M HCl acidic medium was prepared by dilution of AR grade 37% HCl in bidistilled water. The L1 stock solutions were properly diluted, to obtain the various concentrations (1.0×10⁻⁶, 1.0×10⁻⁵, 2.5×10⁻⁵, 5.0×10⁻⁵ and 7.5×10⁻⁵ M), and they were utilized in the corrosion inhibition study.
Measurements
The melting points were measured by a Kofler bank, and they have not been corrected. The IR spectra were recorded on a Perkin-Elmer 1000 series FT-IR spectrophotometer, using KBr disks. The UV-vis. spectra were obtained by DMF, with a UNICAM UV-300 spectrophotometer, with 1 cm quartz cuvettes. The 1H NMR spectra were recorded on a Jeol GSX WB spectrometer, at 270 MHz, in DMSO-d6 (dimethyl sulfoxide); the chemical shifts are given in ppm, using TMS as an internal reference. Mass spectra were measured in a positive mode, and in the range from m/z=100 to 500. Cyclic Voltammetry was recorded on a Voltalab-32 (DEA 332 type) Radiometer. The working electrode was a 1 mm diameter mild steel disk, the auxiliary electrode was a Pt wire and a saturated calomel electrode was employed as the reference electrode. Measurements were performed at 25 ± 0.2 ºC. DMSO was utilized as a solvent, and the ionic strength was maintained at 0.1 mol L-1, with TBAP (Tetrabutylammonium perchlorate), as supporting electrolyte. The species concentrations were in the 5 × 10⁻³ mol L-1 range. The sweep speed was 100 mV s-1, unless otherwise specified.
L 1 ligand synthesis
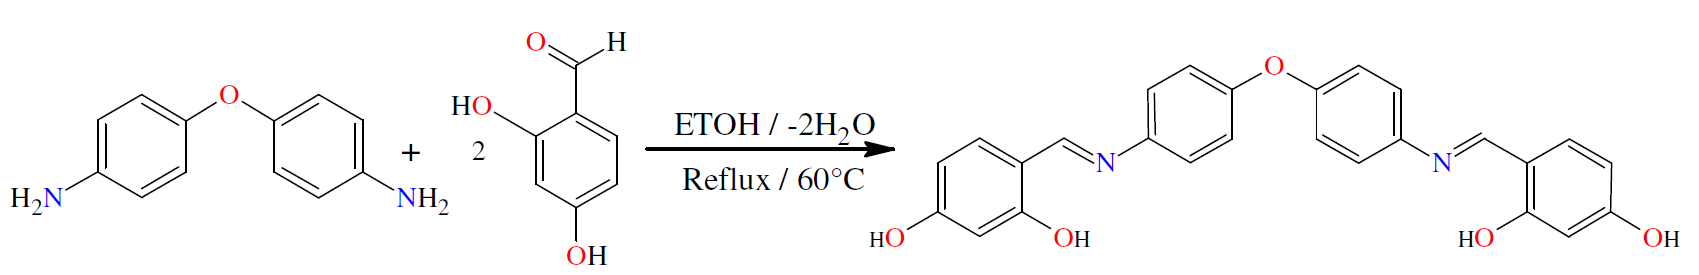
The L1 synthetic route given by the literature [18-24] is outlined in Scheme 1. The di[(4-phenylamino) 2,4-dihydroxy salicylaldehyde)] L1 ether ligand was obtained by the contact of 1 mmol (0.2 g) 4,4’-diaminodiphenyl ether, in 15 mL absolute ethanol, with 2 mmol 2,4- dihydroxy salicylaldehyde (0.26 g), in 10 mL ethanol. The mixture was refluxed for 3 h, followed by cooling to ambient temperature. The yellow product was filtered, washed twice with Et-OH (2 mL × 3), followed by diethyl ether (5 mL × 2), recrystallized from THF and Ethanol, and then dried in vacuum. Its yield was almost 88.5%.
Experimental techniques
Gravimetric experiments
Weight loss measurements are the simplest method to find the corrosion rate and the inhibitory effect. In this study, X48 specimens were immersed in 80 mL of a 1 M HCl medium, in the absence and presence of different tested Schiff base concentrations, for an exposure period of 24 h. The X48 mild steel specimens, utilized by the gravimetric method, were cut in order to get cylindrical surfaces with an exposed area of 33.912 cm2, successively abraded with several grades of emery papers, washed thoroughly with doubled distilled water, degreased with acetone and, finally, dried. The specimens weight, prior and after submersion, was measured using a Mettler balance. Triplicate experiments were performed for each inhibitor concentration, for reproducibility. The inhibitor concentration effect on inhibition efficiency, IEw (%), was studied, to obtain the specimen weight loss, by the gravimetric method, with different concentrations (1.0×10⁻⁶, 1.0×10⁻⁵, 2.5×10⁻⁵, 5.0×10⁻⁵ and 7.5×10⁻⁵ M). The corrosion rate, W, was calculated by using equation (1).
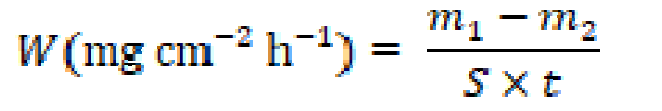
where m1 (mg) is the uncorroded specimen mass, m2 (mg) is the corroded specimen weight, S (cm2) is the specimen total area, t (h -1) is the corrosion time, and W (mg cm-2 h-1) is the corrosion rate. The IEw (%) was determined by employing equation (2) [25].

where w0 (mg cm-2 h-1) is the corrosion rate without inhibitor and winh (mg cm-2 h-1) is the corrosion rate with the inhibitor.
Electrochemical proceedings
The electrochemical measurements were carried out in a three-compartment Pyrex cell, with a separate compartment for the saturated calomel (SCE) reference electrode that was connected to the main compartment via a Lugging capillary. A platinum foil was used as the counter electrode (2 cm2 area). The employed working electrode was prepared using X48 mild steel, in the form of a cylindrical rod, embedded in epoxy resin, leaving an open surface area of 0.28 cm2. The working electrode was mechanically smoothed by emery paper (220 and 4000 grades), washed with double distilled water, and then placed in the test solution. The electrochemical data were obtained after 30 min. of immersion in an experimental solution, ensuring a reliable corrosion potential and an equilibrated system.
The polarization measurements were performed at a scan rate of 0.5 mV s-1, from -800 to -300 mV potential ranges. First, the aqueous electrolyte medium (1 M HCl) was prepared from 37 % HCl analytical grade (Merck) and bidistilled water. The measurements were performed in 1 M HCl with and without the examined Schiff base compound, in the concentration range of 10-6 M to 7.5×10⁻⁵ M. Then, all electrochemical calculations were carried out at ambient temperature, utilizing a PGZ-301 Voltalab-40 potentiostat/galvanostat model. The data were analyzed using a Pentium-IV computer with Volta Master IV program. The linear Tafel segments of anodic and cathodic curves were extrapolated to corrosion potential (Ecorr), to obtain corrosion current densities (icorr). The IEp (%) (inhibition efficiency percentage), at different inhibitor concentrations, was calculated using equation (3).
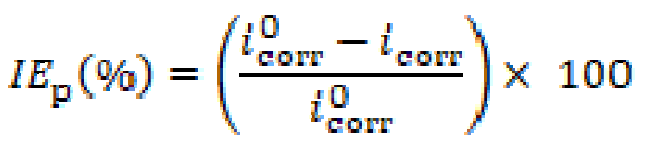
where (mA cm-2) and icorr (mA cm-2) represent the corrosion current density vapors without and with inhibitor, respectively.
The electrochemical impedance spectroscopy (EIS) was carried out at OCP, in the frequency range from 100 KHz to 10 mHz, with a signal amplitude perturbation of 5 mV. The inhibition efficiency resistance, IER(%), was estimated by equation (4).
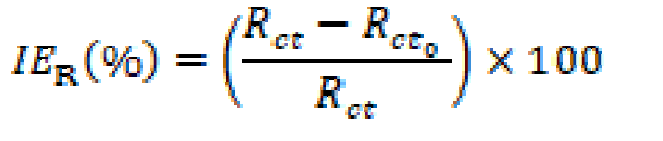
where (Ω cm2) and Rct (Ω cm2) are charge transfer resistance for X48 mild steel, in the inhibitor absence and presence, respectively. Nyquist and bode plots were drawn from these experiments.
Surface morphology (AFM and SEM)
The pictures of the oxidized area, before and after the inhibitor addition, were recorded by atomic force microscopy (AFM) and scanning electron microscopy (SEM). X 48 mild steel samples, with the dimensions of 2 × 2 × 0.4 cm, were prepared. After immersion in a 1 M HCl solution, without and with the addition of 7.5 × 10⁻⁵ M of L1, at 25 °C, for 24 h, the specimens were cleaned with distilled water, dried with a cold air blaster, and then examined by an MFP-3D AFM (Asylum Research, an Oxford Instruments company) and JEOL-JSM-7001F SEM (Japan).
Theoretical study
Quantum chemical calculations
The computational calculations of the studied Schiff base were carried out using the Gauss View Molecular Visualization program [26] and standard Gaussian 09 software package [27]. Geometry optimization was performed by density functional theory (DFT) level, with the non-local B3LYP hybrid density functional [28], at 6-31G (d, p) basis sets [29]. The quantum chemical indices have been taken into account: energy of the highest occupied molecular orbital (EHOMO), energy of the lowest unoccupied molecular orbital (ELUMO), energy gap (ΔEgap=EHOMO-ELUMO), dipole moment (µ) and Mulliken charge.
Molecular dynamics simulation
Molecular dynamics simulation (MDS) has appeared as a modern tool for studying the contact between the inhibitor molecule and the concerned metal surface [30]. The interaction between the investigated Schiff base and the iron surface was simulated via a Forcite module of Materials Studio 7.0 software developed by Accelrys Inc. [31]. Herein, the Fe (1 1 0) surface was carefully chosen as the adsorption substrate, due to its packed surface and better stabilization. The simulations were made in a simulation box (24.82 Å × 24.82 Å × 20.13 Å), with periodic boundary conditions. The box included a Fe slab, an acidic solution layer and a vacuum layer. The MD simulations were realized by the COMPASS force field, in an NVT ensemble, at 298 K, commanded by an Andersen thermostat, with a time step of 1 fs and dynamics time of 5 ps. The total simulation time was 5000 ps. Non-bonded interactions and van der Waals and electrostatic interactions were set using atom-based summation method and Ewald summation tool. The interaction energy between the inhibitor molecules and the Fe (1 1 0) surface was obtained using equation (5) [32].
 (5)
(5)where Etotal (kcal mol-1) is the simulation system total energy, Esurf (kcal mol-1) is the iron surface energy and Einh (kcal mol-1) is the free inhibitor molecule energy. The binding energy (Ebin) is Eint: Ebin = - Eint.
Results and discussion
L 1 preparation and characterization
Preparation
The ligand synthesis reaction is given in Scheme 1. It is the condensation between 4,4’-diaminodiphenyl ether and 2,4-dihydroxy salicylaldehyde, to give L1 ether, di [(4-phenylamino)2,4-dihydroxy salicylaldehyde].
The analytical and spectral data of the Schiff base ligand are summarized in Table 1.
Table 1 Analytical and spectroscopic data for the L1 ligand.
| Compound | Yield (%) | Color | M.P (°C) | Found Elemental analysis (Cal.) (%) | Infrared (KBr pellets) (cm-1) | UV-vis DMF solution | ||||
| C | H | N | ν(O-H) | ν(C=N) | ν(C-O-C) | λmax (nm) | ||||
| L1 (C26H20N2O5) | 88.5 | Yellow | 260 | 72.08 (70.90) | 5.39 (4.58) | 7.02 (6.36) | 3230 | 1640 | 1260 | 286,354 |
Characterization
Mass spectra
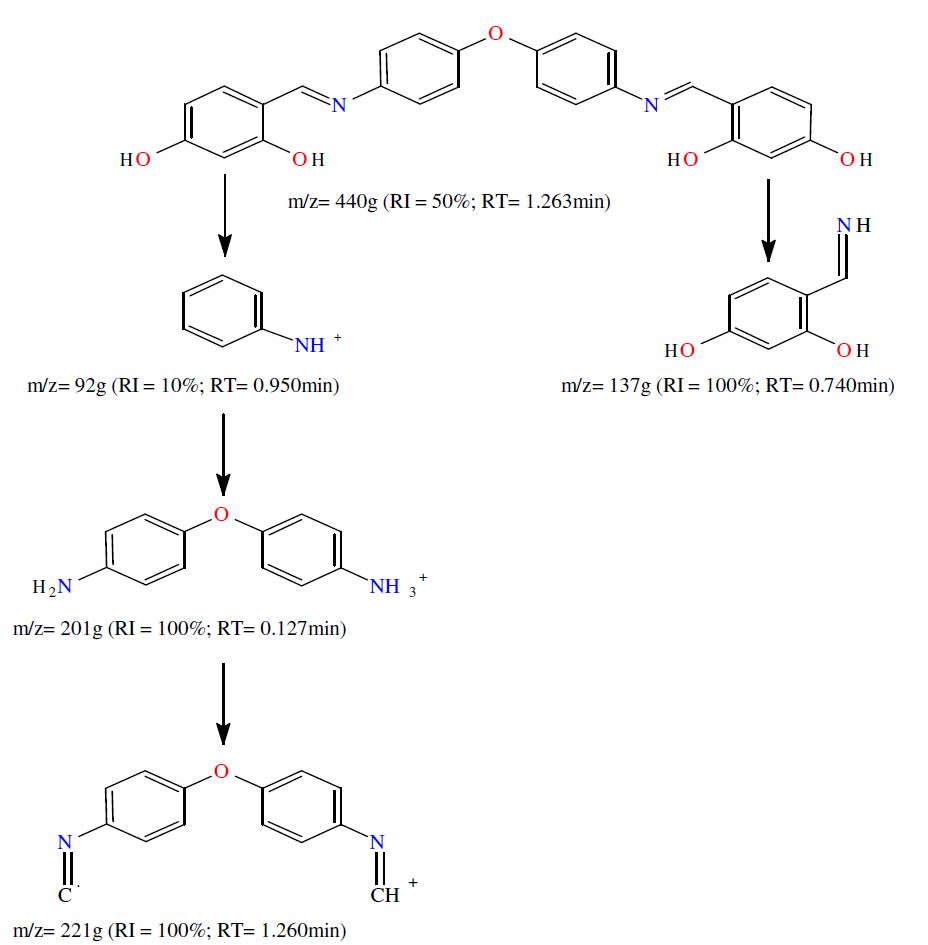
The L1 ligand electron impact mass spectra confirm the probable formula, by showing a m/z = 440 g peak (Scheme 2), which corresponds to the macrocyclic moiety (C26H20N2O5).
Infrared spectra
The ligand infrared spectra were recorded in KBr pellets, from 4000 to 400 cm-1 (Table 1). The ligand azomethine groups vibration was observed at 1640 cm-1 [34, 35]. Additionally, the ligand peaks, observed at 1260 cm-1, have been assigned to the etheric C-O-C stretching.
1H NMR spectra
L1 ligand 1H NMR spectra, recorded in DMSO-d6 (Table 1), showed: two signals at 13.5 and 10.25 ppm (s; 2H), assigned to OH phenolic; one signal at 8.8 ppm (s; 2H), assigned to CH = N [36]; and four signals at 7-7.2 ppm, 7.4-7.6 ppm, 6.2-6.4 ppm and 6.4-6.6 ppm, in the form of multiplets, assigned to aromatic CH [37].
Electronic spectra
The ligand electronic spectra were recorded in the field (200-600 nm), in DMF, and the relevant data are presented in Table 1. The band observed at 286 nm is assigned with the (-(* transitions aromatic nucleus [38], and other band located at 354 nm is due to (-(*transitions [39, 40].
Electrochemistry
The L1 electrochemical behavior was investigated using cyclic Voltammetry (CV) technique, in a DMSO solution containing 0.1 M TBAP, on a platinum working electrode and a saturated calomel reference electrode. The data obtained in this work are listed in Table 2.
Table 2 Voltammetry results for the L1 ligand, at 25 ºC, in DMSO, with an ionic strength of 0.1 mol L-1 (TBAP). Results in V/ECS: Epa, anodic; Epc, cathodic.
| Compound | Epa1 | Epa2 | Epc1 | Epa3 | Epa4 | Epc2 | Epc3 | Epc4 |
| L1 (C26H20N2O5) 4-acetamidonaphthalic anhydride | 0.46 | 0.87 | 0.38 | -0.50 | - | -0.75 | -1.30 | -1.6 |
For the L1 ligand, a cyclic sweep, from the +0.25 to 1.0 V/SCE range, shows one cathodic peak at 0.38 V/SCE and two anodic peaks at +0.46 and +0.87 V/SCE; the latter is due to the phenolic grouping oxidation (Fig. 1a) [41].
The cyclic voltammogram for the electro-reduction shows three cathodic peaks: the first, at -1.65 V/SCE, is due to the molecule imino moiety reduction [22,40-42]; the second, at -1.30 V/SCE; and the third is due to quasi-reversible reduction processes located at -0.75 V/SCE, with the corresponding cathodic peak at -0.50 V/SCE (Fig. 1b).
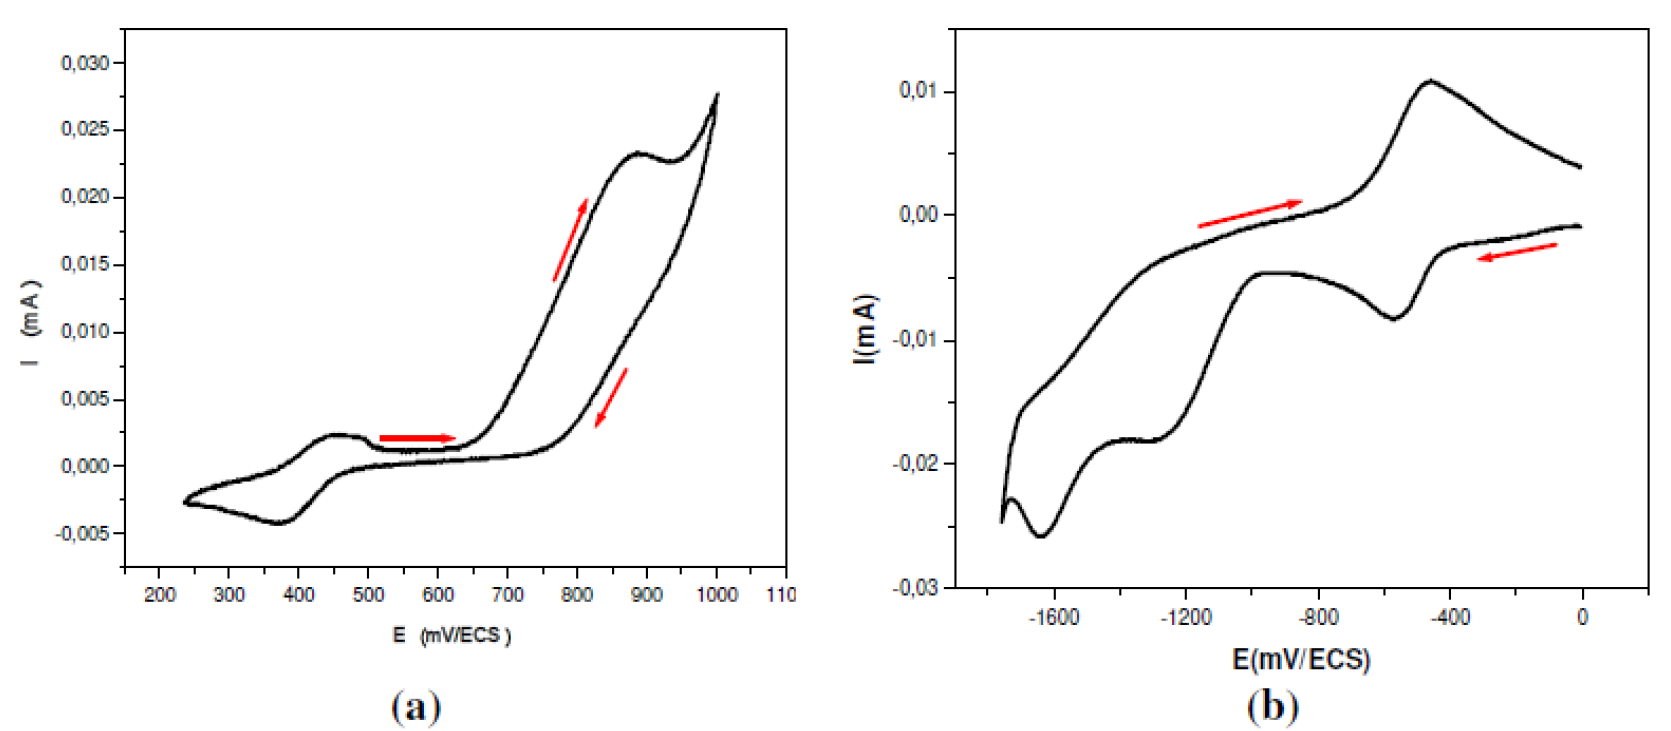
Figure 1 Cyclic Voltammogram of L1 ligand: 5×10⁻³ mol L-1 in 0.1 mol L-1 DMSO-TBAP. v =100 mV s-1. ET: Pt. (a) 250 mV to 1000mV/SCE, (b) 0 to -1800 mV/SCE.
L 1 corrosion inhibition study
Gravimetric experiments
The inhibitory effect of the examined L1 Schiff base, with different concentrations, was determined in a 1 M HCl medium, at 298 K, for a 24 h immersion.
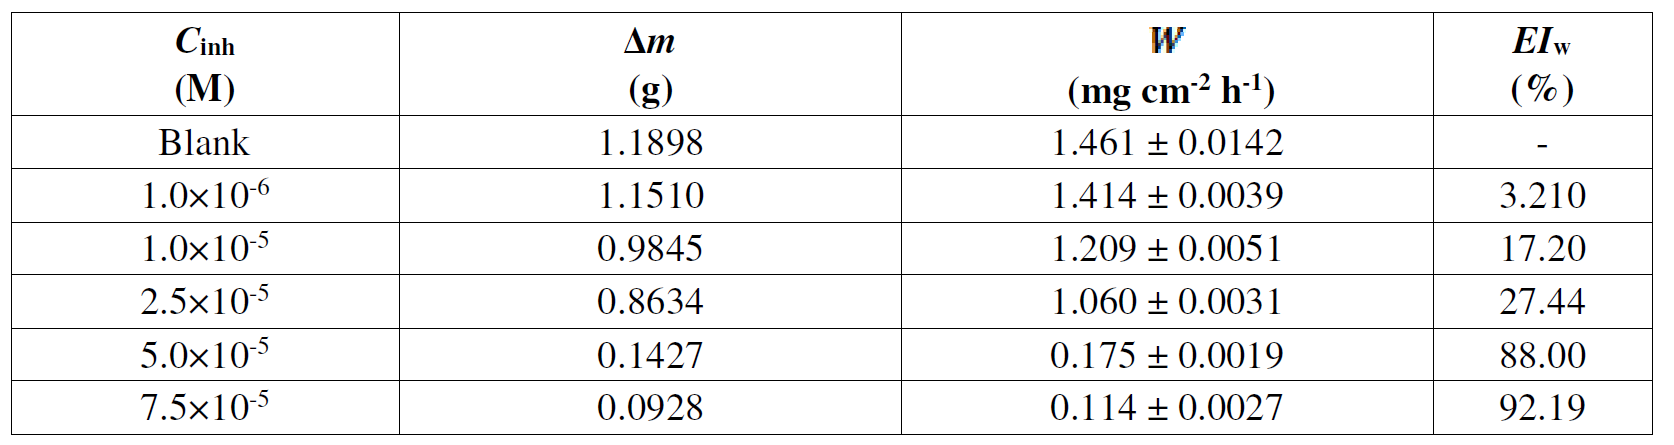
Corrosion rate, W, and inhibition efficiency, IEw (%), values were calculated using Equation (1) and (2), respectively. The results are presented in Table 3.
Table 3 Mild steel corrosion factors found from weight loss experiments in a 1 M HCl medium containing L1 with different concentrations, at 298 K, after 24 h on plunge.
| C inh (M) | Δm (g) |
 (mg cm-2 h-1) (mg cm-2 h-1) |
EI w (%) |
|---|---|---|---|
| Blank | 1.1898 | 1.461 ± 0.0142 | - |
| 1.0×10⁻⁶ | 1.1510 | 1.414 ± 0.0039 | 3.210 |
| 1.0×10⁻⁵ | 0.9845 | 1.209 ± 0.0051 | 17.20 |
| 2.5×10⁻⁵ | 0.8634 | 1.060 ± 0.0031 | 27.44 |
| 5.0×10⁻⁵ | 0.1427 | 0.175 ± 0.0019 | 88.00 |
| 7.5×10⁻⁵ | 0.0928 | 0.114 ± 0.0027 | 92.19 |
It is clear that L1 inhibition efficiency, EIw (%), and its corrosion rate, W, increase with higher inhibitor concentrations, exhibiting their maximum values (92.19 % and 0.114 mg cm-2 h-1, respectively) at the concentration of 7.5×10⁻⁵ M. This phenomenon can be due to the formation of a layer adsorbed onto the metallic surface.
Polarization experiments
Potentiodynamic polarization branches for mild steel in a 1 M HCl solution, in L1 absence and presence, with various concentrations, after immersion for 30 min, at 298 K, are shown in Fig. 2.
Electrochemical settings, such as corrosion potential (Ecorr), corrosion current density (icorr), anodic and cathodic Tafel slopes (βa and βc) were calculated, and are shown in Table 4.
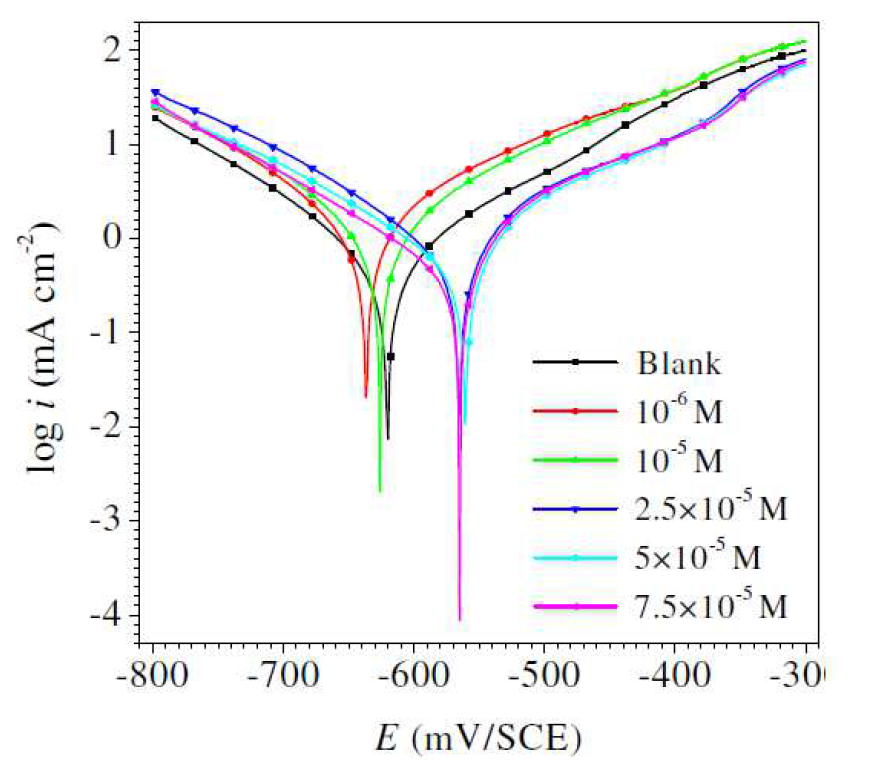
Figure 2 Mild steel electrode polarization plots obtained in a 1 M HCl solution containing different Schiff base compound concentrations, at 25 ºC.
Table 4 Polarization data and corresponding inhibition efficiency for mild steel in 1 M HCl, with and without the examined Schiff base, with different concentrations, at 25 °C.
| C inh (M) | -E corr (mV/ECS) | -β c (mV/dec) | β a mV/dec) | R p (Ω cm2) | i corr (mA cm-2) | IE p (%) | θ |
|---|---|---|---|---|---|---|---|
| Blank | 554 | 127.8 | 160.8 | 17.04 | 1.672 | - | - |
| 1.0×10⁻⁶ | 636 | 114.0 | 118.2 | 18.94 | 1.200 | 28.14 | 0.28 |
| 1.0×10⁻⁵ | 626 | 106.4 | 110.4 | 21.38 | 0.980 | 41.31 | 0.41 |
| 2.5×10⁻⁵ | 565 | 104.4 | 71.6 | 30.16 | 0.500 | 70.05 | 0.70 |
| 5.0×10⁻⁵ | 560 | 115.6 | 65.7 | 35.19 | 0.410 | 75.44 | 0.75 |
| 7.5×10⁻⁵ | 565 | 91.0 | 49.8 | 39.41 | 0.270 | 83.83 | 0.83 |
It is clear in Fig. 2 that the cathodic curves show a lower current density in L1 presence than that recorded in the HCl medium. Ecorr (Table 4), in L1 presence, was shifted to more negative values; this effect is more evident at higher concentrations. These results indicate that L1 behaved mainly as a cathodic inhibitor [45, 46]. The results in Table 4 show that the differences in Ecorr values between the inhibited and the uninhibited systems are generally less than 85 mV. This implies that the tested compound is a mixed-type inhibitor with, predominantly, cathodic inhibition at higher concentrations [47].
In other words, L1 compound inhibits mild steel anodic dissolution in 1 M HCl, and delays the cathodic reduction reaction associated with hydrogen evolution. The values variation in the anodic Tafel slope, βa, in the inhibitor presence, can be attributed to the chloride ion molecules or inhibitors adsorption onto the mild steel surface, or to the appearance of certain redox process involving the Fe inhibitor complex on steel active sites [48-50]. Tafel slopes values also vary with the inhibitor concentrations. These remarks indicate that L1 inhibitive action includes some changes in the corrosion reactions mechanism.
According to the polarization measurements, the inhibition efficiency increases with higher inhibitor concentrations, and reaches a maximum value of 83.83 %, at 7.5×10⁻⁵ M.
Electrochemical impedance spectroscopy measurements (EIS)
EIS experimental data, such as the solution resistance (Rs), the charge-transfer resistance (Rct), the double layer capacitances (Cdl), the constant phase element (CPE), inhibition efficiency, IER (%), and the surface coverage (θ), for mild steel corrosion, in L1 absence and presence, at 298 K, are summarized in Table 5. The impedance spectra for mild steel, in a 1 M HCl medium without and with L1, with different concentrations, are presented as Nyquist plots in Fig. 3. The results confirm that L1 successfully inhibited mild steel (X48) surface corrosion [51]. In Table 5, the charge-transfer resistance (Rct) value increased with higher inhibitor concentrations, showing substantial surface coverage by the L1 inhibitor, through strong bonding with the X48 surface. By increasing the inhibitor concentration, Cdl values tended to decrease, which may be due to the reduction in local dielectric constant and/or to an increase in the electrical double layer thickness [52-56].
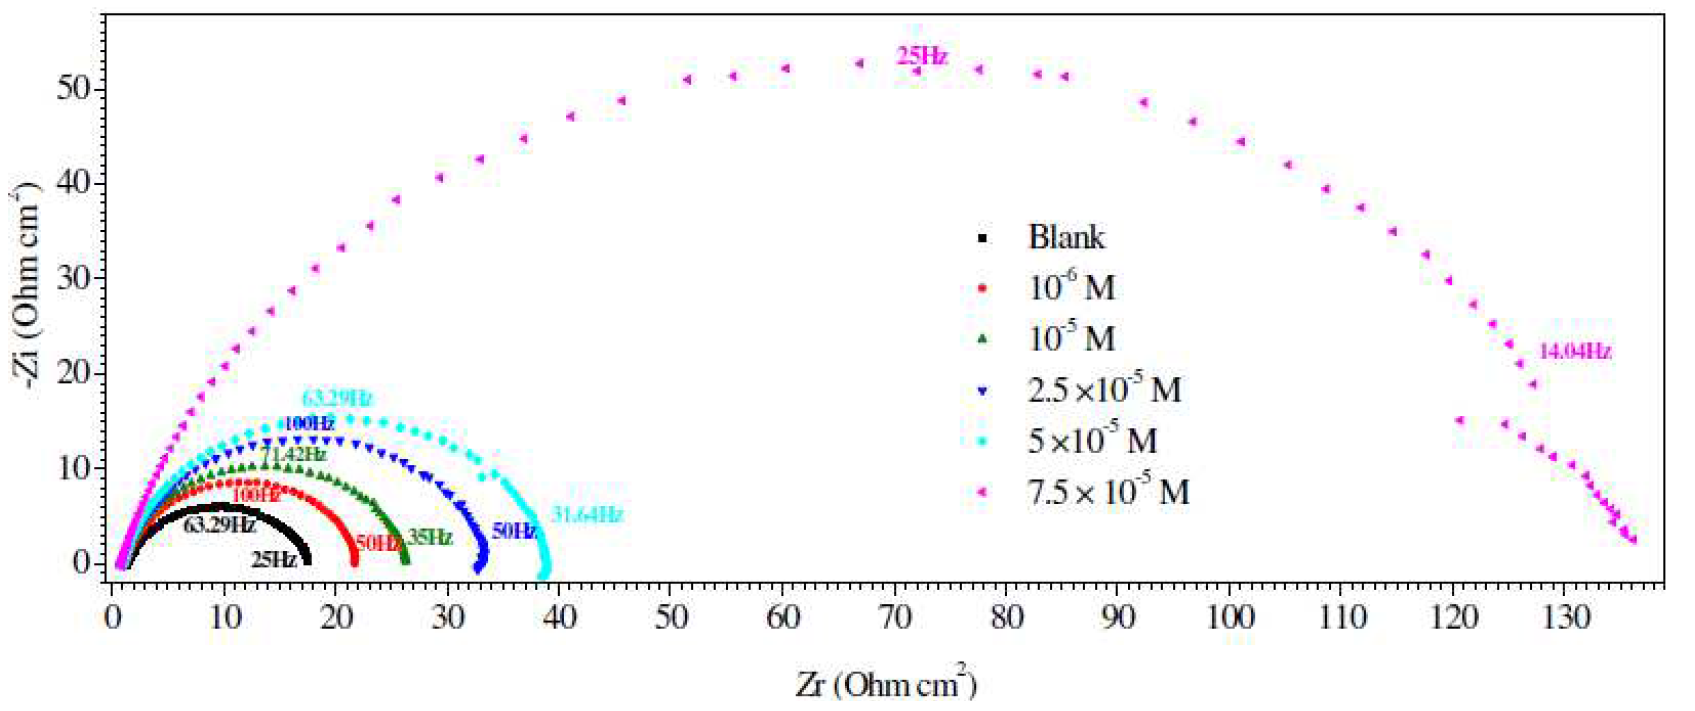
Figure 3 Nyquist diagrams for mild steel in 1 M HCl containing different Schiff base compound concentrations, at 25 °C.
Table 5 Electrochemical impedance parameters for mild steel in 1 M HCl, with and without Schiff base compound, with various concentrations, at 25 ºC.
| C inh (M) | R s (Ω cm2 ) | R ct (Ω cm2) | C dl (μF cm-2) | CPE | IE R (%) | θ | |
|---|---|---|---|---|---|---|---|
| n | Q (Sn Ω-1 cm-2) | ||||||
| blank | 1.320 | 15.07 | 1223.0 | 0.783 | 279.2 | - | - |
| 1.0×10⁻⁶ | 1.190 | 19.62 | 393.5 | 0.848 | 80.78 | 23.19 | 0.23 |
| 1.0×10⁻⁵ | 0.950 | 24.59 | 342.3 | 0.859 | 70.64 | 38.71 | 0.39 |
| 2.5×10⁻⁵ | 1.140 | 31.34 | 264.1 | 0.865 | 50.83 | 51.91 | 0.52 |
| 5.0×10⁻⁵ | 0.980 | 37.09 | 219.4 | 0.868 | 40.39 | 59.36 | 0.59 |
| 7.5×10⁻⁵ | 0.910 | 132.79 | 187.9 | 0.851 | 34.05 | 88.65 | 0.88 |
Furthermore, the Bode diagrams were plotted using the same experimental data in the Nyquist format (Fig. 4). A new phase angle shift, at a higher frequency range, and a continuous increase in the phase angle shift, with higher inhibitor concentrations, were observed. This phase angle shift is due to the creation of a protective film by the inhibitor on X48 surface, which changed the electrode interfacial structure [57, 58]. The continuous increase in the phase angle shift is noticeably correlated with the growth of surface coverage by the inhibitor molecules.
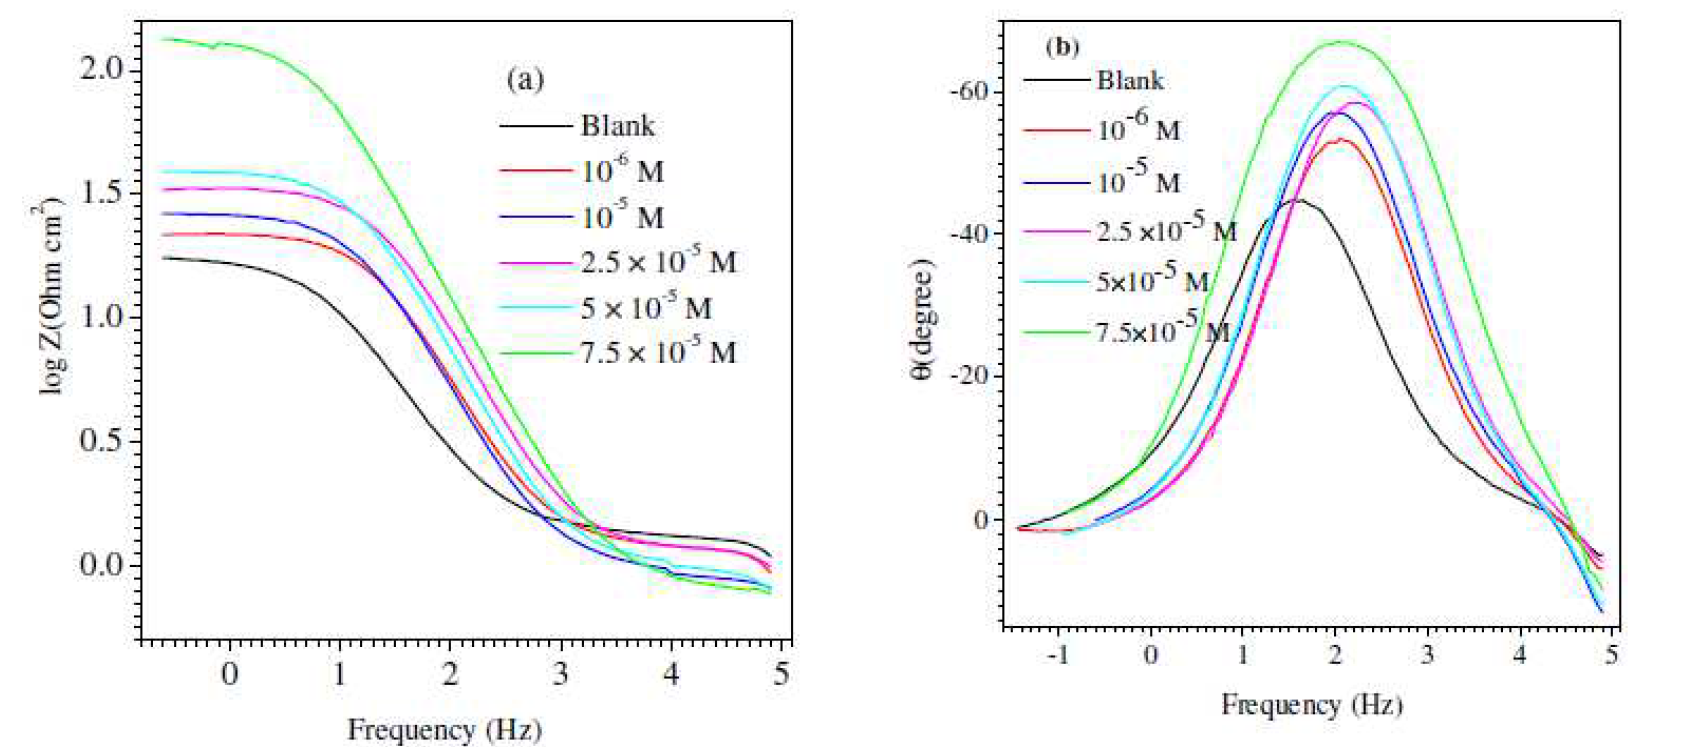
Figure 4 (a) Bode and (b) phase angle plots for mild steel in 1 M HCl, without and with inhibitor (L1), with different concentrations, at 25 °C.
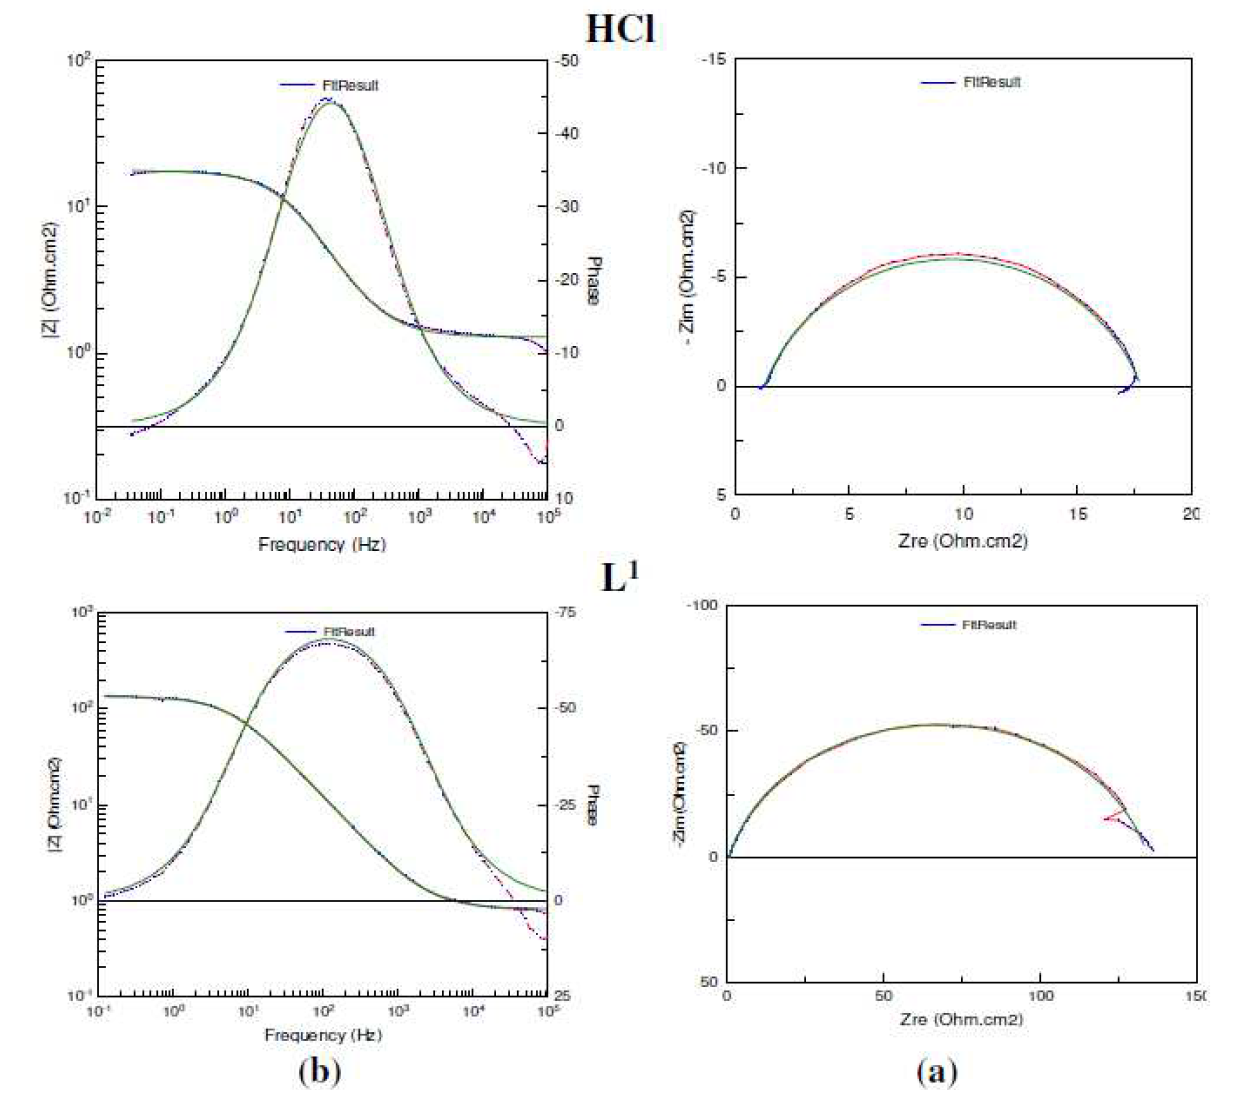
Figure 5 Impedance diagrams for mild steel in 1 M HCl + 7.5  10-5 M of L1: (a) Nyquist plot and (b) Bode plot; (....) experimental result; (-) fit result.
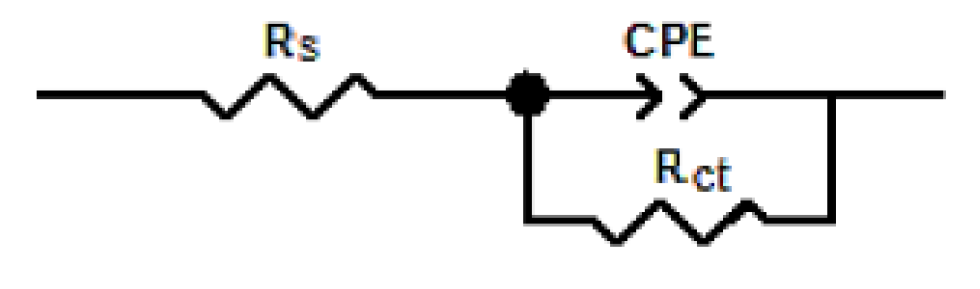
The impedance diagrams were found by fitting (Fig. 5) to the equivalent circuit model shown in Fig. 6, which has been utilized earlier to adequately model the mild steel/acid interface [59-62]. In this equivalent circuit, the solution resistance was shorted by a constant phase element (CPE) that was placed in parallel to the charge transfer resistance. The CPE was utilized in the place of a capacitor to compensate deviations from a perfect dielectric conduct arising from the inhomogeneous nature of the electrode surfaces [63-67].
The electrochemical data are presented in Table 5, and show that the inhibitor increased Rct magnitude, with the corresponding decrease in the double layer capacitance (Cdl). The increase in Rct, values, in the inhibiting systems, which corresponds to an increase in the Nyquist semicircle diameter, confirms the corrosion inhibiting effect of both inhibitors. The observed decrease in Cdl values, which normally results from a decrease in the dielectric constant and/or from an increase in the double-layer thickness, can be attributed to the inhibitor molecules adsorption (with a lower dielectric constant compared to that of the displaced adsorbed water molecules) onto the metal/electrolyte interface, thereby protecting the metal from aggressive attacks [68-71].
Temperature effect
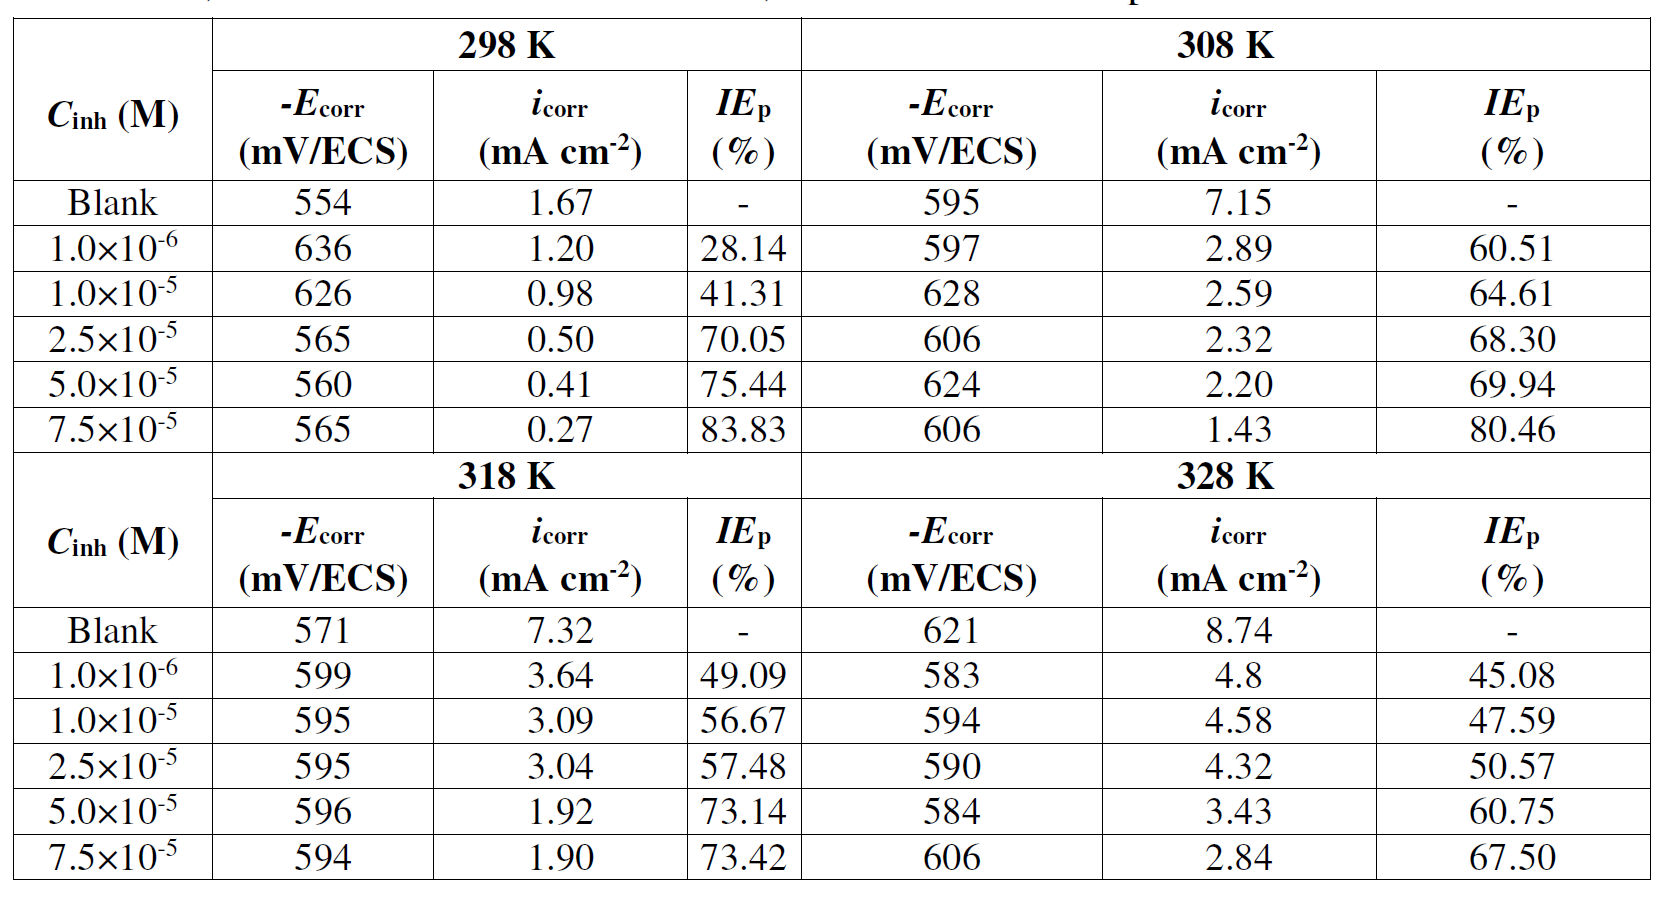
The temperature effect on L1 corrosion inhibition efficiency was studied by polarization curves, in the temperature range from 298 to 308 K, in the absence and presence of the examined Schiff base, with different concentrations. The found data are summarized in Table 6.
From the results, it can be observed that IEp (%) decreases with higher temperatures. The increase in temperature resulted into the adsorbed L1 molecules desorption from the mild steel surface, causing a decrease in IEp (%) [72]. Despite the decrease in IEp (%), it can be said that our product is always effective for mild steel inhibition, because IEp (%) reached the value of 67.5 %, at 328 K, with a concentration of 7.5×10⁻⁵ M. These results confirm that the Schiff base molecule is a good inhibitor in the studied temperature range [73-75].
Arrhenius and transition state equations were utilized to calculate the corrosion process activation thermodynamic data, such as apparent activation energy (Ea), enthalpy of activation (ΔHa) and entropy of activation (ΔSa). In the Equations (6) and (7),  is the pre-exponential factor, icorr is the corrosion current density, h is the Plank’s constant, NA is the Avogadro’s number, T is the absolute temperature and R is the universal gas constant.
 (6)
(6)
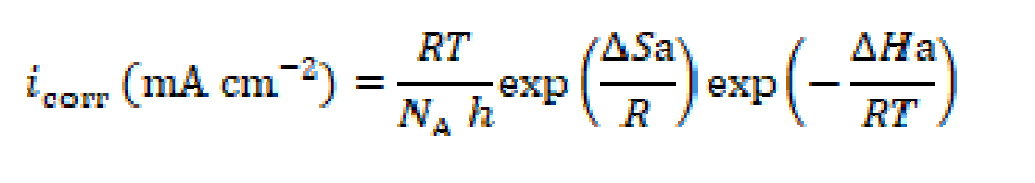
Table 6 Polarization data for mild steel in 1 M HCl, without and with the synthesized Schiff base, with different concentrations, and at various temperatures.
According to the data showed in Table 7, (Fig. 7) give straight lines. The Ea, ΔHa and ΔSa parameters were calculated from the slopes and intercepts of the lines, and the obtained data are given in Table 8. It is evident from Table 7 that Ea value for mild steel corrosion in L1 presence is greater than in its absence, which indicates the inhibitor molecules physical adsorption onto the metal surface. According to the literature [76-79], the inhibitor physical adsorption onto the metal surface leads to the formation of a barrier between the latter and the corrosive medium, blocking the charge transfer, and thereby reducing the metal reactivity in the corrosion electrochemical reactions [80]. On the other hand, a diminution in inhibition efficiency with the rise in temperature, with an analogous increase in corrosion activation energy in the inhibitor presence, compared to when it is absent, is normally interpreted as being due to the creation of an adsorption layer of physical nature [57, 79, 81]. ΔSa value increases in L1 presence. The negative increment of the entropy of activation reflects the inhibitor formation of an ordered stable layer on the mild steel surface [79,80]. ΔHa value is higher in the inhibitor presence. ΔHa positive signs reflect the endothermic nature of mild steel dissolution process, and suggest that the mild steel dissolution rate is slower in L1 presence [82]. It can be noticed that Ea and ΔHa values vary in the same way, permitting to verify the known thermodynamic equation between them [82].
Table 7 Activation parameters for X48 in 1M HCl, in L1absence and presence, with different concentrations.
| C inh (M) | E a (kJ mol-1) | ΔH a (kJ mol -1 ) | ΔS a (J mol -1 K -1 ) |
|---|---|---|---|
| blank | 36.49 | 33.37 | -130.04 |
| 1.0×10⁻⁶ | 39.92 | 36.71 | -120.44 |
| 1.0×10⁻⁵ | 41.08 | 38.21 | -109.29 |
| 2.5×10⁻⁵ | 51.84 | 48.63 | -86.03 |
| 5.0×10⁻⁵ | 56.03 | 52.76 | -70.88 |
| 7.5×10⁻⁵ | 61.05 | 57.70 | -59.18 |
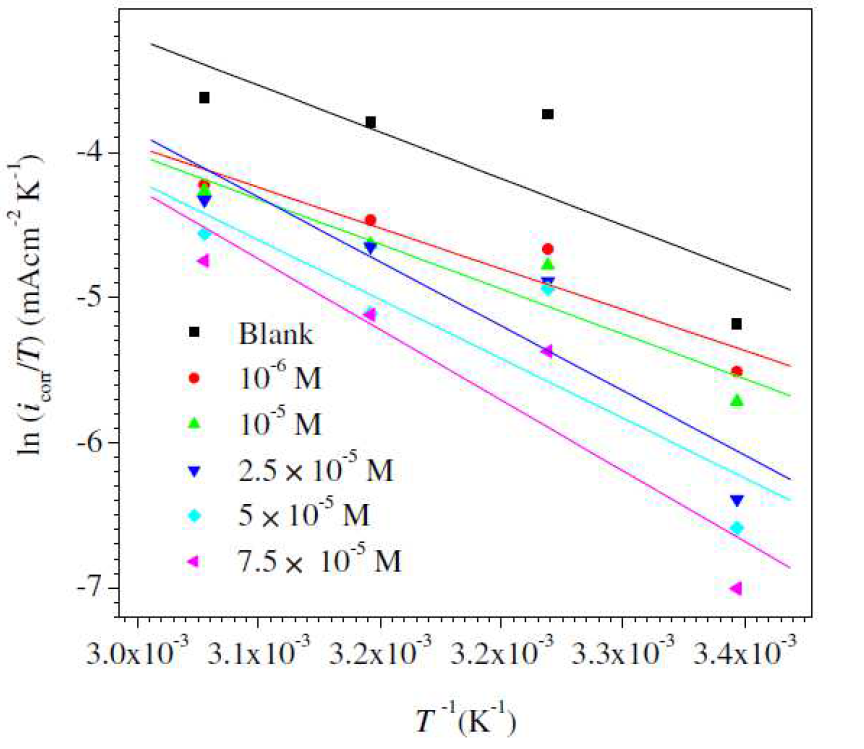
Figure 7 Arrhenius plots for mild steel in 1 M HCl, without and with L1, with different concentrations.
Adsorption isotherms
The mode and degree of interaction between an inhibitor and a metal surface have been extensively studied by the application of adsorption isotherms. The adsorption of an organic molecule occurs because the interaction energy between an inhibitor and a metal surface is greater than that between the water molecules and a metal surface [82]. To find the adsorption isotherms, the degree of surface coverage (θ) was determined as a function of the inhibitor concentration. The θ data were then plotted to fit the greatest appropriated adsorption model [83, 84]. Fig. 8 presents the dependency of the Cinh/θ relationship as a function of the corrosion inhibitor concentration (Cinh) for L1. Graphs yielded a good fitting with a correlation factor of 0.99, which indicates that the compound under study obeyed an adsorption isotherm of the Langmuir kind:
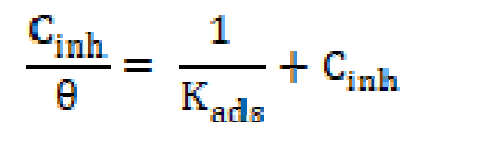
where Cinh is the inhibitor concentration, in the test solution total volume and Kads is the equilibrium adsorption constant complexed in a chemical reaction. Some authors have correlated the Langmuir isotherm with the contact of adsorbed species with the metallic surface [85, 86]. Data trend indicates that inhibitory molecules are adsorbed onto the metal surface to form a film that insulates it the from the corrosive environment. Kads values decreased as temperature increased (Table 8), which indicates the presence of a rearrangement and a detachment of the corrosion inhibitor molecules from the metallic surface, with a consequent decay in the inhibitor efficiency. The adsorption equilibrium constant (Kads) is related to the standard free energy of adsorption (- ∆Gº ads), as shown in equation (9) [59, 87].

where R is the gas constant (8.314 J K-1 mol-1), T is the absolute temperature (K), and the 55.5 value is the water concentration in a solution, expressed in M [87].
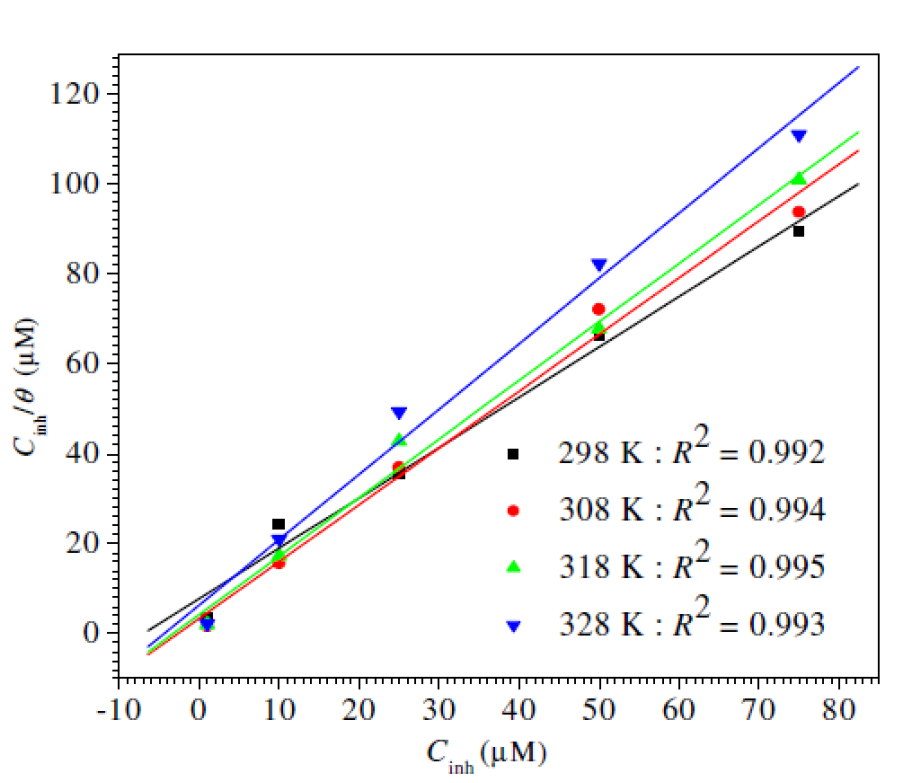
Figure 8 Langmuir adsorption plots for mild steel in 1 M HCl containing a Schiff base compound, with different concentrations, at various temperatures (from 298 K to 328 K).
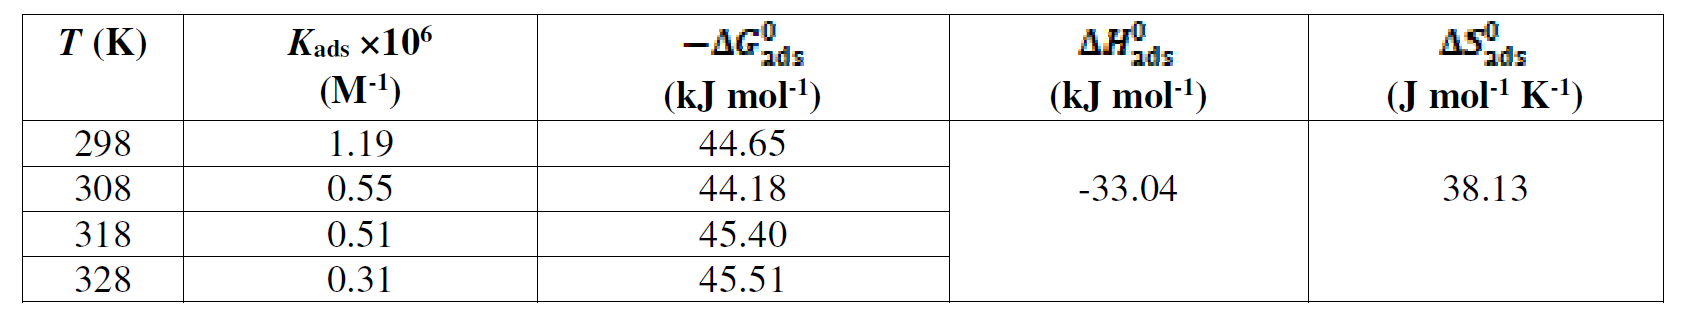
The -∆Gº ads values are also given in Table 8. The negative -∆Gº ads values indicate that the inhibitor molecule adsorption onto the steel surface is a spontaneous process. Generally, -∆Gº ads values up to -20 kJ mol-1 are consistent with the electrostatic interaction between the charged molecules and the charged metal (physical adsorption), while those more negative than -40 kJ mol-1 involve sharing or transfer of electrons from the inhibitor molecules to the metal surface, to form a coordinate type of bond (chemisorption) [58, 88]. In the present study, calculated ∆Gº ads values (between 44.18 and 45.51 kJ mol-1) indicate that the adsorption mechanism of the prepared cationic surfactants on mild steel in a 1 M HCl solution is chemical adsorption [89].
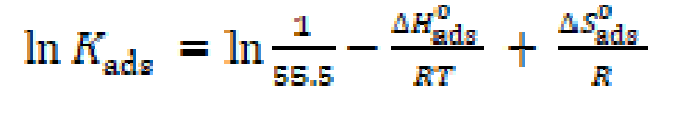
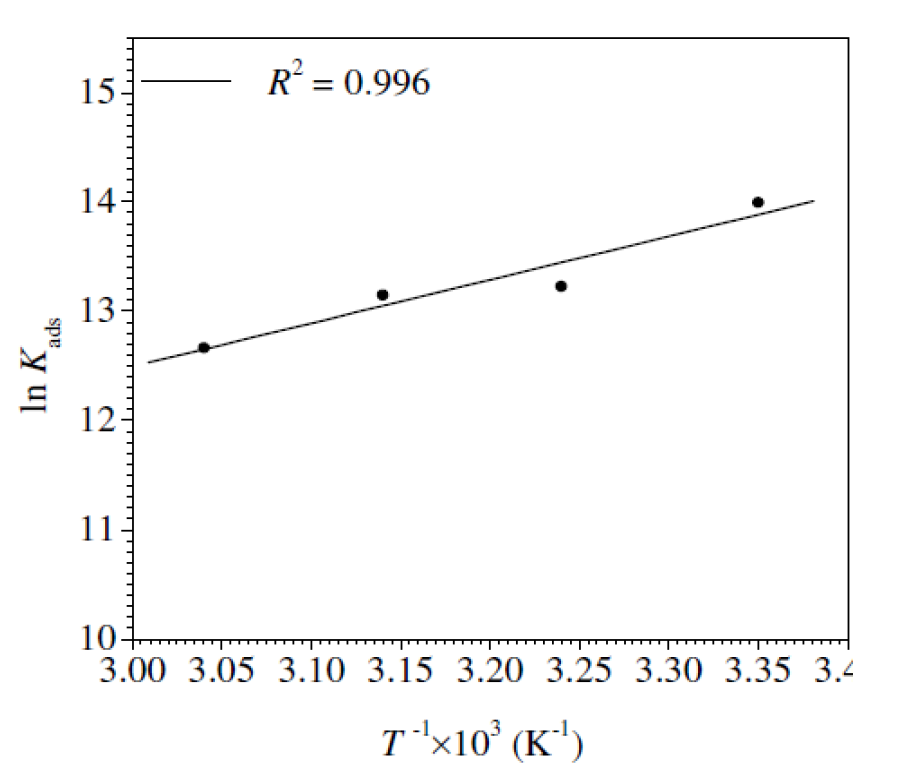
Thermodynamic parameters are important to further understand the inhibitor adsorption process onto the steel/solution interface. The standard adsorption enthalpy (AH0 ads) could be calculated on the basis of the Van’t Hoff equation (10).
 (10)
(10)
Fig. 9 represents the In Kads plots versus  for L1 adsorption, in a hydrochloric acid solution. The obtained lines represent a good linear relationship (the linear correlation coefficient is 0.996, with a slope of (
 ) and an intercept of
 . Kads,
  and
and  values are listed in Table 8. The distinction between physisorption and chemisorption is based on
  absolute value. For a physisorption process, the enthalpy of adsorption should be equal to or lower than 40 kJ mol-1; while, for chemisorption, it should be equal to or higher than 100 kJ mol-1 [90-92]. The calculated value for L1 is lower than 40 kJ mol-1. Based on these results, it is apparent that the L1 adsorption mode onto the metal surface is, essentially, physisorption [93]. The negative value
  for L1 implies that the orderliness caused by this molecule adsorption onto the metal surface is greater than the randomness created by water desorption [94-96].
Table 8 Standard thermodynamic parameters of L1 adsorption onto the X48 mild steel surface, in a 1 M HCl solution, at different temperatures.
| T (K) | K ads ×106 (M-1) |
 (kJ mol-1) (kJ mol-1) |
 (kJ mol
-1
) (kJ mol
-1
)
|
 (J mol
-1
K
-1
) (J mol
-1
K
-1
)
|
|---|---|---|---|---|
| 298 | 1.19 | 44.65 | -33.04 | 38.13 |
| 308 | 0.55 | 44.18 | ||
| 318 | 0.51 | 45.40 | ||
| 328 | 0.31 | 45.51 |
Surface characterization
SEM pictures of the X48 surface were performed to examine the morphology before and after the inhibition process (Fig. 10).
Quantitative data on X48 surface roughness, with and without inhibitor, were not provided by SEM micrograph. Therefore, AFM was used for further study about the MS surface morphology. Fig. 11a-c shows different 2D and 3D images of X48 in various conditions. Fig. 11a shows that X48 surface roughness, before immersion, is 11.681 nm; but Fig. 11b shows that the corroded MS surface has a roughness of 124,332 nm. The X48 surface exposed to the blank solution shows a bumpy structure, with a large number of vicissitudes, due to acid attack. Fig. 11c shows that, with the inhibitor addition to the acidic solution, the MS surface morphology changed, due to the creation of an adsorbed protective film [98, 99], causing a decrease in 74.431 nm of the average surface unevenness.
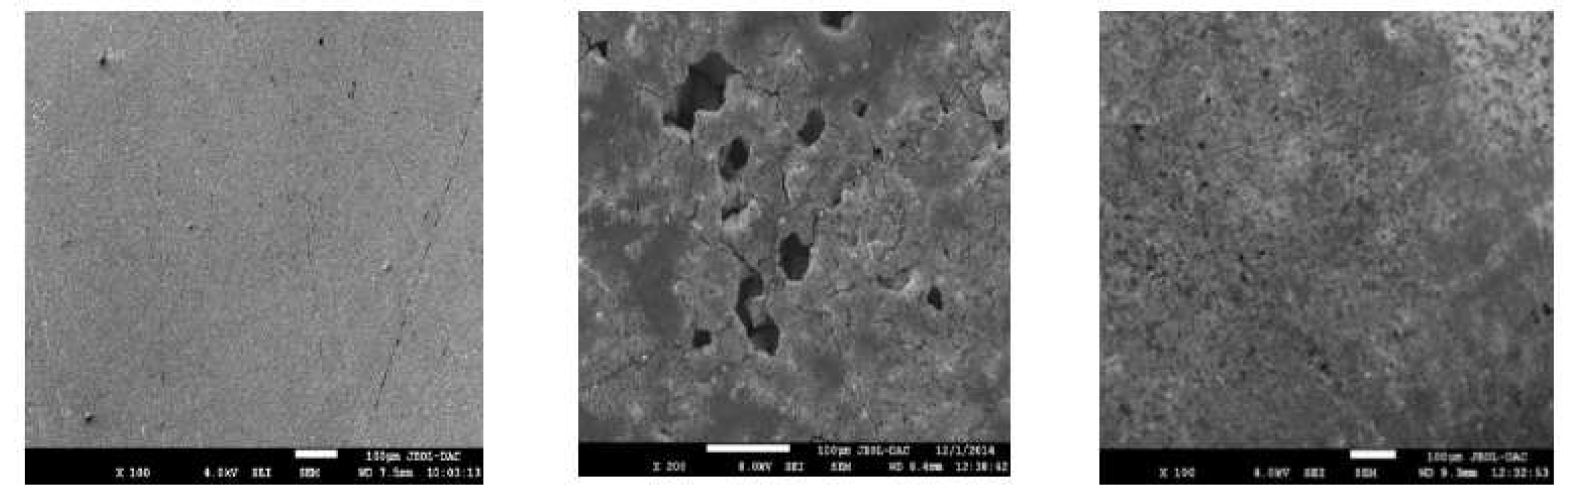
Figure 10 SEM pictures of X48 mild steel samples, at ambient temperature: (a) abraded without immersion in test solutions; (b) after 24 h immersion in 1 M HCl withou L1; (c) after 24 h immersion in 1 M HCl containing 7.5 10-5 M of L1.
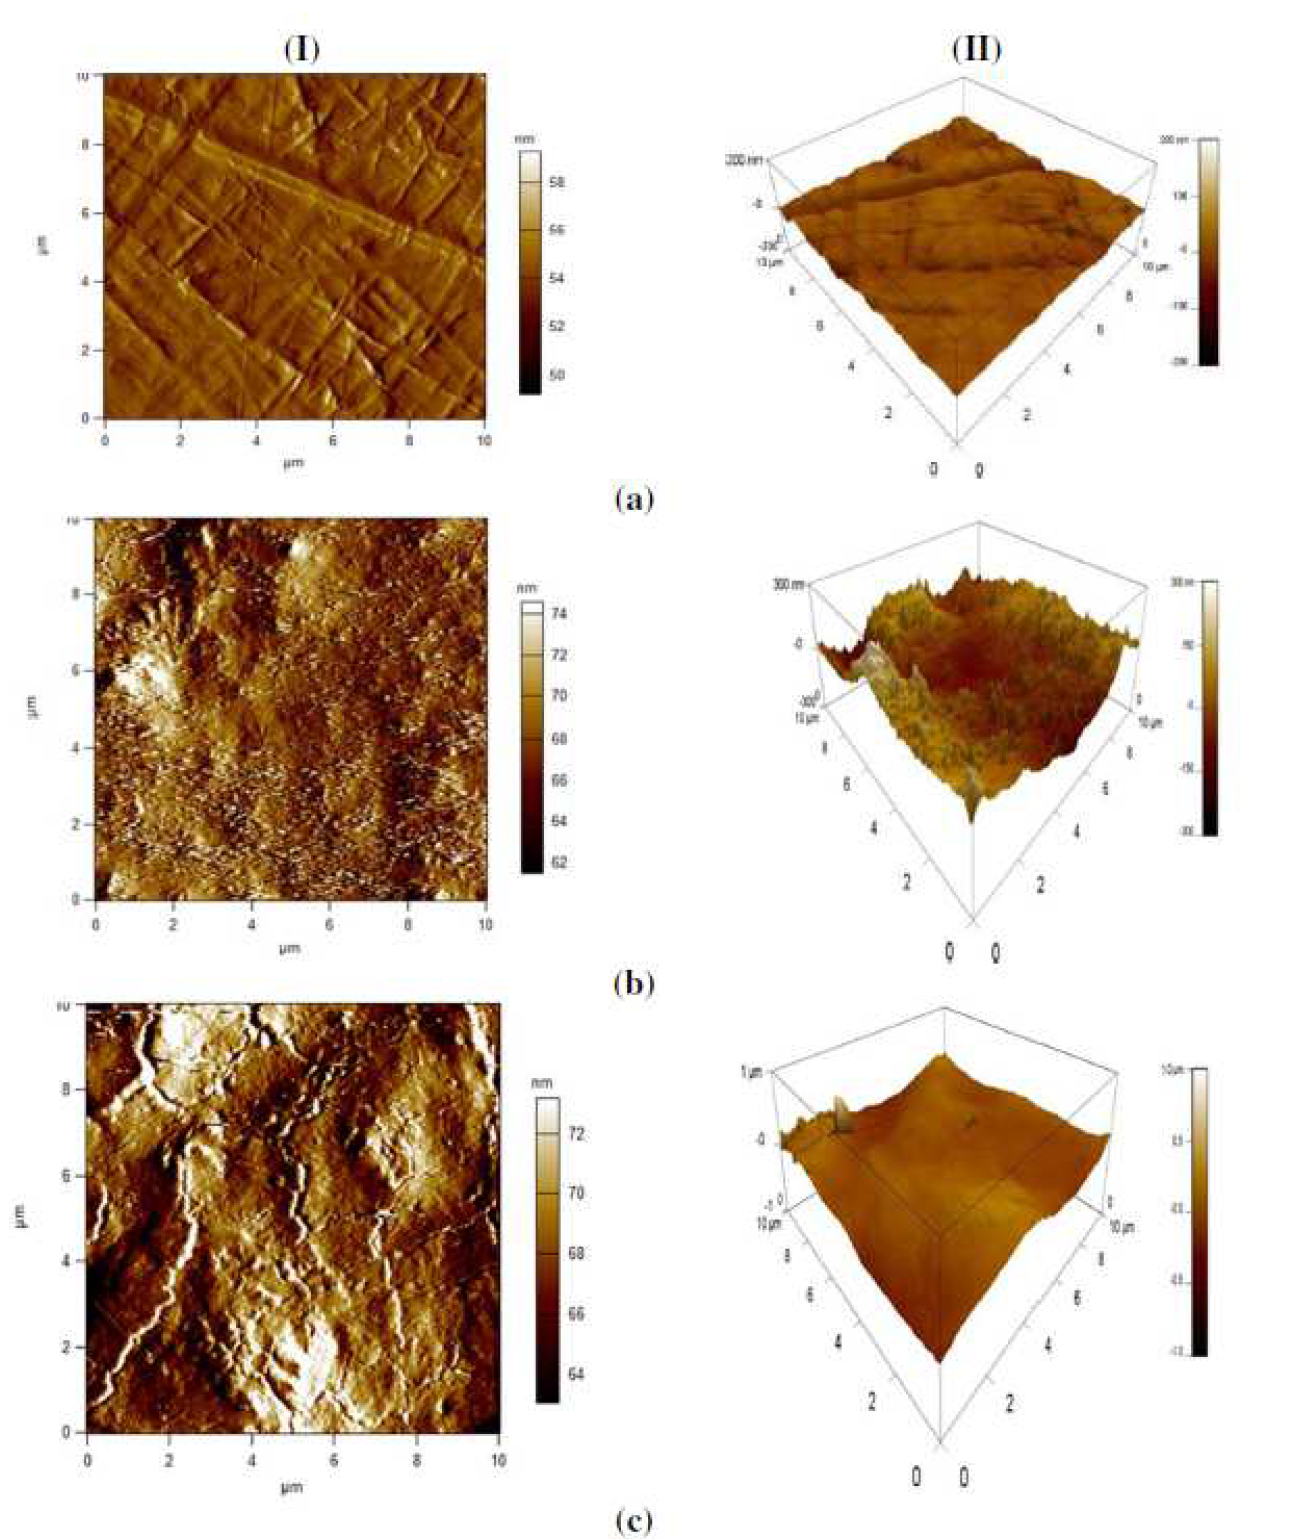
Figure 11 2D (I) and 3D (II) AFM pictures of X48 mild steel samples, at ambient temperature: (a) abraded without immersion in test solutions; (b) after 24h immersion in 1 M HCl, in the inhibitor absence; (c) after 24 h immersion in 1 M HCl containing 7.5  10-5 M of L1 .
Theoretical study
DFT calculations
Density Functional Theory is certainly the most extensively utilized approach for the design and development of organic inhibitors in the corrosion field. It is worthy of note that this computational method has become very popular in the study of the correlation between molecular structure and corrosion inhibition effect [100]. Interactions of the inhibitor molecule with the metal surface may be involved in the application of the frontier molecular orbital theory. According to this approach, the chemical reactivity of the reactive species is mostly related to the frontier molecular orbitals (FMOs). The study of the highest occupied molecular orbital (HOMO) and the lowest unoccupied molecular orbital (LUMO) is very important in the prediction of the molecules chemical reactivity. The frontier molecular orbital density distributions are shown in Fig. 12.
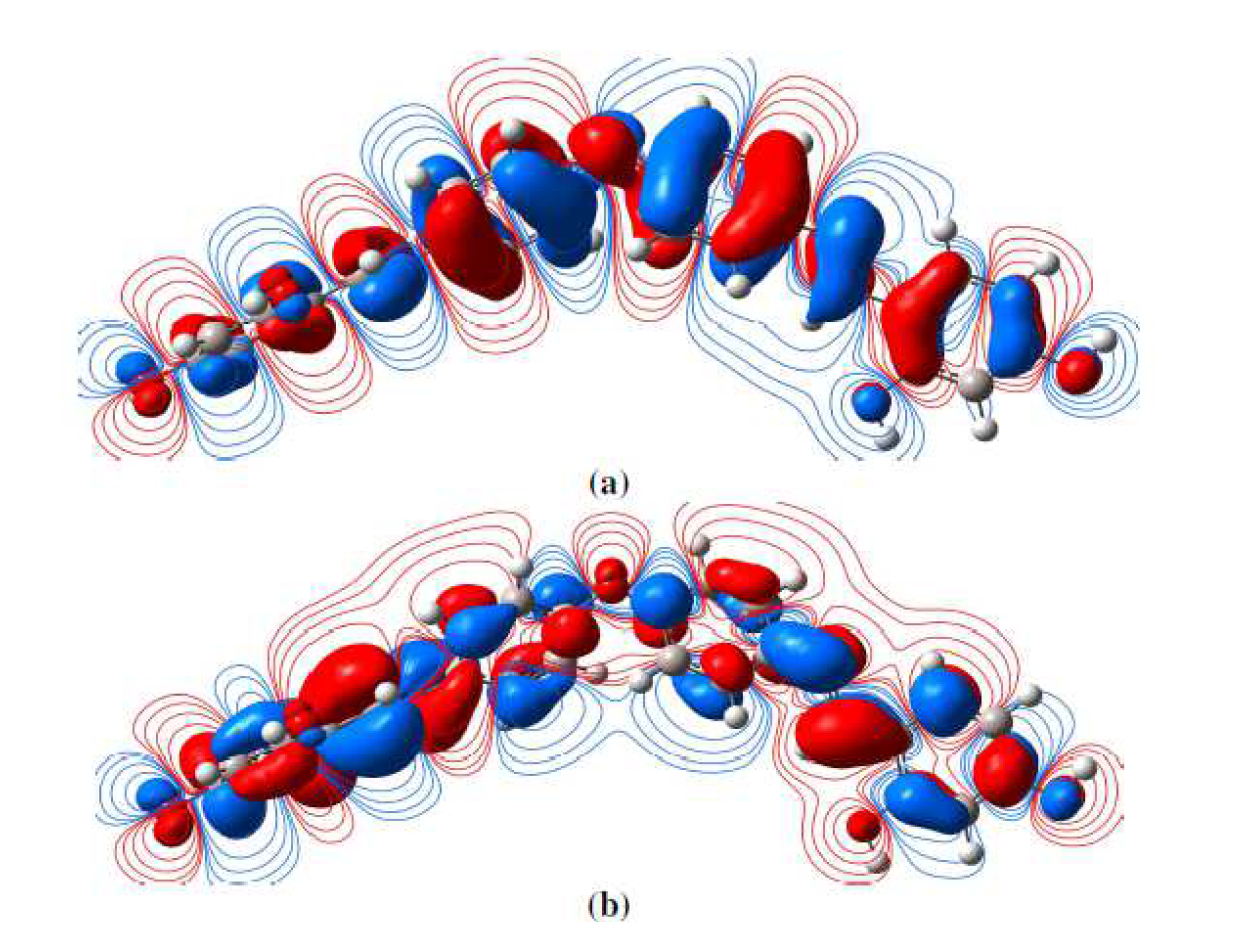
Figure 12 L1 frontier molecular orbital density distributions: (a) HOMO and (b) LUMO, calculated at the B3LYP/6-31G (d, p) level.
The quantum chemical parameters of the examined inhibitor (L1), obtained by DFT, such as the energy of the Highest Occupied Molecular Orbital (EHOMO), the energy of the Lowest Unoccupied Molecular Orbital (ELUMO), the gap energy (∆Egap= ELUMO-EHOMO) and the dipole moment (µ), are summarized in Table 9. The HOMO mainly dispersed around the oxygen atoms and nitrogen atoms and benzene rings, whereas the LUMO was mostly localized around nitrogen atoms and benzene rings. Thus, the benzene rings and N atoms acted as the active centers, donating electrons to the empty Fe d-orbital, to form coordination bonds [101]. The higher EHOMO value indicates a tendency of the molecule to donate electrons to suitable acceptor molecules with low molecular orbital energy. Thus, inhibitor compounds with a higher EHOMO value help in a better adsorption, and act as good inhibitors. Inversely, the LUMO energy (ELUMO) indicates the molecule electron accepting ability; the lowest is its value, the higher is the competence to accept electrons. As it can be observed from Table 9, EHOMO = -6.35 eV and ELUMO = 0.61 eV, which are in a good correlation between the energy of the frontier molecular orbitals (FMOs) and the inhibition efficiency. The LUMO-HOMO energy gap (∆Egap) is a fundamental parameter widely utilized to describe the inhibitor molecules chemical reactivity across the adsorption onto the steel surface. In this way, a low ∆Egap value easily causes a strong chemical change at the inhibitor/steel interface; thus, the molecule adsorption onto the metal surface is much easier [102]. According to our results, it is clear that the L1 protonated form (∆Egap = 0.35 eV) could more strongly adsorb onto the metallic surface than the neutral form (∆Egap = 6.96 eV). Another important electronic factor considered in the corrosion inhibition study is the dipole moment (µ). The dipole moment represents the non-uniform distribution of charges on the different atoms in a molecule, which is utilized in the estimation of intermolecular interactions force. A high µ value may increase the inhibitor adsorption through electronic strength [102]. In the present study (Table 9), L1 has a quite high µ value (3.65 D), compared with that of the H2O dipole moment (1.88 Debye), which shows strong dipole-dipole interactions between the inhibitor molecules and the metallic surface.
Table 9 Schiff base compound quantum chemical parameters calculated using the DFT method, at the B3LYP/6-31G (d, p) basis set.
| Quantum parameters | L1 | H2L1 |
|---|---|---|
| E HOMO (eV) | -6.35 | -2.69 |
| E LUMO (eV) | 0.61 | -2.34 |
| ΔE (E LUMO - E HOMO ) (eV) | 6.96 | 0.35 |
| Dipole moment µ (D) | 3.65 | 2.64 |
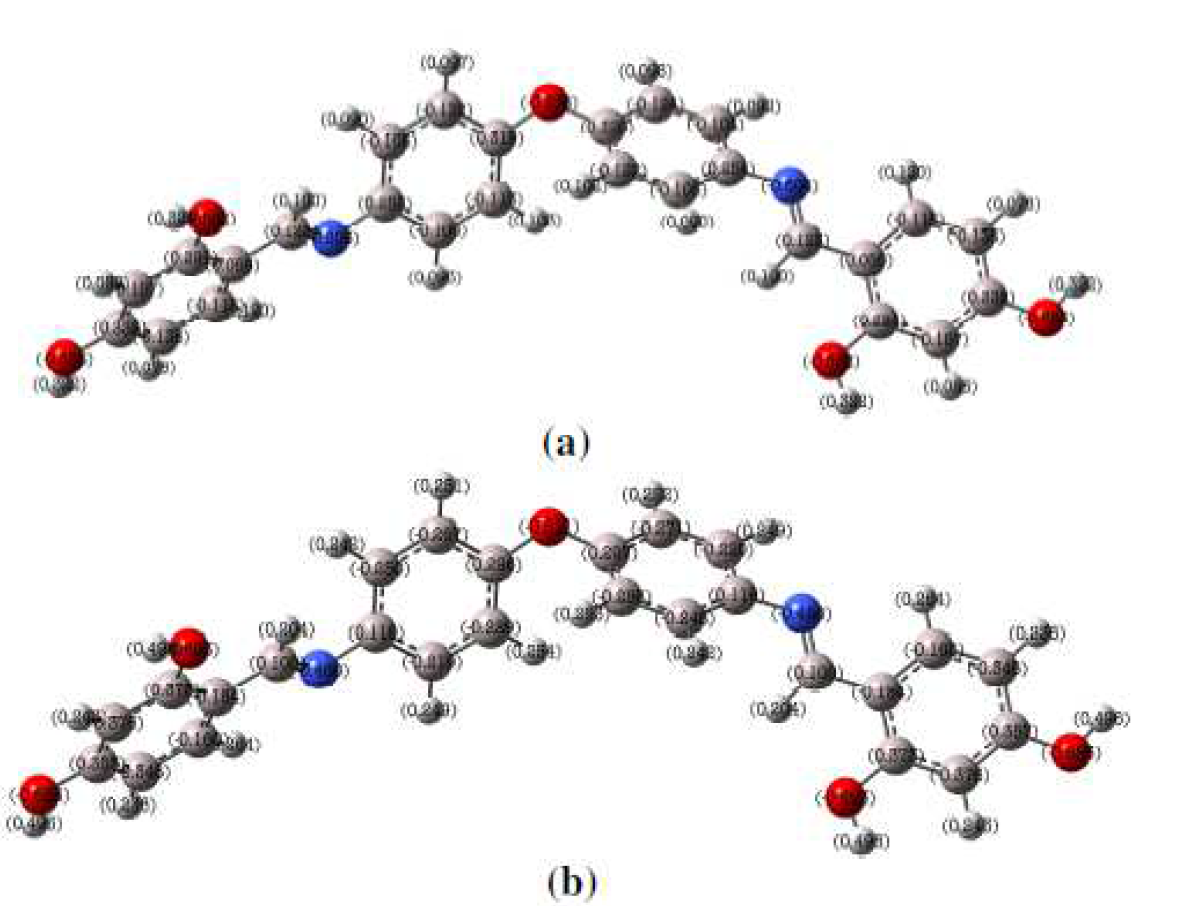
Figure 13 L1 optimized structure of the inhibitor (L1) with (a) Mulliken charges and (b) NBO charges calculated at the B3LYP/6-31 G (d, p) level.
It is clear, from Fig. 13, that the Mullikan charges for the examined compound show that the electronegative centers in the molecules are mainly located around heteroatoms (oxygen and nitrogen atoms) and some atoms of benzene rings. These sites with improved electron clouds donate electrons to metal atoms, through the adsorption process. Natural bonding orbitals (NBO) investigation offers an important approach to the study of intra and intermolecular attachment and interaction among bonds [103]. To study the interactions between the solid orbitals of one subsystem and the vacant orbitals of another system, the NBO values are calculated and presented in Fig. 13.
L1 nitrogen and oxygen atoms and also some carbon atoms have negative charges, which are the most preferred positions for the linking to the mild steel surface through contributing electrons. However, some other carbon atoms (positive charges) can receive the electrons from metal.
Molecular electrostatic potential (MEP) is related to the electronic density, and it is a very suitable factor for understanding positions for electrophilic attack and nucleophilic reactions. L1 contour and total electron density surface mapped with molecular electrostatic potential (MEP) are presented in Fig. 14. MEP negative (red) areas are related to nucleophilic reactivity, and the positive (blue) areas to electrophilic reactivity. It is clear that more electron rich regions are mainly situated nearby heteroatoms and conjugated double bonds. As noticed, the formation of a chelate on the mild steel surface, by the transference of ring electrons from benzene groups to the iron atom orbital d, originates a covalent bond coordinated by chemical adsorption. In this way, mild steel action as an electrophile is likely to attract the inhibitory molecule negatively charged sites, and L1 nucleophilic centers are normally heteroatoms with free electron pairs, functional electronegative groups and π-electrons in the conjugated double bonds, which are readily available to form chemical bonds.
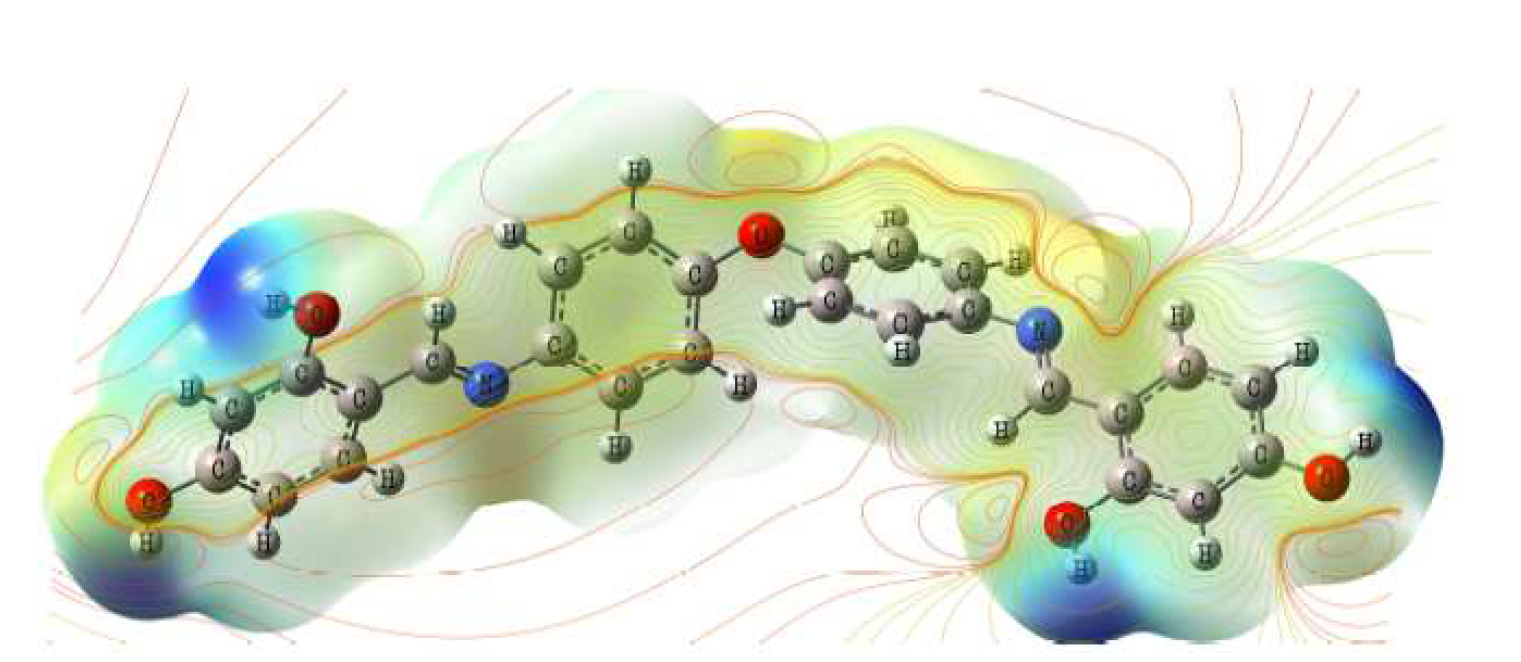
Figure 14 L1 contour map of molecular electrostatic potential (MEP) calculated at B3LYP/6-31G (d, p) level for the compound.
Molecular dynamics simulations
Molecular dynamics simulations were performed to study L1 adsorption behavior onto the Fe (1 1 0) surface. Among the three iron surface types, Fe (1 1 0), Fe (1 1 1) and Fe (1 0 0), the last two have relatively open structures, while Fe (1 1 0) surface has a more stable shape with a packed density [104, 105]. The total energy, Vander Waals energy, average total energy, electrostatic energy and intermolecular energy, for the L1-Fe (1 1 0) systems under study, were calculated by adsorption locator module, and are given in Fig. 15. The total energy is defined as the sum of the energies of the adsorbed molecules, namely the rigid adsorption energy and the deformation energy. In this study, the adsorption energy shows the released (or necessary) energy when the relaxed inhibitor molecules are adsorbed onto the metal surface. The contact between the inhibitor molecules (L1) and the iron surface, as well as the best adsorption configuration for that compound, are shown in Fig. 16.
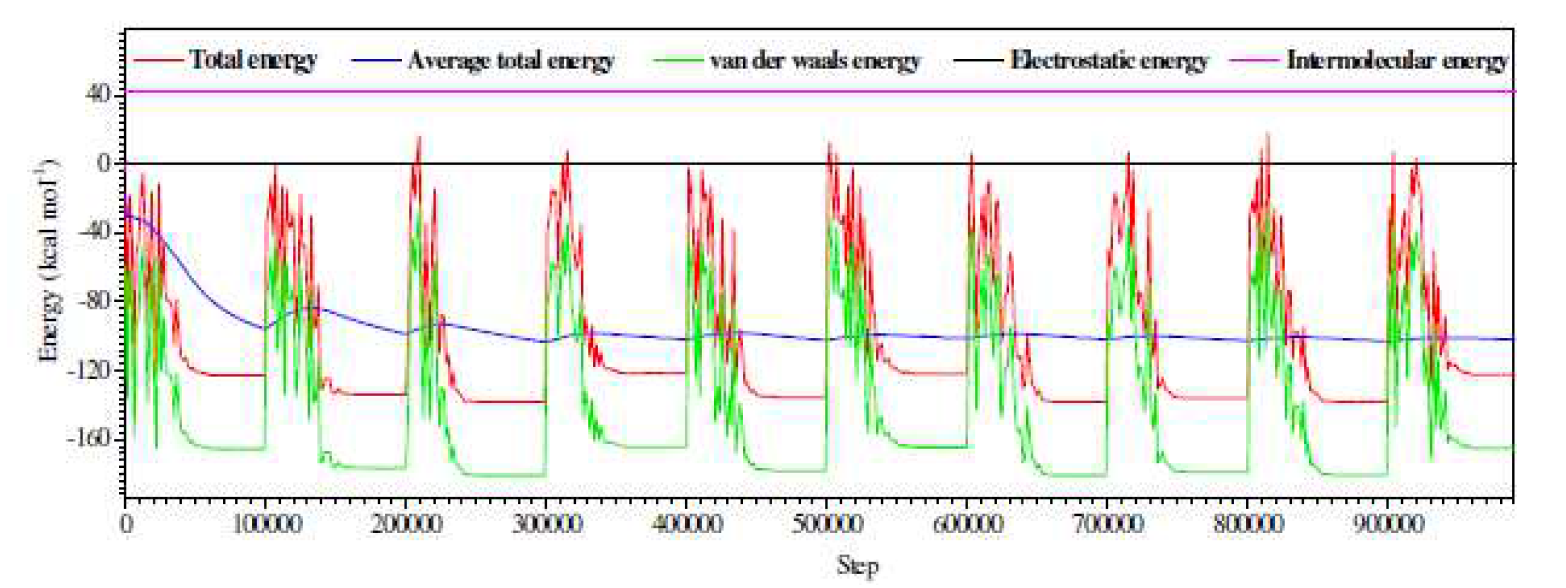
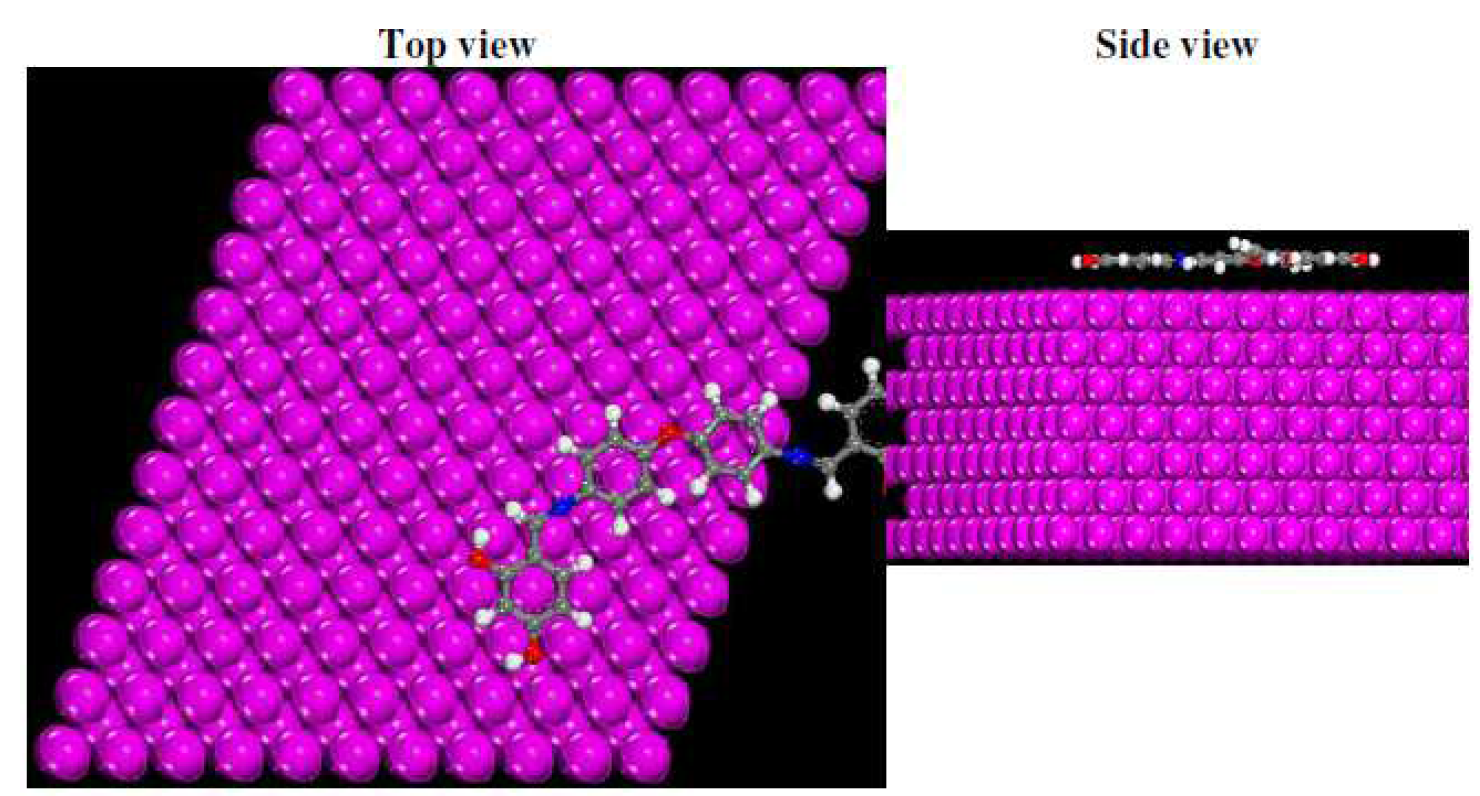
Figure 16 L1 equilibrium adsorption configurations on Fe (1 1 0) surface, obtained by molecular dynamic simulations.
It is clearly seen from Fig. 16 that the inhibitor molecules adsorb onto the Fe (1 1 0) surface with, practically, a parallel disposition between the rigid molecular structure and the metal surface, confirming the great contact between the inhibitor molecule and Fe atoms, by creating a protective film on the Fe (1 1 0) area.
The simulation parameters are shown in Table 10. The large interaction energy negative value indicates that the interaction between the inhibitor molecules and the Fe surface is physically powerful. It is clear that the L1-Fe system has a large negative interaction energy (-349.08 kcal mol-1). In addition, it is important to note that the inhibitor molecules adsorption aptitude onto the Fe surface may be forecasted by the binding energy shown in Table 10.
Table 10 Outputs and descriptors calculated by the molecular dynamic simulations for L1 derivative adsorption onto the Fe (1 1 0) surface.
| System | Interaction energy (kcal mol-1) | Rigid adsorption energy (kcal mol-1) | Deformation energy (kcal mol-1) | Binding energy (kcal mol-1) |
|---|---|---|---|---|
| L1-Fe (1 1 0) | -349.08 | -236.96 | -112.12 | 349.08 |
The adsorption system (L1-Fe) binding energy is 349.08 kcal mol-1, which shows that this system is very stable, and that it has high inhibitory efficiency. According to the quantum chemistry study, the tested oxygen and nitrogen atoms can give electrons to the unoccupied "d" iron orbital, to form coordination bonds, while the aromatic rings π orbital can accept electrons from the "d" iron orbital, to form coordination bonds.
Conclusions
The obtained results allowed us to conclude that:
the work done on the Schiff base (L1) revealed that it acts as a good corrosion inhibitor. Its inhibitory power increased with higher concentrations, reaching a maximum values of 92.19 % (gravimetric), 83.83 % (polarization curves) and 88.65 % (EIS), at 7.5×10⁻⁵ M;
potentiodynamic polarization curves show that the tested compound is a mixed-type inhibitor with, predominantly, cathodic inhibition, with higher concentrations;
corrosion rate decreases with higher inhibitor concentrations;
the electrochemical impedance spectroscopy diagrams are in the form of an individual capacitive loop. This inhibitor addition to a 1 M HCl medium increases the charge transfer resistance, while it reduces the double layer capacity. This result can be attributed to the increase in the thickness of the electric double layer;
the action of this organic compound is based on a mechanism of simple adsorption onto the mild steel surface, thus blocking the active sites and, therefore, decreasing the corrosion rate. This adsorption onto the metal surface led to the formation of a monolayer, according to the Langmuir isotherm, in the studied temperature range;
the comparison of the results obtained through the used weighting and electrochemistry methods shows a satisfactory agreement of these results;
the morphology study of the X48 mild steel surface, in the inhibitor absence and presence, by scanning electron microscopy (SEM) and atomic force microscopy (AFM), shows the presence of a protective and adherent layer on the metal surface, which limits the penetration by the electrolyte;
and the theoretical calculations are in good agreement with the experimental results; they show that these heterocyclic derivatives have interesting molecular structures for the corrosive process inhibition.

