Introduction
Hydrochloric acid solutions are used in industrial processes during metals and alloys pickling and cleaning, causing significant metal loss [1, 2]. The metal damage by a chemical attack or reaction with its environment is known as corrosion. Recently, research has concentrated on the use of ecologically acceptable compounds, such as essential oils or plant extracts [3]. Essential oils are used as corrosion inhibitors, due to their functional groups that form complexes with metal ions. On the metal surface, these complexes occupy a large specific surface area, thus covering and protecting it from corrosive agents present in the solution. The vast majority of metals and alloys used in different human activities are sensitive to different corrosion mechanisms, due to their exposure to different aggressive environments. For this purpose, mild steel (MS) is very important. One of the methods used to reduce the metals corrosion rate is the inhibitors addition. Numerous studies have been conducted to find compounds that can be used as corrosion inhibitors of this metal in different aqueous environments [4].
The Thymus genus belongs to the Lamiaceae family, comprising about 215 species native to the Mediterranean basin. This family, in particular the Thymus genus, is rich not only in essential oils, but also in phenolic compounds, tannins, flavonoids, glycolysed iridoids, quinones, coumarins, terpenoids, saponins and in some cases, pyridines and pyrrolidine alkaloids, which gives it economic and therapeutic importance [5]. Their antioxidant and antimicrobial properties are the key to many applications in processed foods conservation, alternative medicine, pharmaceuticals and natural therapies [6]. In the same way, Thymus essential oils are classified among the most powerful antimicrobial active plants, due to their high activity, particularly against pathogenic antibiotic-resistant microorganisms [7, 8]. This potent antimicrobial activity is attributed to phenolic components, such as thymol and carvacrol [9, 10]. Indeed, Thymus oils are generally characterized by a high content of thymol and of its carvacrol isomer [11], accompanied by a range of other more or less biologically active compounds, including eugenol, p-cymene, α-terpinene and linalool [12].
Thymus willdenowii Boiss and Reut essential oil (TW) is perennial, fragrant, with inflorescences in false whorls, a tubular calyx bell with 10 ribs and with 10-30 cm in height. The small grey-green leaves are opposite, oblong-lanceolate to linear, 6-10 mm long and 1-2.5 mm wide, and gland-dotted. Their margins are recurved. The flowers are light violet, two-lipped [13]. The TW essential oil chemical composition is rich in oxygenated monoterpenes that are mostly represented by a high level of camphor (24.99%) [14]. It is reported that the Thymus genus has many biological activities, such as antibacterial [15, 16], antifungal [16-18], insecticide [19, 20] and antioxidant activities [21].
In the present study, the TW essential oil inhibitive effect on mild steel corrosion in 1 M HCl was investigated. For this purpose, the study of corrosion parameters was performed by weight loss, electrochemical polarization measurements and electrochemical impedance spectroscopy. The metal surface morphology and the coatings composition were characterized by scanning electron microscopy, energy dispersive spectroscopy (SEM-EDX) and three-dimensional profilometry.
Experimental section
Essential oil
The studied essential oil was collected from Khenifra (Morocco), and analyzed as described in our previous study [22].
Materials preparation
The samples used in this survey were cylindrical discs cut from a MS rod with the following composition: 0.1 wt.% (P), 0.38 wt.% (Si), 0.02 wt.% (Al), 0.05 wt.% (Mn), 0.25 wt.% (C), 0.07 wt.% (S) and the remainder iron (Fe), and they were used to measure weight loss. The disc was fixed with silicone on a plastic tube as a support, leaving the surface exposed to the corrosive electrolyte. The MS surface was prepared with emery papers, by increasing the grains size (800, 1200 and 2000 grains), rinsed with double-distilled water, degreased with acetone in an ultrasonic bath for 5 min, washed again with double-distilled water and then dried with warm air before use. The 1 M HCl aggressive solutions were prepared by diluting 37% grade analytical HCl with double-distilled water. The TW concentration range was from 0.5 to 3 g/L. This concentration range has been chosen according to the maximum TW solubility.
Weight loss measurements
Weight loss measurements were performed in total immersion under stagnant aeration conditions, using 250 mL beakers with 100 mL HCl (1 M), with and without different TW concentrations ranging from 0.5 to 3 g/L, at a temperature of 298 K. After 6 h of immersion, MS was carefully washed in double-distilled water, dried and weighed. The rinsing removed the detached segments of the film from the corroded samples. Triplicate experiments were performed in each case, and the mean value of weight loss was reported using an analytical balance (accuracy ± 0.0001 mg). The weight loss enabled us to calculate the average corrosion rate. The corrosion rate (Wcorr) and inhibition efficiency, Ew (%), were calculated as stated in equations (1) and (2), respectively:
where △m (mg) is the sample weight before and after immersion in the tested solution, Wcorr and Wcorr(inh) are the weight losses values due to MS corrosion (mg/cm2.h) in uninhibited and inhibited solutions, respectively, s is the MS sample (cm2) surface and t represents the exposure time (h). The coverage surface degree was calculated using:
where θ represents the surface coverage, and Wcorr(inh) and Wcorr0 represent the steel corrosion rate in the inhibitor absence and presence, respectively.
Electrochemical studies
The electrochemical measurements were carried out in a single-compartment electrochemical cell designed for mounting different types of flat samples, for electrochemical tests, with a three-electrode system. The working electrode (WE), in the form of a 2.8 cm diameter disc, was embedded in polytetrafluoroethylene (PTFE). A saturated calomel electrode (SCE) and a platinum disc electrode were used as reference and auxiliary electrodes, respectively. The temperature was thermostatically controlled at 298 K.
Potentiodynamic polarization curves
Polarization curve studies were worked out using the EG&G Instruments potentiostat-galvanostat (model 273A), at 298 K, with and without TW oil (0.5‒3 g/L) in 1 M HCl, at a scanning rate of 0.5 mV/s. Before recording the cathodic polarization curves, the MS electrode was polarized at -800 Mv, for 10 min. For anodic curves, the electrode potential was scanned from its corrosion potential, after 30 min, to the free corrosion potential, at more positive values. The test solution was degassed with pure nitrogen. The experiments allowed the formation of gas bubbles to be maintained. The open circuit potential (OCP) was allowed to a stable state that was obtained after 1800s before electrochemical measurements were performed in the inhibitor (TW) absence and presence.
In the case of the polarization method, the relationship determines the inhibition efficiency (EW %):
where Icorr and Icorr(inh) represent the corrosion current densities in the TW absence and presence, respectively.
Electrochemical impedance spectroscopy (EIS)
OCP electrochemical measurements and EIS recording over time were worked out using an 273A EG&G potentiostat model controlled by CorrWarre software. The circular MS exposure surface (2.8 cm diameter) to the solution was used as a working electrode. After the steady state current at a given potential was determined, the peak to peak sine wave voltage (10 mV), at frequencies between 10-2 and 10000 Hz, was superimposed on the remaining potential. The computer programs checked the measurements made at rest potentials after 30, 60 and 90 min of exposure.
Impedance diagrams provided the Nyquist representation. Rt and Cdl values were obtained from Nyquist plots. The charge-transfer resistance (Rt) was measured from the impedance difference at low and high frequencies, as suggested by Tsuru et al. [23] The inhibition efficiency obtained from the charge transfer resistance was calculated according to the following equation (5):
where Rt and R´t represent the charge-transfer resistance values without and with inhibitor, respectively.
The double layer capacitance (Cdl) and the frequency at which the imaginary component of the impedance is maximal (-Zmax) are determined by equation (6):
Impedance diagrams were obtained for the frequency range from 10000- to 10-2 Hz, at the OCP for MS in 1 M HCl, in the inhibitor presence and absence.
Surface characterization
Scanning electron microscopy and energy dispersive X-rays (SEM-EDX)
The samples were immersed in 1 M HCl, in the absence and presence of TW oil optimum concentration, for 6h immersion. Then, they were removed, cleaned with double distilled water, dried and finally analyzed by SEM and EDX methods. The SEM study was carried out using a FEI Quanta 200, EDAX Metek New XL30 instrument, at an accelerating voltage of 20 kV.
Three-dimensional profilometry
Micrographs of the MS surface, before and after immersion in 1 M HCl with and without TW oil, were worked out by the micro-topographic method (3D). The surface characterization was performed by the high-resolution optical method, and controlled by the "Surface Map" profilometry software. This method is based on the use of an XY table, which moves over the surface to characterized it under a light pencil which sends a beam of white light onto the surface and analyses the beam reflected from it, by means of a confocal microscopy device equipped with a chromatic lens, allowing distances to be coded by the slow wavelength of the reflected light.
The analysis of the obtained micro-topographic was carried out using the "Mountain Map Universal" software, which allows a wide variety of data processing.
Results and discussion
Essential oil composition
To continuous our research on TW activities, we were interested in evaluating the anticorrosion activity of its essential oil. From our previous study, we found that the main compounds of the studied oil are thymol (43.4%), -terpinene (16.3%) and p-cymene (13.1%). Besides those, other constituents were detected in low concentrations, including linalol (3.8%), borneol (3.7%) and carvacrol (3.2%) [22].
Weight loss measurement
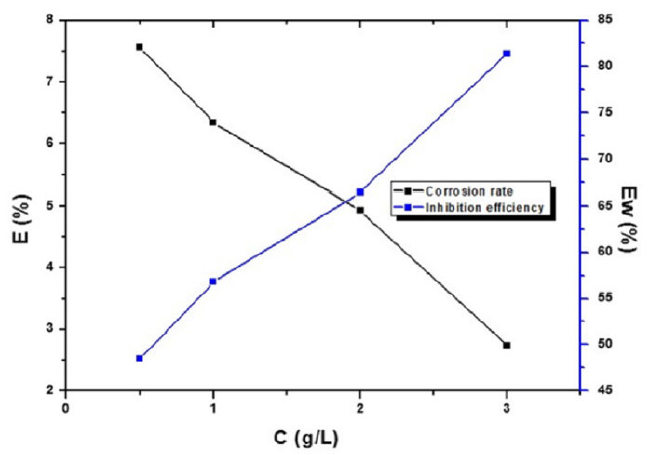
The effect of different TW concentrations on the MS corrosion in 1 M HCl was assessed by weight loss measurements, after 6h of immersion. The obtained inhibition efficiency EW (%) and corrosion rate (W) are represented in Table 1.
Table 1 Mild steel corrosion parameters in 1 M HCl, in the TW oil absence and presence, obtained from weight loss measurements, at 298 K.
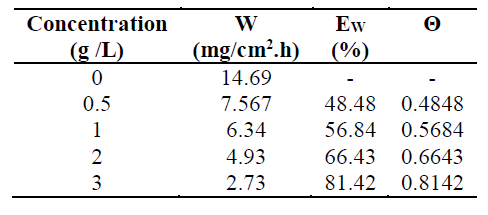
Table 1 regroups the steel weight loss results in 1 M HCl, in the absence and presence of different TW oil concentrations. It is very clear that the TW oil inhibited the MS corrosion in a 1M HCl solution, at all concentrations used in this study, and that the corrosion rate (W) decreased continuously with higher additive concentrations, at 298 K. Indeed, Fig. 1 shows that the MS corrosion rate values decreased with higher inhibitor concentrations, while TW oil Ew (%) values increased with higher concentrations, reaching a maximum value of 81.42%, at a concentration of 3g/L. This behavior can be attributed to the increase in the covered surface, θ (Ew%/100), and to the essential oil phytochemical components adsorption onto the MS surface, resulting in the reaction sites blocking, and MS surface protection from corrosion active ions attack in the acidic medium. Consequently, we can conclude that the TW oil is a good corrosion inhibitor for MS in 1 M HCl.
Adsorption isotherm and thermodynamic parameters
It is well known that the inhibitor adsorption process depends on its electronic characteristics, the nature of the metal surface, temperature, steric effects and different degrees of surface activity. In fact, the H2O solvent molecules could also be adsorbed at the metal/solution interface. In the aqueous solution, the inhibiting molecules adsorption can be considered as a quasi-substitution process between the aqueous phase inhibitor, Inh(sol), and the water molecules on the electrodes surface, H2O (ads) [24]
where x is the size ratio, that is, the number of water molecules replaced by an organic inhibitor.
To depict the inhibitor adsorption process onto the metal surface, adsorption isotherms were used. The adsorption isotherms from Frumkin, Temkin and Langmuir were used to describe the TW adsorption process onto the metal surface.
The Langmuir adsorption isotherm is associated to the chemisorption or physisorption phenomenon, while the Temkin adsorption isotherm explains the heterogeneity formed on the metal surface. Chemisorption is attributed to Temkin isotherm [25]. In this case, the adsorption isotherms of Langmuir, Frumkin and Temkin were applied to explain the TW oil adsorption process onto the MS surface:
where θ is the surface coverage, K is the adsorption-desorption equilibrium constant, Cinh is the inhibitor concentration and g is the adsorbate parameter.
The fraction dependence of the covered surface, θ (Ew/100), as a function of TW oil concentration (Cinh), has been adjusted graphically for these different adsorption isotherms.
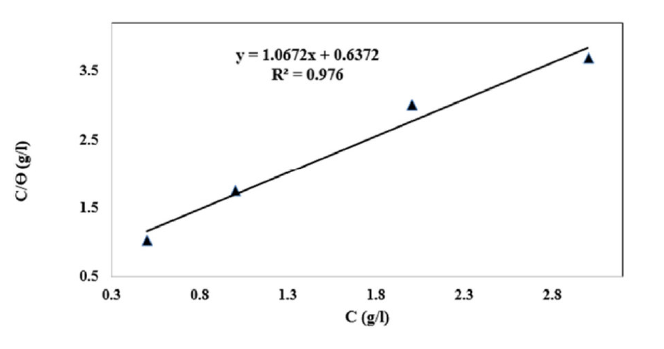
The linear regression parameters between C/θ and C are listed in Table 2, and the C/θ straight lines with respect to C in 1 M HCl, at 298 K, are shown in Fig. 2. It is evident that all linear correlation coefficients (R2) are equal to 1, and that the slope values are also close to 1, indicating that the TW oil adsorption onto the steel surface obeys the Langmuir isotherm. This result shows that the adsorbed molecules occupied only one site and that there were no interactions with other adsorbed species [26].
Table 2 TW oil adsorption thermodynamic parameters onto mild steel in 1 M HCl, at 298 K, from Langmuir adsorption isotherm.

The adsorbed inhibitor tends to desorb from the steel surface. In general, a high K value is related to a better inhibitory efficiency of a given inhibitor. This is in accordance with the Ew values obtained from Fig. 2.
The thermodynamic parameters are important to better understand the inhibitor adsorption process on the steel/solution interface. The equilibrium adsorption constant, K, is related to the standard Gibb’s free adsorption energy (ΔG°ads), with the following equation:
where R represents the universal gas constant, T is the thermodynamic temperature, and the 55.5 value is the water concentration in the solution (103 g/L).
The high correlation (R2 = 0.976) for part of the Langmuir isothermal inhibitor field confirms the validity of this approach.
The ΔG°ads negative values suggest that the inhibiting molecules adsorption onto the steel surface was a spontaneous phenomenon (Table 2). It is well known that ΔG°ads values around -20 kJ.mol-1 or less are associated with the physiosorption phenomenon, where electrostatic interaction occurs between the charged molecule and the charged metal, while those around -40 KJ.mol-1 or more are associated with the chemisorption phenomenon, where the sharing or transfer of organic molecules charges at the metal surface take place [3]. In this study, the ΔG°ads value, calculated and shown in Table 2, supports the TW oil physisorption onto mild steel.
Open circuit potential
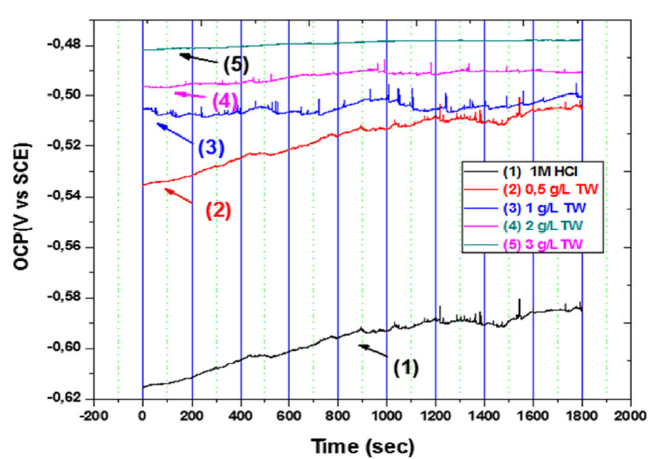
The open circuit potential (OCP) variation with time, for MS in 1 M HCl, without and with the addition of different TW oil concentrations, is shown in Fig. 3. It can be observed from the figure that stable OCP values were obtained after 1800 s immersion, both in the inhibitor absence and presence. It is also observed that, after the TW oil introduction into the corrosive medium, the potential shifts to nobler values than those observed in the blank acidic solution. It was found that the positive displacement of the corrosion potential was dependent on the TW concentration. This suggests a possible TW oil influence on both anodic and cathodic polarization.
Potentiodynamic polarization curves
The polarization curves of MS specimens in 1 M HCl, in the absence and presence of different TW essential oil concentrations, at 298 K, are brought together in Fig. 4. The respective kinetic parameters, including corrosion current density (Icorr), corrosion potential (Ecorr), cathodic slopes (βc) and inhibition efficiency (EW%), are given in Table 3. It can be observed from Table 3 that Icorr decreases considerably with higher inhibitor concentrations. Correspondingly, the inhibition efficiency (EW %) increases with higher inhibitor concentrations, to reach its maximum value, 83.57%, at 3 g/L. This behavior suggests that the TW oil adsorptive protective film, formed onto the carbon steel surface, tends to be increasingly complete and stable. The maximum displacement value (Ecorr) is 69 mV, suggesting that the TW oil act as mixed type inhibitor [27].
Fig. 4 represents the MS polarization curves, in the TW oil absence and presence in 1 M HCl, at 298K. From the polarization curves analysis, it was revealed that the TW oil addition has an inhibitive effect on both anodic and cathodic parts of the polarization curves.
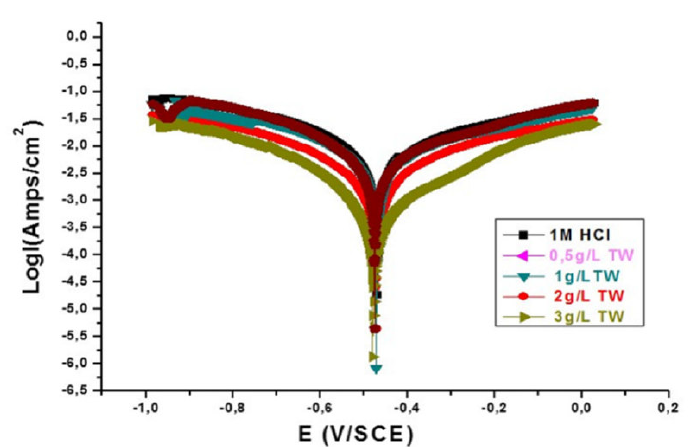
Figure 4 MS anodic and cathodic polarization curves in 1 M HCl, in the TW absence and in its presence, at different concentrations.
This indicates a change in the cathodic hydrogen evolution mechanism, as well as steel anodic dissolution, suggesting that the inhibitor strongly inhibits the MS corrosion process, and that its capacity as a corrosion inhibitor is improved as its concentration increases. In addition, the cathodic Tafel slope values, βc, in the inhibitor presence, change significantly with the TW concentration, indicating its influence on cathodic reactions, and modifying the hydrogen reaction mechanism.
Electrochemical impedance spectroscopy (EIS)
The MS corrosion behavior in 1 M HCl, in the TW oil presence, was investigated by EIS, at 298 K, after an exposure period of 30, 60 and 90 min. The MS Nyquist curves obtained in the TW oil absence and in its presence, at different concentrations, are given in Figs. 5, 6 and 7.
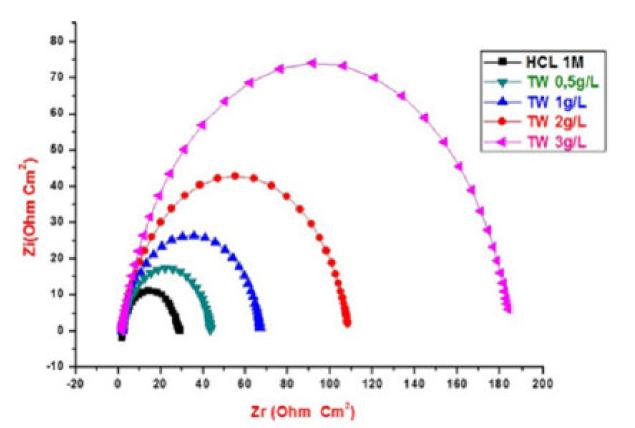
Figure 5 Nyquist diagrams for MS without and with TW, after 30 min of immersion in 1 M HCl, at various concentrations.
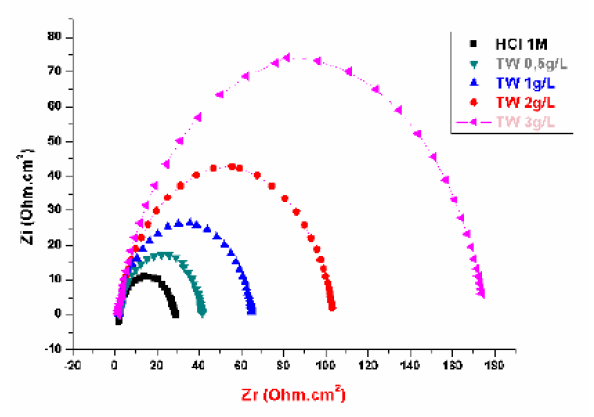
Figure 6 Nyquist diagrams for MS without and with TW, after 60 min of immersion in 1 M HCl, at various concentrations.
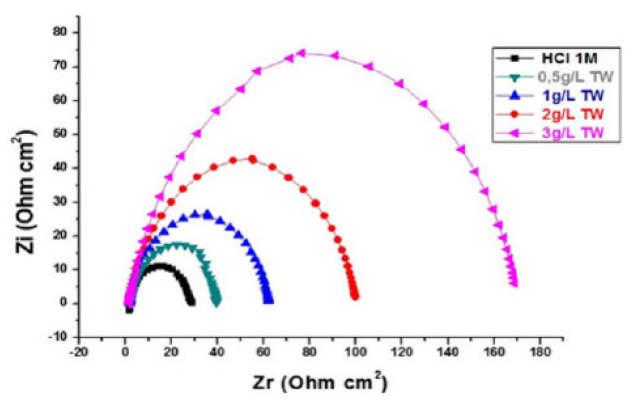
Figure 7 Nyquist diagrams for mild steel without and with TW, after 90 min of immersion in 1 M HCl, at various concentrations.
This indicates that the inhibited substrate impedance increases with higher TW oil concentrations, leading to good inhibitive performance. The electrochemical parameters of Rt (charge transfer resistance), Cdl (double layer capacity) and fmax (maximum frequency), derived from the Nyquist diagrams and inhibition efficiency EW (%), are calculated and listed in Table 4. In accordance with corrosion parameters (Rt, fmax, Cdl, and EW) from Table 4, it appears that the Rt values increase with higher inhibitor concentrations and, consequently, the EW, at 3g/L, is 83.3%, 82.25% and 82%, for 30, 60 and 90 min immersion, respectively.
Table 4 Electrochemical parameters for mild steel after 30, 60 and 90 min of immersion in 1 M HCl, at various TW oil concentrations.
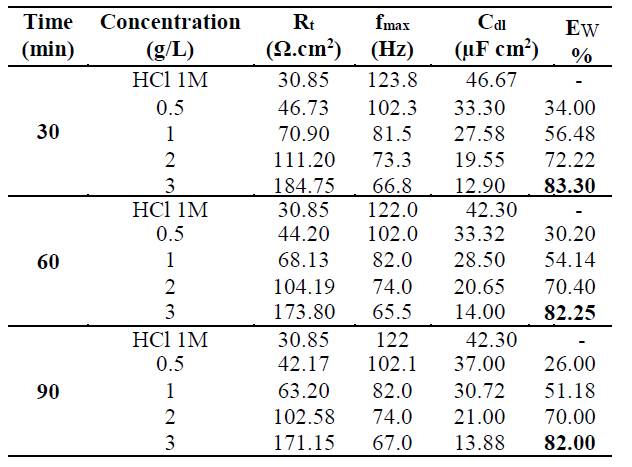
Indeed, the TW oil presence is combined with an increase in the Rt value in 1 M HCl, confirming a charge transfer process that mainly controls MS corrosion. The double layer capacity values are also reduced to a maximum in the TW oil presence, and the decrease in Cdl values follows a similar order to that obtained for Icorr. The decrease in Cdl is due to the TW oil adsorption onto the metal surface, which results in the formation of a film or complex in the acidic solution. It should be noted that increasing the Rt value with higher TW oil concentration increases the corrosion inhibition effectiveness.
Scanning electron microscopy and energy dispersive X-rays
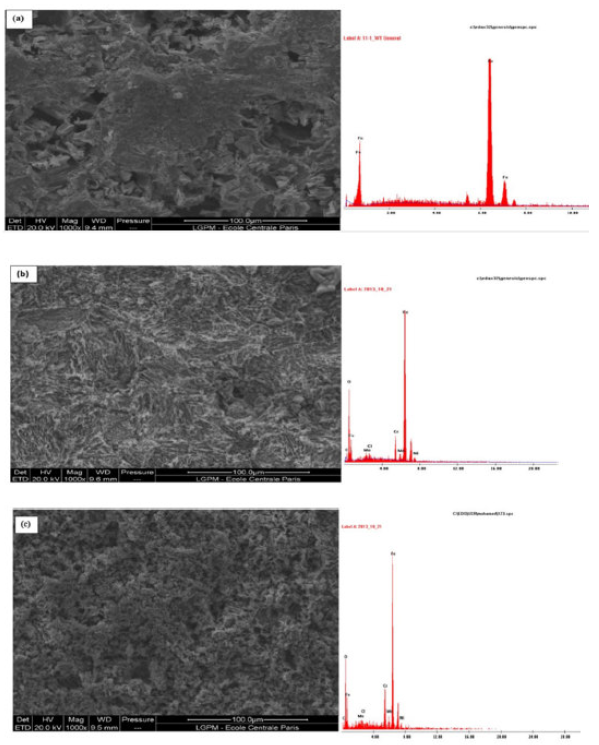
SEM micrographs (Fig. 8, a-b-c) of MS surfaces in 1 M HCl exhibit the changes which occurred during the corrosion process in the TW oil absence and presence.
The MS surface was drastically damaged in 1 M HCl (Fig. 8, a), but, in the presence of 3g/L of TW oil (Fig. 8, b-c), it was remarkably improved. This indicates the formation of a good protective film by T. willdenowii essential oil, which is responsible for corrosion inhibition. The MS EDX spectra contain the peaks corresponding to all elements present in the inhibitor molecules, indicating their adsorption onto the MS surface. The TW oil inhibition effect suggests a high binding of its components on the metal surface, due to the heteroatoms presence, blocking the active sites and, thus, reducing the corrosion rate. In addition, the inhibitive nature of this oil can be attributed to the synergistic intermolecular effect of the various active components, such as thymol and carvacrol [31, 32].
Roughness measurements
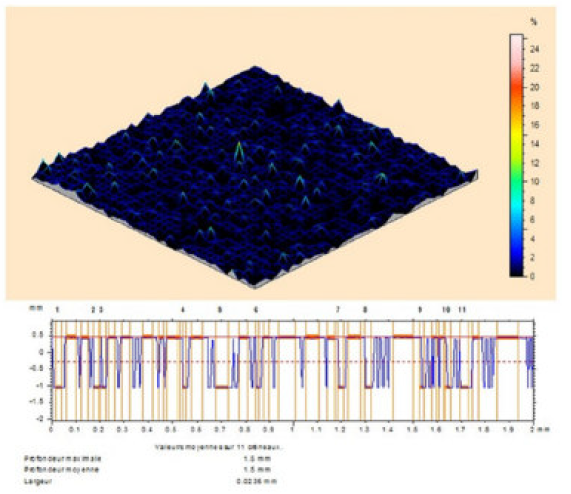
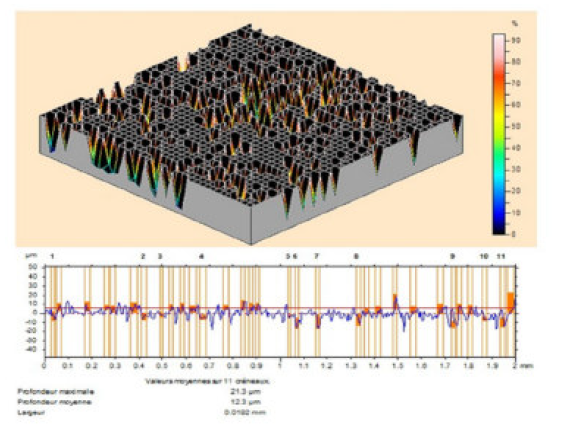
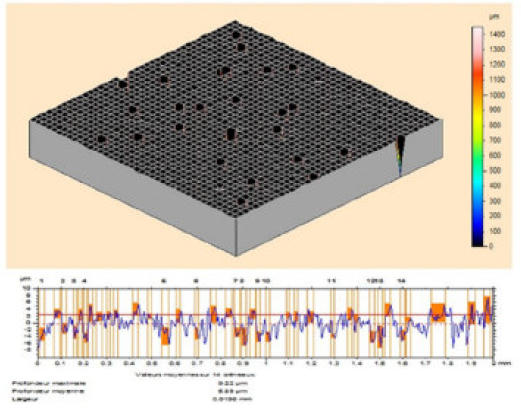
The MS surface roughness was evaluated by microtopography (3D), before and after corrosion (Fig. 9), in the TW oil absence, and in its presence, at different concentrations (0.5-3g/L).
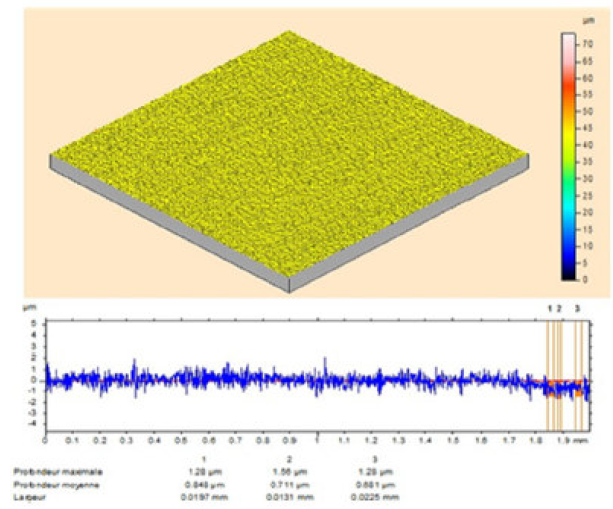
Figure 9 Optical micrographs of MS surface after polishing. It is clearly seen from Fig. 10 that the steel sample shows a rough surface, due to acid corrosion.
However, the essential oil (3g/L) presence retarded the corrosion, and the inhibited MS specimen surface got smoothened, as shown in Figs. 11 and 12. The decrease in roughness can be due to the formation of an adsorbed protective film of TW oil components onto the metal steel surface, by the process of physical adsorption.
FT-IR analysis
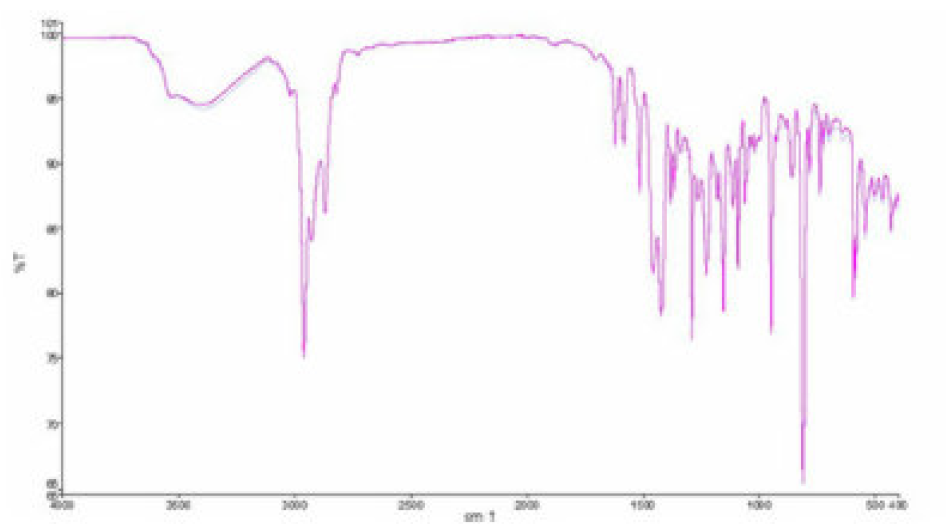
The important IR absorption inhibitors bands are given in Fig. 13. The strong absorption bands (Fig. 13) are attributed: at 3424 cm-1, to the O-H stretching vibration; at 2927 cm-1, to the C-H stretching vibration; at 1623 cm-1, to the C=O stretching vibration. The C-H bending band in -CH2 was found to be at 1407 cm-1. Other absorption bands, at 1138, 1102 and 1054 cm-1, are due to the C-O stretching vibration.
The absorption bands below 1000 cm-1 correspond to the aliphatic C-H group [33]. This result confirms that the TW contains functional groups such as (O-H) and (C=O).
Conclusion
TW essential oil has been shown to be an effective corrosion inhibitor for mild steel in 1 M HCl, and its inhibition effectiveness is related to concentration and chemical composition. The essential oil, at a concentration of 3g/L, showed an inhibition efficiency of 81.42%. The inhibitory action of this oil can be attributed to the phenolic compounds adsorption onto the mild steel surface, such as thymol (47.3%) and carvacrol (3.2%). The results of the potentiodynamic measurements revealed clearly that TW oil is a good mild steel corrosion inhibitor in 1 M HCl.
The TW oil adsorption onto the mild steel surface obeyed the Langmuir adsorption isotherm. The ΔG0 ads negative sign suggests that the essential oil was adsorbed spontaneously onto the metal surface. The SEM/EDX and microtoporaphic analysis were in accordance with the weight loss and electrochemical results. The higher surface roughness of the mild steel exposed to the blank solution shows a bumpy structure with a large number of ups and downs, due to the acid attack. The mild steel surface morphology in the acidic solution changed with the essential oil addition, due to the formation of an adsorbed protective layer which can be explained by a decrease in the average surface roughness, from 1.5 mm to 5.89 nm. Finally, microtoporaphic analysis could be used for further studies on the mild steel surface morphology in various environmental conditions.


