Introduction
Corrosion is not only a source of wasting, but it can also provoke some serious accidents and, in certain cases, environmental pollution. Acidic solutions are widely used for industrial cleaning, oil well acidification and pickling.
The idea of using a corrosion inhibitor is a convenient answer to protect metal and, more precisely, steel, in acidic media 1. Owing to increasing ecological awareness and strict environmental regulations, the need for environmentally friendly processes is now focused on the development of substitute non-toxic organic compounds which contain a polar function with nitrogen 2-3, such as amines and heterocyclic compounds [4-29].
The existing data show that most organic inhibitors act by adsorption onto the metal surface. This phenomenon is influenced by the inhibitors chemical structure. To value HTADP inhibitory performance, WL and electrochemical techniques (ac impedance and polarization techniques) were employed for this purpose. The effect of concentration and temperature (T) on the IE has been examined. The purpose of examining thermodynamic parameters, such as activation energy (AE), enthalpy and entropy, was to know HTDAP activation mechanism on the metal surface, and their values were calculated and then discussed.
Materials and methods
Inhibitor
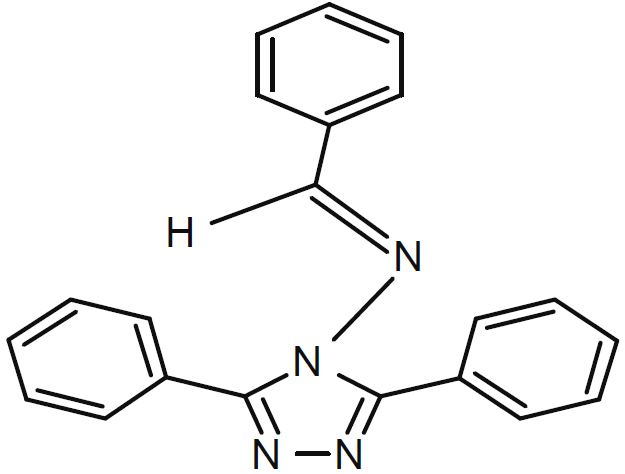
Fig. 1 shows HTADP molecular structure.
HTADP synthesis
A mixture of 1 mol each of 3,5-diphenyl-4-amino-1,2,4-triazole and benzaldehyde in ethanol, with a small amount of l’APTS (acidic paratoluene sulfonic), was heated in a steel autoclave, for 1.5 to 2 h. After cooling, the reaction mixture was diluted with a small amount of ethanol, separated and filtered off. The filtrate was evaporated under reduced pressure, and the residue was crystallized from ethanol.
Specimens
Ordinary steel specimens containing 0.11% C, 0.24% Si, 0.03% Al, 0.47% Mn, 0.12% Cr, 0.02% Mo, 0.14% Cu, 0.06% W and the remainder Fe were used for the gravimetric and electrochemical measurements. These steel specimens were mechanically cut into 1cm × 5 cm × 0.06 cm, for weight loss and electrochemical experiments. Prior to all measurements, they were mechanically polished on wet SiC paper (grades 400, 800 and 1200), rinsed with doubly distilled water, ultrasonically degreased in ethanol, for 5 min, and dried at room temperature.
Electrolytes
The 1 M HCl solutions were prepared by diluting 37% analytical grade with doubly distilled water. The employed inhibitor concentration ranged from 10-5 to 10-2 mol/L in 1 M HCl, and that of the used electrolyte was 50 mL.
Gravimetric measurements
Steel weight loss, with and without the addition of different inhibitor concentrations, was determined after immersion in 1 M HCl, over 24 h, at 30 ºC, and the IE% was calculated from [30]:
where W0 and W are the steel corrosion weight loss values, after immersion in 1 M HCl solutions, without and with inhibitor, respectively.
Electrochemical measurements
The electrochemical cell used in this study was a potentiometer of the PGZ 100 type, associated with software from Voltamaster 4.
A conventional three electrode glass cell assembly, with an ordinary steel rod as working electrode (WE), a platinum foil of 3-3cm2 as auxiliary electrode (AE) and Hg/Hg2Cl2/KCl, saturated calomel electrode (SCE), for the 1 M HCl medium, as reference electrodes (RE), was used. AC impedance measurements were carried out at Ecorr.
After immersion in a solution without bubbling, 1 cm2 of the steel rectangle surface was exposed to it, and it was used as WE. After the steady state current determination, at a given potential, peak to peak sine wave voltage (10 mV), at the frequencies from 100 KHz to 10 mHz, was superimposed on the open circuit potential.
Computer programs automatically controlled the measurements performed at rest potentials, after 30 min of exposure. The impedance diagrams are given in the Nyquist representation. Rtc and Cdl values were obtained from Nyquist plots.
For polarisation curves, potentiodynamic polarisation studies were performed at a scan rate of 1 mv.s-1, in the potential range from -750 mV to -100 mV, relative to the corrosion potential [31].
Results and discussion
WL measurements
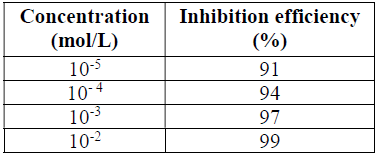
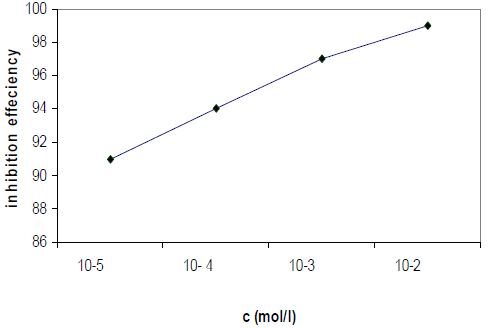
The IEs calculated from the WL measurements, for different HTADP concentrations in 1 M HCl, are summarized in Table 1.
The IE increased with higher inhibitor concentrations (Fig. 2). The inhibition was estimated to be superior to 90% in 1 M HCl, even at very low concentrations (10-5 mol/L), and the optimum concentration for maximum efficiency was found to be 10-2 mol/L of HTADP.
Polarization measurements
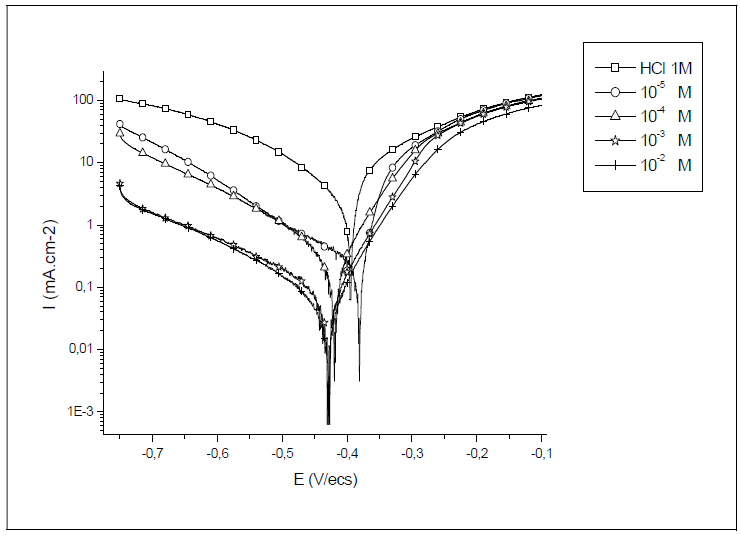
Steel polarisation curves, in 1 M HCl, without and with HTADP, in different concentrations, at 20 ºC, are presented in Fig. 3. The collected parameters deduced from the polarisation curves, such as corrosion potential (Ecorr), corrosion current (Icorr), cathodic Tafel slopes ((c) and IE%, are shown in Table 2.
Fig. 3 and Table 2 show that the cathodic current potential curves gave rise to Tafel lines, indicating that the hydrogen evolution reaction was activation controlled.
The cathodic current density decreased with HTADP concentration. The slopes of cathodic tafel lines (ßca) and the corrosion potential remained almost constant upon the increase in the inhibitor concentration. This result indicates that the reduction mechanism of the hydrogen ion was not modified by HTADP 32. However, in the anodic domain, the IE characteristics stayed almost unchanged in the broad field. This result indicates that the complex predominantly acted as a cathodic inhibitor, by simply blocking the available surface area. The inhibitor molecules decreased the corrosion surface area, and only caused inactivation of a part of the surface towards the corrosion medium 33. The inhibition efficiency increased with the inhibitor concentration, attaining 97% at 10-2 M HTADP.
Table 2 Steel electrochemical parameters at various HTADP concentrations in 1 M HCl, and corresponding IEs.

Electrochemical Impedance Spectroscopy (EIS)
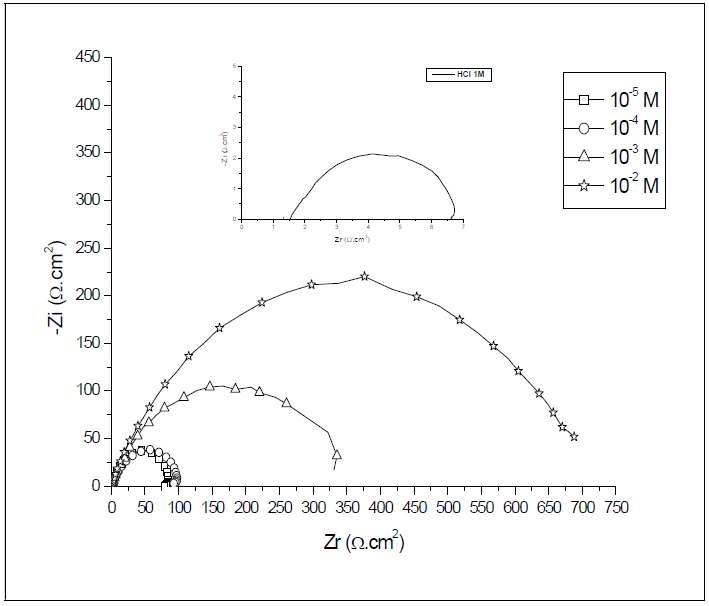
Ordinary steel corrosion, in 1 M HCl with HTADP, was investigated by steel EIS. Nyquist plots, which are shown in Fig. 4.
The obtained impedance diagrams are not perfect semicircles, and this difference has been attributed to frequency dispersion 34-36.
The transfer resistance values (Rtc) were calculated from the difference in impedance, at lower and higher frequencies 37. To obtain the double layer capacitance (Cdl) values, the frequency at which the imaginary component of the impedance (-Zmax) was found was calculated from the following equation:
The IE was calculated by Rtc, as follows:
where Rtcinh and Rtco are the transfer resistances for steel in 1 M HCl, without and with HTADP, respectively.
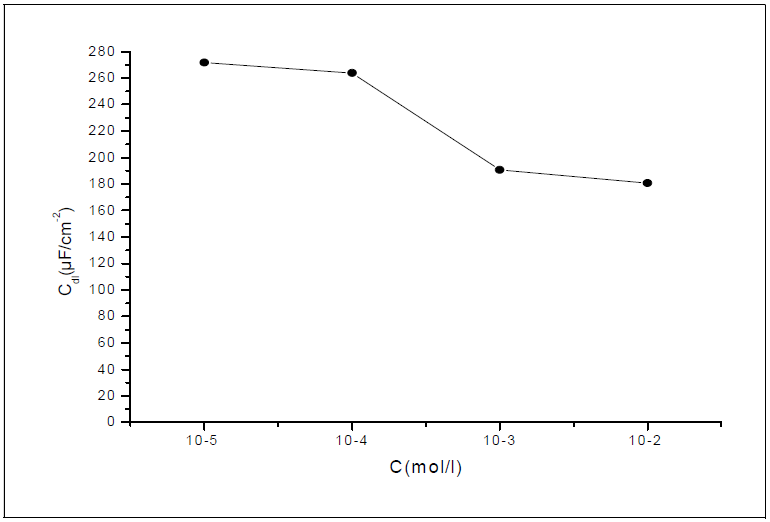
It was found (Table 3) that, as the HTADP concentration increased, the Rtc values were higher, but the Cdl values tended to decrease (Fig. 5). The decrease in Cdl values was due to HTADP adsorption onto the metal surface 38. The electrochemical study confirmed the results of the weight loss measurements. HTADP appears to be a good inhibitor in 1 M HCl, with a maximum efficiency of 99%.
Table 3 Characteristic parameters evaluated from the impedance diagram for steel in 1 M HCL with various HTADP concentrations.

Temperature (T) effect
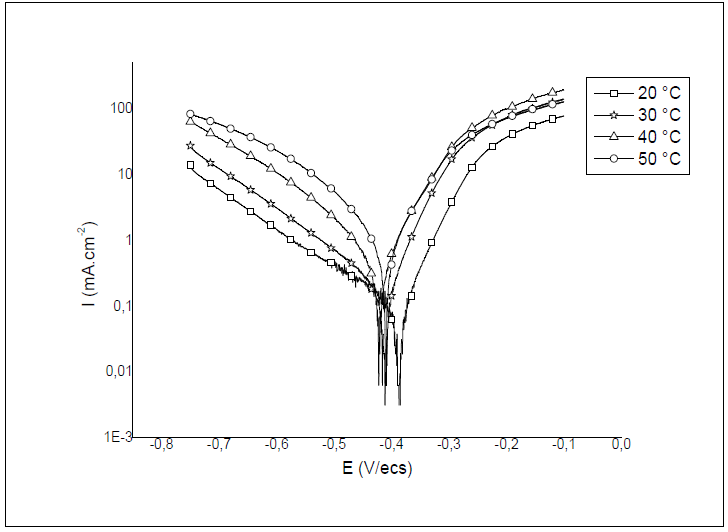
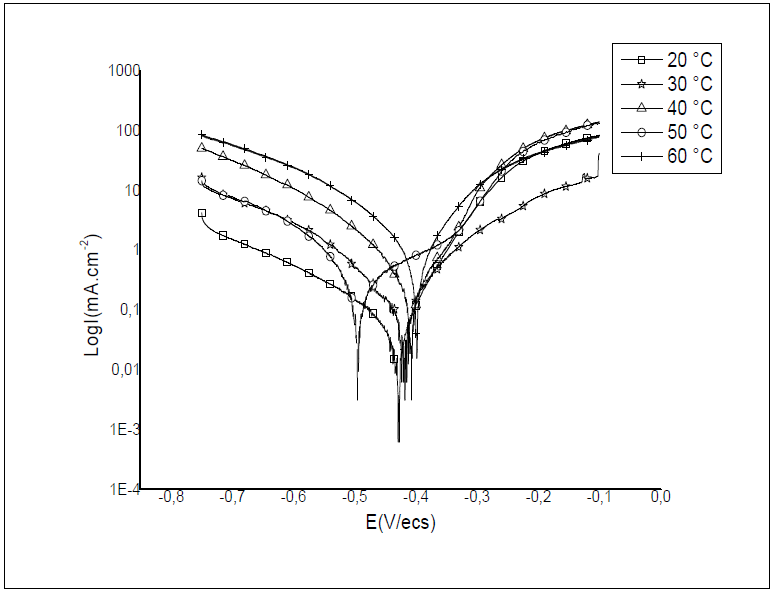
To study T effect on HTADP IEs, polarisation experiments were conducted in the T range from 20 to 60 ºC, without inhibitor, and with 10-2 M of HTADP. Typical polarisation curves are shown in Figs. 6 and 7. Electrochemical parameters and IE% values are given in Table 4.
Table 4 Temperature effect on the electrochemical parameters for an ordinary steel electrode immersed in 1 M HCl without HTADP, and containing 10-2 M of it.
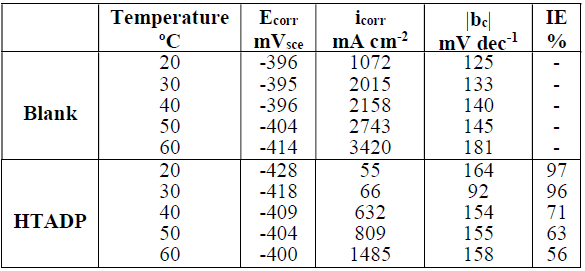
The corrosion current density increased with higher T, in both uninhibited and inhibited solutions. There was a greater increase in the blank medium. The corrosion potential values changed slightly with temperature variation.
The decrease in inhibition efficiency with higher T, in HTADP case, could be due to a weakening of adsorption.
Adsorption isotherm and thermodynamic parameters
The adsorption isotherm can be determined if the inhibitor effect is mainly due to its adsorption onto the metal surface. The type of the adsorption isotherm can provide additional information about the properties of the tested compound. The fractional surface coverage (θ) can be easily determined from the WL measurements:
where Wo and W are the corrosion rates without and with inhibitor, respectively.
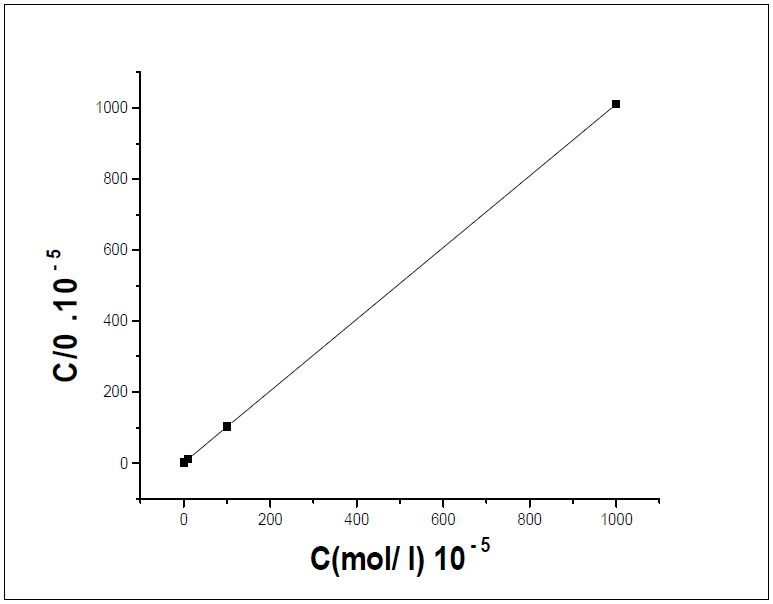
The dependence of θ on the inhibitor concentration (C), was graphically tested by fitting it to various isotherms. Langmuir's isotherm assumes that the solid surface contains a fixed number of adsorption sites, and that each site holds one adsorbed species. The θ data for the studied compounds have failed to be linear, when C/θ versus C were plotted. The linear regression coefficients (R2) were equal to 1, and the slopes were very close to 1, suggesting that the inhibitor adsorption onto the steel surface followed the Langmuir's isotherm:
where K is the adsorptive equilibrium constant.
The plot of Cinh/( versus Cinh gave a straight line, as shown in Fig. 8, confirming that the HTADP adsorption in 1 M HCl followed the Langmuir's adsorption isotherm. The free energy of adsorption was calculated according to the following equation:
where 55,5 is the molar concentration of water in the solution in mol/L-1.
(G°ads values were found to be -39,01 Kj/mol (Kilojoule) (Table 5), indicating the inhibitor spontaneous adsorption onto the metal surface [39-42].
The activation kinetic parameters, such as energy (Ea), enthalpy ((Ha°) and entropy ((Sa°) activation for the corrosion process, may be evaluated from the T effect, using Arrhenius law (Eq. (7)) and the alternative formulation of Arrhenius equation (Eq. (8)) [43].
where A is the Arrhenius pre-exponential factor, h is the Planck’s constant, N is the Avogadro’s number, and I is the corrosion current density.
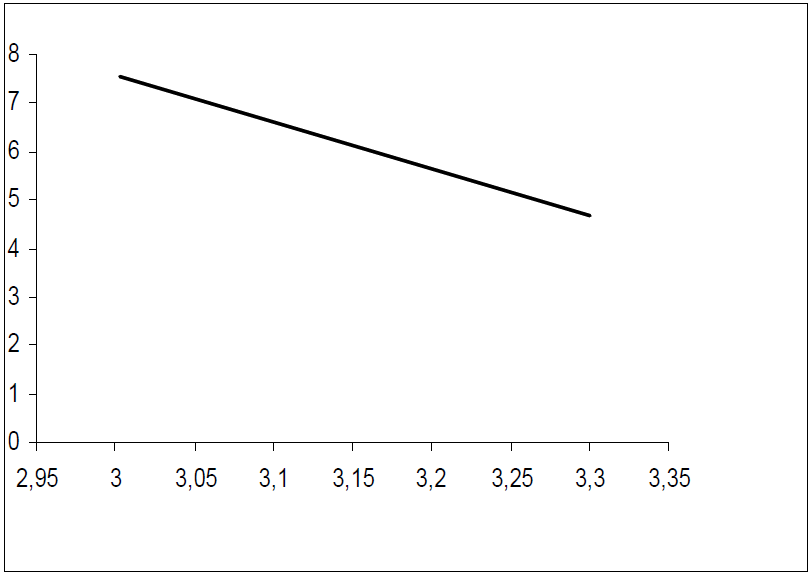
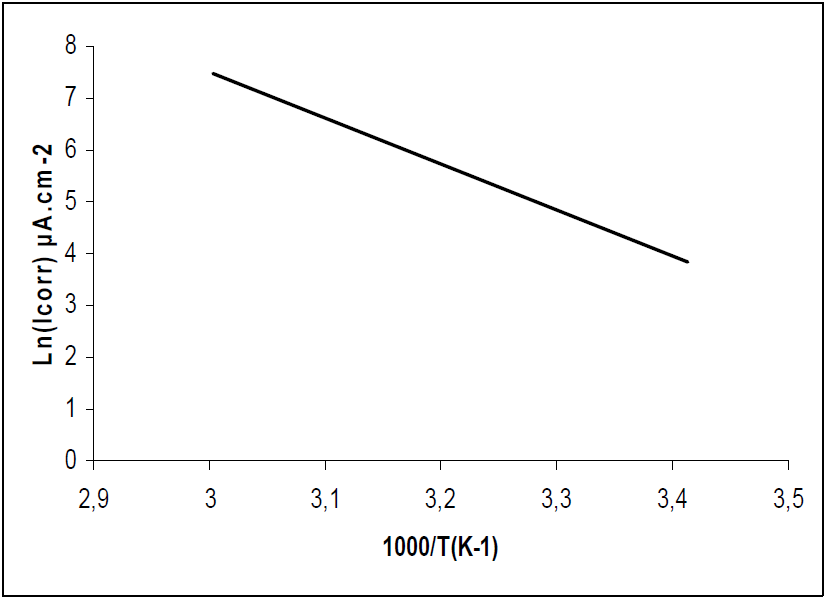
The apparent Ea and A were calculated by the linear regression between ln(I) and 1/T (Figs. 9 and 10). Ea, without and with inhibitor, was found to be 21.46 and 73.65 kj/mol, respectively. A and Ea showed the same trend. The increase in Ea, in HTADP presence, may be interpreted as physical adsorption [44], which occurs in the first stage [45]. The increase in Ea can be attributed to an appreciable decrease in the inhibitor adsorption onto the steel surface, with a higher T. A corresponding increase in the corrosion rate occurs due to the greater area of metal that is exposed to the acidic environment.
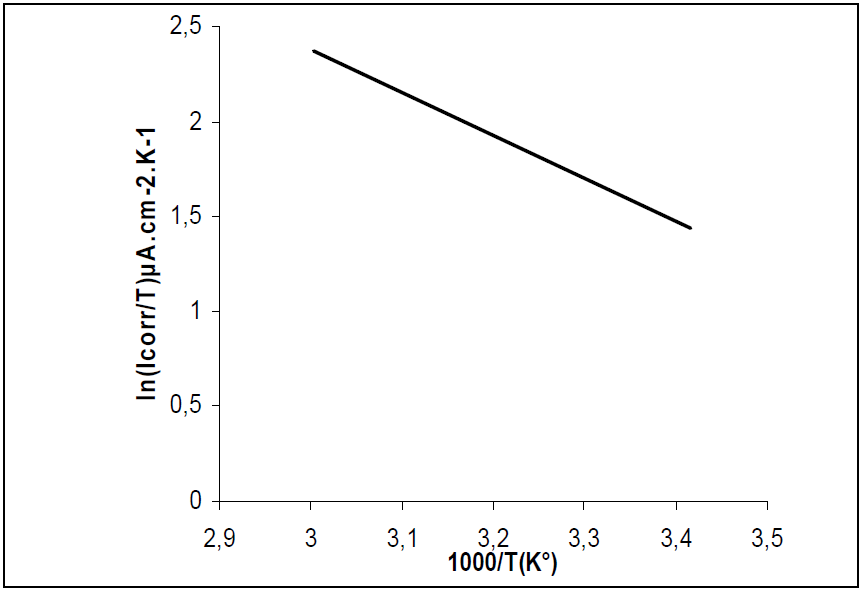
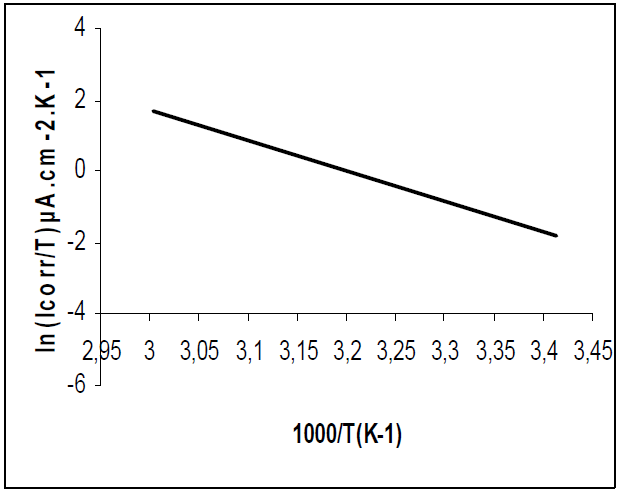
Figs. 11 and 12 show plots of ln(I/T) against 1/T. Straight lines were obtained with a slope of -(Ha°/R and an intercept of (ln R/Nh + (Sa°/R), from which (Ha° and (Sa° values were calculated (Table 6).
(Ha° values, without and with the inhibitor, were found to be 18.79 and 71.05 Kj/mol, respectively, reflecting the endothermic nature of the steel dissolution process, which means that it was difficult [46]. This result permits to verify the known thermodynamic relation between Ea and (Ha°, as also shown in Table 6 [47]: Ea - (Ha° = RT. The calculated values were too close to RT, which is 2.56 kJ/mol, at 303 ºK.
The (Ha° positive values, with inhibitor, imply that the activated complex in the rate determining step represents an association rather than a dissociation step, meaning that an increase in disordering takes place on going from the reactants to the activated complex [48].
Conclusions
From this study we can deduce the following main conclusions:
HTADP is a very good inhibitor in 1 M HCL.
HTADP, as a mixed inhibitor type, predominantly influenced the cathodic process.
Weight loss, electrochemical impedance spectroscopy and polarisation curves are in reasonably good agreement.
Corrosion inhibition by HTADP was due to the formation of a physiosorbed film onto the metal surface.
The HTADP adsorption onto the steel surface in 1 M HCl obeyed Langmuir’s adsorption isotherm.


