Introduction
Cu is recognized as one of the most versatile engineering materials, due to its thermal and electrical conductivity, corrosion resistance and reasonable mechanical properties. It is widely used for building constructions, industrial machinery, water-cooling systems, desalination plants and heat exchangers. However, Cu applications have been limited, due to its chemically reactive nature. Cu forms oxide films of various kinds, depending on the nature of the environment it is exposed to. Salts can also be thought about as major contributor. Chloride ion (Cl-), being a robust reducing agent, speeds up corrosion by reacting at the substrate surface as a catalyst, to accelerate the corrosion process [1]. Another cause is the exposure to aggressive media, such as hydrogen chloride (HCl) and Nitric acid (HNO3), which are extensively employed in several chemical industries [2]. Thereby, the development of an efficient and durable anti-corrosion protective coating is essential for its use in the above applications [3].
Conventional organic, inorganic and metallic anticorrosive coatings have been developed to protect metals from corrosion [4, 5]. The inhibitors efficiency is mostly related to the presence of polar functional groups with heteroatoms such as S, O or N and pi (π) electrons in their compounds [6, 7]. These polar groups in the molecules provide strong protection by adsorbing onto the metallic surfaces through π- and non-bonding electrons, polar groups and aromatic rings, and blocking one or more of the corrosion reactions occurring at the solution/metal interface [8, 9]. However, traditional corrosion resistant coatings have disadvantages, such as the use of volatile organic compounds or a high pigment volume concentration, which have created environmental hazards. Hence, a natural polymer such as chitosan and its derivatives could be considered as an attractive alternative to organic corrosion inhibitors, as it shows significant interacting capability with metals, via -NH2 groups available on its chain [10]. In addition, these anti-corrosion coatings are believed to alter Cu attractive electrical and thermal properties [11], minimize the disadvantages of traditional coatings, and to be long lasting environmentally friendly compounds, at the same time not interfering with the material characteristic properties. Nanostructure materials have made it possible [12].
Carbon-based nanomaterials have been chosen due to some valuable features, such as an impressive chemically stabilization, low thermal coefficient, extraordinary thermal conductivity, high lubricity, lightness, porous surface, non-toxicity, resistance to radiation, being highly recommended for green chemistry application and friendly to organisms [13].
Graphene is comparatively new and has attracted significant interest, due to its unique combination of properties that are ideal for corrosion inhibiting coatings. It is a two-dimensional, single atom, thick honeycomb crystal lattice of carbon allotrope formed by tightly packed sp2 carbon atoms. Because of the free electrons, it has exceptionally high electrical and thermal conductivity, strength and ductility [14, 15]. It is chemically inert, stable in an ambient atmosphere up to 400 ºC, and it can be grown on a meter-scale, and mechanically transferred onto arbitrary surfaces [14]. Since single-layer and multilayer graphene films are exceptionally transparent (>90% transmittance for 4-layered graphene) [15, 16], they do not perturb the underlying metal optical properties. Yet, direct graphene deposition on the metal surface is a major challenge while working with it. In addition, it has poor dispersion in both aqueous and non-aqueous solvents [15]. In chemical vapor, deposited graphene on Cu shows some disparities in corrosion resistance, due to irregularities, cracks, domain boundaries, wrinkles and folds in the protective layer [16].
Contrarily, graphene oxide (GO) has a lamellar structure, with both sp2 and sp3 hybridized carbon atoms forming a hexagonal carbon network. On its basal plane, GO has a greater number of exposed oxygen atoms containing functional groups, such as epoxide and hydroxyl and, on the edges, it has carbonyl and carboxyl groups which make it appropriate for bonding with both organic and inorganic materials by other forces than those of full covalent bonds. Both hydroxyl and epoxide groups make GO a better material than graphene, in terms of hydrophilicity and ease of dispersion in water, and of its ability to form hybrids and polymers [15, 16].
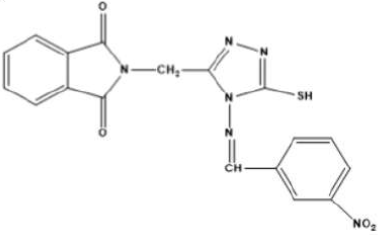
Therefore, considering the GO significance in varied applications in current years, this study focused on the fabrication of a GO-4-NBT hybrid protective coating for a Cu electrode, by electrochemical deposition. Further, based on electrochemical findings, GO-4-NBT anticorrosive activity on the Cu surface in 1 M HCl and 0.1 M Na2SO4 aggressive media was explored. The 4-NBT structure is given in Fig.1.
Experimental
Working electrode preparation
AISI 10100 Cu (99.99%) was chopped into circular discs in a die cutting machine. Electrical connections were made possible by a soldering process. After embedding into a Teflon tube, the exposed surface (with an area of 1.0 cm2) was abraded with various grit size emery papers (i.e., 800, 1200, 2000 and 4000). The smooth surface was further degreased with acetone, ultra-sonicated for 3 min, systematically rinsed with distilled water and then dried in air.
Chemicals and solution preparation
All chemicals used were commercially available and of analytical grade. Graphite powder, with a purity of 99%, was used to prepare GO, by employing Hummer’s technique [17, 18]. 2 g of graphite powder were mixed with 1 g of sodium nitrate (NaNO3), followed by the addition of 46 mL of concentrated sulfuric acid (H2SO4), under constant stirring. After 1 h, 6 g of the potassium permanganate (KMnO4) oxidizing agent were added to the solution, with vigorous stirring, at a temperature below 15 ºC, to avoid explosion. The mixture was constantly stirred for 15 h, at 35 ºC, and the resulting brownish paste was diluted by adding 500 mL of distilled water, with vigorous stirring. Finally, 10 mL of hydrogen peroxide (H2O2) (30%) were slowly added to the mixture, after which the color of the latter changed to bright yellow. Then, it was centrifuged and washed with HCl and distilled water, sequentially, to remove the residual ions. Further, the end product was kept in vacuum desiccators at room temperature, in order to dry it prior to use. A GO dispersion of 1 mg/mL was prepared by ultra-sonication for 30 min. From the 4-NBT (5.0 ×10⁻³ M) stock, two dilutions were made, 0.05 and 0.1 mM, in dimethyl sulfoxide (DMSO).
Instrumentation
Electrochemical studies of the Cu surface were carried out by using an “AUTOLAB” PGSTAT-302 potentiostat/galvanostat, with GPES (General Purpose Electrochemical System) and FRA-2 modules, and a software package version 4.9 (Eco Chemie, Netherland). For CV and PDP measurements, a GPES module, and, for impedance studies, a FRA-2 module, were separately run. The pH values were adjusted with a pH meter (Jenway, 3510 model). An analytical balance (Shimadzu AUW 320 model) was used to weigh the Mg/mol of the samples.
Electrochemical procedure
An electrochemical cell with three electrode configurations was used for redox (reduction/oxidation) measurements. A Cu disc (area of 1 cm2), a Pt wire and saturated calomel (SC) were used as working, counter and reference electrodes, respectively. The SCE was placed in a lugging capillary, and the tip was kept closer to the working electrode (WE) exposed surface, so that the IR (voltage) drop could be minimized. All electrochemical experiments were carried out using freshly prepared, clean and dried WE surfaces in aerated unstirred solutions, at 298 K. CVs of the bare Cu-electrode in 0.1 M Na2SO4 and 1 M HCl solutions were recorded, separately, vs. SCE, within a potential scan range from 1 V to -1.5 V. Then, CV responses of the Cu electrode were recorded with 1 mL of 1mg/mL GO dispersion, and, afterwards, with 0.05 and 0.1 mM of GO-4-NBT. The scan rate was adjusted at 50 mVs-1 for each measurement. PDP curves were scanned from ± 1mV vs. open circuit potential (OCP), at the scan rate of 1 mVs−1. EIS measurements were carried out by running the FRA-2 (frequency response analyzer) module, in a frequency range from 100 MHz to 100 mHz, at steady OCP, with an amplitude of 10 mV ac sine wave. Impedance data for the Cu surface, without and with GO and GO + 4-NBT (0.05 and 0.1 mM), in 0.1 M Na2SO4 and 1 M HCl, were recorded in the form of Nyquist plots.
Results and discussion
CV studies
CVs of the pure Cu (99.99%) electrode were recorded in the potential range from -1.2 to +0.8V, in 0.1 M Na2SO4 and 1 M HCl, as shown in Fig. 2. In 0.1 M Na2SO4, no anodic peak was observed up to 0.0 V, but there was a drastic increase in the current, as indicated in Fig. 2a. The sudden increase in anodic currents was due to Cu corrosion, and, in the reverse scan, a cathodic peak was observed, which may correspond to CuCl- 2 and CuCl reduction. However, in the 1 M HCl solution, two anodic and one cathodic peak were observed for the bare Cu surface (Fig. 2b). The first oxidation peak in the CV plot corresponds to the Cu dissolution into Cu+. Consequently, the second oxidation peak represents the process of Cu+ dissolution into soluble Cu2+. In the reserve sweep, CuCl2 - corrosion product was partially reduced. As a result, Cl- concentration at the Cu and salt layer interface increased, which led to fast Cu dissolution into Cu2+ [19]. In both 0.1 M Na2SO4 and 1 M HCl aggressive media, most of the Cu surface was tarnished, which indicates that general corrosion took place. However, in sulphate (SO4 2 -) with electrolytes, a comparatively higher density of pits than that of chloride (Cl-) with electrolytes has been observed [20, 21], at the material surface. Therefore, SO4 2 - in a solution was considered more corrosive than the Cl-one.
From the CV responses, without and with GO and GO-4-NBT (0.05 mM and 0.1 mM), it was observed that GO deposition onto the substrate caused a decrease in the hysteresis loop, and that the cathodic current density decreased in 0.1 M Na2SO4, while, in the case of 1 M HCl, a small decrease in the height of both anodic and cathodic peaks was observed (Fig. 2).
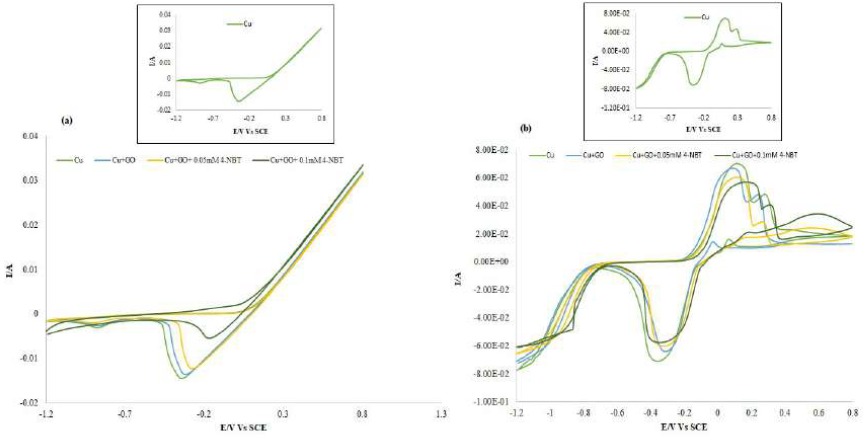
Figure 2 CV responses of the Cu-surface, with and without GO and GO-4NBT in (a) 0.1 M Na2SO4 and (b) 1 M HCl, at a scan rate of 50 mV s-1. The in-set represents CVs of bare Cu in the two aggressive media.
These responses indicate an improvement in Cu corrosion resistance, as GO prevented the aggressive ions from reaching the metal surface in both media [22, 23]. With GO-4-NBT, the current density of the cathodic peak further decreased to a certain extent, which indicates that its presence inhibited the Cu (I) oxidation into soluble Cu2+. The results show that GO-4-NBT is an effective Cu dissolution inhibitor in both media. However, in 1 M HCl, the drop in the current density of both anodic and cathodic peaks was lower than that in Na2SO4, which indicated that the Cu surface in 1 M HCl was not completely covered by a protective layer of GO-4-NBT. Additionally, the extent of inhibition was more pronounced in Na2SO4, which could be related to the pits greater density in this medium. GO-4-NBT reduced more effectively the metal surface roughness and filled more evenly these pits in Na2SO4 than in HCl.
PDP measurements
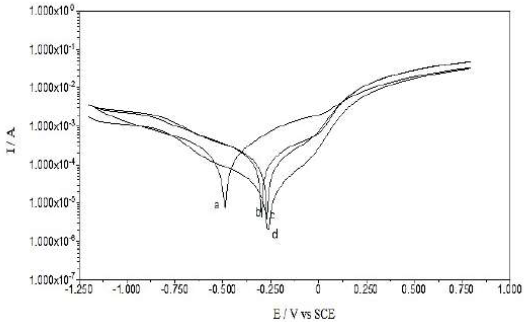
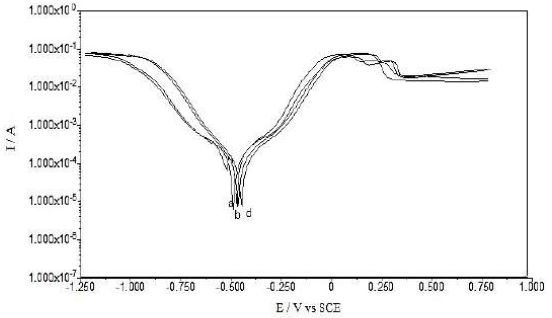
PDP curves for Cu in 0.1 M Na2SO4 and 1 M HCl, without and with GO and GO-4-NBT (0.05 mM and 0.1 mM), are provided in Figs. 3 and 4, and their parameters are given in Table 1.
All the scans have exhibited a slightly similar polarization behavior, as shown in Figs. 3 and 4, and indicated no changes in the electrochemical reactions, before and after the inhibitor adsorption onto the Cu surface. The data indicated no significant change in the anodic and cathodic Tafel slopes (βa and βc) values, after the inhibitors addition, which revealed that GO and GO-4-NBT did not modify the reaction mechanism. The inhibitors molecules (GO and GO-4-NBT) were adsorbed simply by blocking the active sites available for reaction. Further, both anodic and cathodic reactions were suppressed after the inhibitors adsorption, while the actual reaction mechanism remained unaffected [24].
Table 1 Potentiodynamic polarization parameters of the Cu surface, before and after the compounds addition at various concentrations, in 0.1 M Na2SO4 and in 1 M HCl.

A compound can be classified as an anodic or cathodic-type inhibitor based on the Ecorr value shift. If the displacement in Ecorr is greater than 85 mV towards the anode or cathode, with reference to the blank, an inhibitor is categorized as either an anodic or cathodic-type inhibitor, respectively. Otherwise, the inhibitor is treated as a mixed type [25].
The Ecorr value for the bare Cu surface in 0.1 M Na2SO4 was -0.49 mV, but, after GO adsorption, the value shifted to -0.30 mV. After the addition of 0.05 and 0.1 mM 4-NBT, Ecorr further shifted to -0.27 and -0.25, respectively. Hence, there was a significant change in Ecorr value, and its maximum displacement was > 85 mV towards a positive potential, indicating that these compounds (GO-4-NBT) are anodic inhibitors. Similarly, in 1 M HCl, the recorded Ecorr value for the bare Cu surface was -0.460 mV, but it further shifted to -0.440 mV and 0.420 mV, with GO and GO-4-NBT, respectively. The anodic shift in Ecorr was lower in the HCl medium than in the Na2SO4 medium.
A pronounced decrease in Cu icorr, from 0.53 × 10⁻⁴ µcm-2 to 0.06 × 10 -4 µcm-2, with GO, was observed, which was further reduced to 0.05 × 10⁻⁴ µcm-2 and 0.04 × 10⁻⁴ µcm-2, respectively, with GO-4-NBT (0.05 mM and 0.1 mM). A decrease in the corrosion current density (icorr) suggested that both GO and GO-4-NBT inhibited the corrosion process on the Cu surface, by backing off the charge transfer process responsible for dissolution. The polarization resistance value, Rp, increased significantly with higher GO-4-NBT concentrations, which indicates that its action on the Cu surface was efficient.
The corrosion inhibition efficiency (EPDP%) of GO-4-NBT was evaluated from corrosion current densities, by using the following equation:
where icorr and i´corr are the corrosion current densities without and with inhibitors, respectively.
IE for GO, in 0.1 M Na2SO4, was 88.67%, suggesting the inhibitor application as a corrosion resistant coating, and, for GO-4-NBT, it was 90.57% (0.05 mM) and 92.46%, (0.1 mM), indicating that the former is better than the latter. Similarly, in 1 M HCl, the IE for the GO coating was 60.27 %, and, for GO-4-NBT, it was 68.49% (0.05 mM) and 75.34% (0.1 mM), respectively. 4-NBT has further enhanced GO IE in both media, despite its values being lower in 1 M HCl.
Adsorption studies
The GO and GO-4-NBT adsorption at a Cu/solution interface can be presented as a substitution adsorption process between the inhibitors molecules in aqueous solutions and the water molecules on a metallic surface. This substitution reaction is written as follows:
where Org (aq) represents the inhibitor molecules in the aqueous solution, H2Oads are the adsorbed water molecules onto the metal surface, and n is the number of water molecules removed from the metal surface by each adsorbed inhibitor molecule.
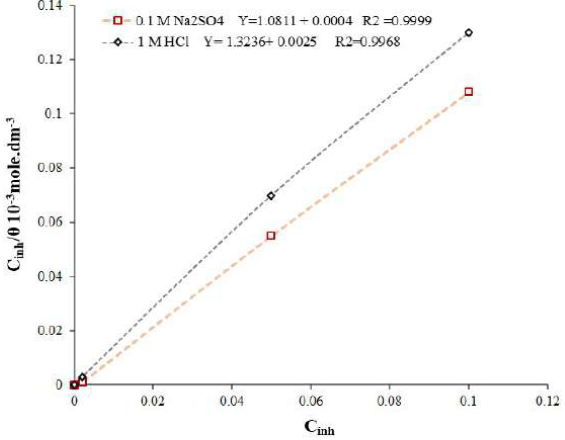
The adsorption nature of a compound can be identified by fitting experimental data into various adsorption isotherms [26]. In the present study, adsorption parameters were found best fitted into the Langmuir’s isotherm. The surface coverage (θ) parameter was evaluated using Cu anodic current density without inhibitor, (Ia)o, and with it, (Ia)i, at the concentration indicated in Eq. 3. θ was further used in Eq. 4 to calculate the adsorption constant, Kads, of which values are given in Table 2:
A plot of Cinh / θ vs. Cinh showed a linear regression with its coefficient value, R2, (0.999 in 0.1 M Na2SO4 and 0.997 in 1 M HCl), as shown in Fig. 5.
The intercept of the plot enabled to calculate Kads value. The degree of the adsorption process was calculated with the help of Gibb’s free energy change (ΔG0 ads), by using Kads value in Eq. 5 [27].
ΔGo ads values in both media were > -20 kJ mol-1 (Table 2), which indicates the possibility of both electrostatic (physisorption) and coordinated covalent bonding (chemisorption) interactions between the charge metal and the charged inhibitor molecule [26, 28-30].
However, more negative ΔGo ads values pointed towards a comparatively stronger GO-4-NBT adsorption onto the Cu surface in 0.1 M Na2SO4. The dimensionless separation factor (RL) provides useful data on the feasibility of the inhibitor adsorption. RL was evaluated by using Kads value in Eq. 6.
The values were calculated as lower than 1 (R L <1) in both aggressive media, which indicates that the inhibitor adsorption process was favorable [31] (Table 2). A pronounced decrease in RL values was observed with GO. The value approached more zero as 4-NBT concentration was increased. This trend reveals that the inhibitor has covered a wider Cu area, which protected the metal from corrosion, by limiting the charge transfer process.
EIS studies
EIS technique has been used effectively to investigate the corrosion kinetics, and to understand the compounds inhibition mechanism on the metal surface. Impedance spectra of the Cu electrode in both aggressive media, without and with GO and GO-4-NBT at different concentrations, at OCP, are shown in Fig. 6a and b, in the form of Nyquist plots.
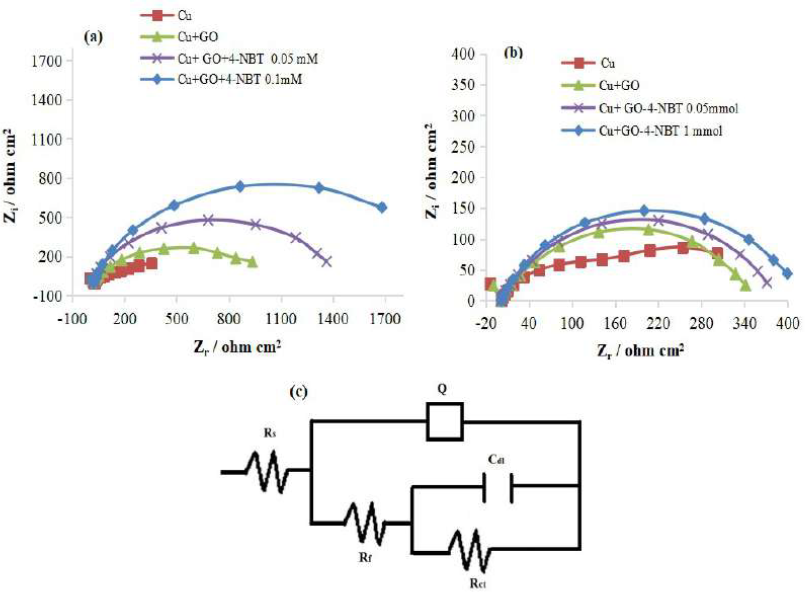
Figure 6 Nyquist plots of the Cu-surface, at OCP, without and with GO and GO-4-NBT (0.05 Mm and 0.1 Mm) in (a) 0.1 M Na2SO4 and (b) in 1 M HCl. (c) Equivalent circuit topology used to fit the obtained impedance spectra.
In a Nyquist plot, an imaginary impedance component (Z″) was plotted against the real impedance component (Z′), at each excitation frequency [32]. Thus, the inhibitors effect on the metal/alloy surface could be recognized by the increase in the semicircle diameter, due to a higher resistivity [33]. The semicircle represents the charge transfer at the electrode-electrolyte interface.
Impedance responses obtained without GO and with GO-4-NBT, at various concentrations, showed only one high frequency capacitive loop that indicated charge transfer in the corrosion process, as well as the formation of an oxide layer. For both cases, the capacitive loop and low frequency resistive regions of the impedance shifted to higher values. Consequently, the semicircle increased widely in diameter, which ascribed Cu resistance towards polarization, through the interaction and formation of the inhibitor protecting layers on the metal surface. After GO addition, the hindrance of both mass and charge transfer was improved, which was further reinforced by GO-4-NBT [30]. An equivalent circuit model was used to fit the impedance plots. The circuit topology fit for the experimental impedance data, in the present study, was proposed as Rs(Rf-Q[Rct-Cdl]) (Fig. 6c). In the proposed topology, Rs indicates the solution resistance, Rf-Q (high frequency circuit) represents the capacitance and resistance of the surface compact oxide layer and Rct-Cdl (medium frequency circuit) corresponds to the charge transfer resistance and double layer capacitance.
The theoretical data using the frequency dependent constant phase element, Q(CPE), fit well with experimental data in the present study. Q(CPE) impedance is given by the following equation:
where A is the proportional factor, ω is the angular frequency (rad s-1), I (i2 = -1) is an imaginary number and CPE exponent, and n was used to determine the metal surface roughness and inhomogeneity. The CPE type is often used to evaluate data for electrodes with a rough surface [34]. The electrode rough surface might have demobilized the frequency, which, as a result, caused a depression in the semicircle, as well as instability in the data [34]. The exponent (n) greater value represents the surface smoothness and high homogeneity, but, in contrast, a low n value indicates the ions and solvent permeability in the surface.
The fit and calculated parameters are shown in Table 3. It can be observed from the data that Rct increased, while the corresponding Cdl values decreased with higher GO-4-NBT concentrations, which reveals that the charge transfer process slowed down, due to the formation of a robust protective layer. The fall in Cdl showed the decrease in the dielectric constant, and the increase in the double layer thickness, which further suggested the GO-4-NBT adsorption onto the Cu-solution interface [35]. An increase in n values with higher compounds concentrations indicated that the redox process at low frequencies was not due to the dissolved oxygen diffusion or reduction, but to the inhibitor molecules accumulation at the electrode surface, raising its homogeneity (Table 3).
Table 3 Impedance parameters for the Cu-surface, without and with GO and GO-4-NBT, at different concentrations, in 0.1 M Na2SO4 and 1 M HCl.

The corrosion IE% of the compounds can be calculated by using the total resistance data in the following equation:
where RT is the total resistance (RT = Rf + Rct) and the subscripts ‘i’ and ‘o’ represent the inhibitor presence and absence, respectively. IE for GO was found greater in 0. 1 M Na2SO4 then in 1 M HCl, and, for GO-4-NBT (0.1 Mm), it increased up to 90%. IE%, obtained either from corrosion current densities in PDP or from RT values in EIS, showed similar trends, and a verified considerable improvement for GO-4-NBT in 0.1 M Na2SO4.
Conclusions
GO and GO-4-NBT corrosion protection activity was analyzed on the Cu surface in 0.1 M Na2SO4 and 1.0 M HCl, by using CV, PDP and EIS. Both anodic and cathodic current in Cu CV response changed with the GO-4-NBT coating, proving it as a mixed type inhibitor. PDP studies showed that GO-4-NBT was adsorbed simply by blocking the active sites available for reaction. Further, both anodic and cathodic reactions were suppressed after the inhibitor adsorption, while the actual reaction mechanism remained unaffected. In EIS studies, the electrode process followed a similar circuit topology, and it was found charged transfer controlled, without and with coated GO and GO-4-NBT. Both PDP and EIS data inferred that the corrosion protection was dependent on the inhibitor concentration, following a spontaneous chemisorption mechanism in both aggressive media. Since SO4 2- in electrolytes was considered more corrosive than Cl-, GO-4-NBT reduced more Cu surface roughness in 0.1 M Na2SO4 than in 1 M HCl. Based on these findings, we assure that such studies would help to explore more efficient and cost-effective protective coatings on metal/alloy surfaces that could be used in various industrial applications, especially in the industries where metals are directly exposed to aggressive media.


