Introduction
Iron (Fe) and its alloys are widely used as construction materials in numerous industrial areas, such as petroleum and chemical industries, power plants, etc., due to their high mechanical strength, easy fabrication and low cost 1,2. There is a variety of applications that puts steel in contact with assorted corrosive environments, such as acidic solutions, during the processes of acid pickling, descaling and cleaning, etching, oil well acidification, etc. 3. In acidic media, steel alloys react quickly, and are converted from a metallic to an ionic state, resulting in a vast economic loss. Therefore, there is a vital need to develop some excellent corrosion controlling methods. One of the best way is the use of corrosion inhibitors 4-6. They can be classified according to their chemical structure, mode of action, etc. Organic corrosion inhibitors are of the utmost importance, due to their easy synthesis, at relatively low cost, and high protection ability. The corrosion prevention process can be attributed to the inhibitor adsorption onto the steel surface, which hinders the active corrosion sites. The formation of a protective layer on the metal surface delays the metal dissolution, reducing corrosion damage 7,8. Many organic molecules possessing aromatic rings and heterocyclic atoms, such as nitrogen (N), oxygen (O), S and phosphorous (P), have proven, practically and theoretically, to be efficient corrosion inhibitors against a wide range of acidic solutions 9,10, as they play an important role in adsorption centres. In general, the inhibitors having heteroatoms follow the reverse order of their electronegativities, so that, in S, N, O and P, (w% is in the order of O < N < S < P 11. The efficiency of these inhibitors can be attributed to their high polarizability and lower electronegativity, so that those atoms and the functional groups can cover large metallic surface areas, which increases the number of electrons transferred (∆N) to the empty atomic orbital 12. N-containing organic inhibitors are good anti-corrosion materials for metals in HCl, while compounds with S atoms act as good inhibitors in sulphuric acid (H₂SO₄) 13. Therefore, in this study, two novel S-containing Schiff’s bases were synthesized and selected to act as inhibitors against MS corrosion in a HCl medium.
Materials and methods
Synthesis and characterization
The N-((1H-indol-3-yl)methylene)thiazol-2 amine(I3A2AT) was synthesized by adding a hot ethanol (C2H5OH) solution of 2-amino thiazole, in dropwise, to a stirred solution containing an equimolar concentration of indole-3-aldehyde in a C2H5OH medium. The mixture was refluxed for 4 h, cooled, and the off-white precipitate was filtered, washed with a C2H5OH-water (1:1) mixture, and dried 14. Its yield was 70% (mp: 168-169 ºC).
The heterocyclic (13E)-N1,N2-bis((thiophen-2-yl)methylene)cyclohexane-1,2-diamine (T2CDACH) Schiff’s base was synthesized by the condensation of an equimolar mixture of thiophene-2-carbaldehyde and 1,2 diaminocyclohexane, in a C2H5OH medium. The reaction mixture was refluxed for 3 h, concentrated and cooled. The cream coloured solid was filtered, washed, and dried. Its yield was 90% (mp: 131 ºC). The products were characterized by electronic (Shimadzu UV-visible-1800, dimethyl sulfoxide (DMSO)), mass (Shimadzu, QP 2010 GCMS), NMR (Bruker Advance III HD, deuterated DMSO) and FTIR (Shimadzu Affinity-1, KBr pellet method) spectroscopic analyses.
Gravimetric corrosion inhibition studies
Metal specimen and corrosive medium preparation
CS coupons were cut, abraded with various grades of SiC papers (100, 220, 400, 600, 800, 1000, 1500 and 2000) and washed with distilled water, followed by acetone (C3H6O). The approximate composition of the CS specimen was determined by the Energy Dispersive X-Ray Analysis (EDAX) technique (0.55% C, 0.08% Mn, 0.04% P, 0.012% S, 0.02% Si, and Fe), with a Hitachi SU6600 scanning electron microscope (SEM) model). A stock solution of I3A2AT and T2CDACH (1 mM) was prepared and diluted with a 1 M HCl solution, to obtain different concentrations (0.2-1 mM).
Weight loss (WL) studies.
The metal specimens were immersed in the aggressive medium for 5 days, at 28 ± 0.1 ºC, with periodical evaluations of the corrosion rate (CR). The experiments were carried out in duplicate, and the average values were reported. The CR was determined by 15:
where v = CR (mmy−1), W = weight loss (g), S = surface area of the metal specimen (cm2), t = time of treatment (h), D = density of the specimen (g/cm−3), and K = constant (8.76 × 10⁴). The (w% was obtained by the following equation:
where v and v’ are the metal specimen CR, without and with inhibitor, respectively.
Temperature effect
The temperature effect on the corrosion was evaluated by the WL studies, in the range from 30 to 60 ºC. The corrosion activation energy, with and without inhibitors, was calculated by Arrhenius equation 16:
where K is the CR, Ea is the activation energy, A is the frequency factor, T is the temperature in the Kelvin (K) scale and R is the gas constant. Arrhenius curves were obtained by plotting log K against 1000/T. Enthalpy and entropy of activation (∆H* and ∆S*) were calculated from the transition state theory, which can be represented by the following equation:
Electrochemical corrosion studies
Electrochemical studies were made using a three-electrode cell assembly consisting of CS (exposed area of 1 cm2), platinum (Pt) electrode (1 cm2) and saturated calomel (SC), as working, counter and reference electrodes (WE, CE and RE), respectively, at 28 ºC. For corrosion, the working area of the metal specimens was put in contact with HCl, for 30 min, before the experiment. An Ivium Compact stat-e electrochemical system, with an Iviumsoft software package, was used to perform the experiments.
EIS studies
EIS measurements were taken at a constant potential, in the frequency range from 1 KHz to 100 mHz, with an amplitude of 10 mV as excitation signal 17-19. The inhibition percentage was calculated by the equation:
where Rct and R’ct are the WE charge transfer resistances, with and without inhibitor, respectively.
PDP studies
PDP studies were carried out by changing the WE potential from +250 to -250 mV, with a sweep rate of 1 mV/s 20. The slope analysis of the Tafel curves gave the corrosion current densities, and the ƞpol% was calculated by:
where Icorr and I’corr are the WE (MS exposed area) corrosion current densities without and with inhibitors, respectively.
ECN studies
The experiments were performed in a three-electrode cell assembly, which consisted of two CS (1cm2) and one SC electrodes. All ECN analyses were conducted for a period of 1200 s 21. An Ivium Compact stat-e electrochemical system controlled by Ivium software was employed for the ECN studies.
Surface morphological studies
SEM images were recorded using a Hitachi SU6600 SEM model, after treatment with a 1 M HCl solution, with and without the inhibitors, for 24 h.
Quantum chemical studies
GAMMES software and the DFT method were used for the determination of the compounds optimized geometry and quantum chemical evaluations. A combination of Lee-Yang-Parr’s nonlocal correlation functional (B3LYP) and Beck’s three parameter exchange functional was employed in the DFT method 22-24.
Results and discussion
The synthesized inhibitor molecules structures were confirmed by spectroscopic techniques.
Molecules structure
I3A2AT analysis calculated for C12H9N3S: EIMS, m/z 227 (M+), 144 (BP, [C9 H8 N2]+), which was generated by the thiazole part loss; IR, γC = N 1627 cm-1, γC - H 2930 and 3043cm-1, γN - H (br) 3157 cm-1, γC = C 1438 cm-1, γC - N 1232 cm-1; UV, 29600 cm-1 (π→π*), 25600 cm-1 (n→π*); 1HNMR, δCH = N 7.19(s), δNH 12.0(d), δCH in the benzene ring 7.18(t), 7.45(t) δCH in the thiazole ring 8.01(d),7.43(d), and no inverse peak in DEPT 135 and, hence, the CH2 group is absent.
T2CDACH analysis calculated for C16H18N2S2: EIMS, m/z 302 (M+), 193 (BP, [C16 H18 N2S2]+); IR, γC=N 1627 cm-1; UV, 39525 cm-1(π→π*), 35971 cm-1 (n→π*); 1HNMR, δCH=N 8.29(s), δCH in the thiophene ring 7.55(d), 7.30(d), 7.03(t), δCH in the cyclohexane ring 3.23(t), 1.76(m), 1.40(t), both upward and downward peaks in DEPT 135, due to the presence of CH and CH2 groups. Fig. 1 shows the I3A2AT and T2CDACH molecular structures and optimised geometries, respectively.
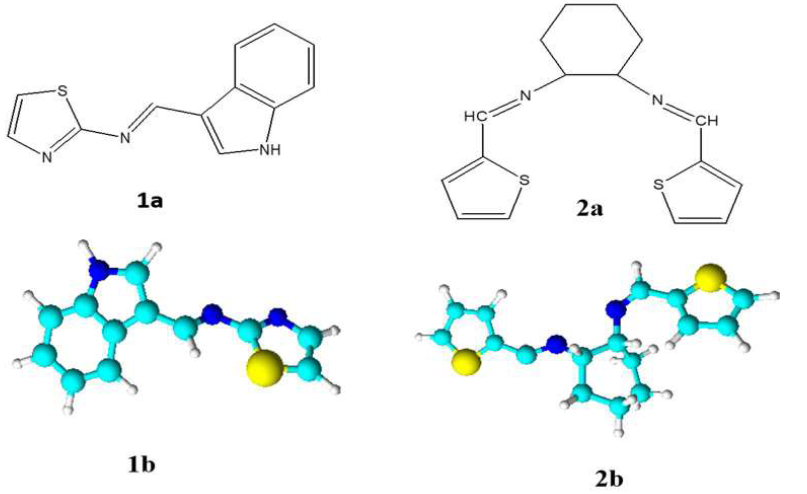
Figure 1 I3A2AT (1a and 1b) and T2CDACH (2a and 2b) Schiff’s bases structure and optimized geometries.
Gravimetric corrosion inhibition studies
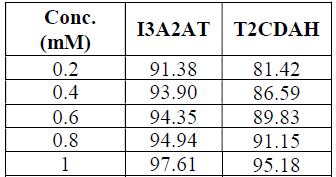
The I3A2AT and T2CDACH molecules corrosion 𝜂w%, for 24 h, at 28 ± 0.1 ºC, is listed in Table 1. Both molecules displayed very high (w% on the CS surface. For a period of 24 h, the I3A2AT molecule showed higher (w% than that of the T2CDACH molecule, at all concentrations. This may be due to the presence of: an extensively conjugated azomethine linkage; an electron rich aromatic heterocyclic ring containing a highly polarizable S atom; and indole and thiazole moieties. The T2CDACH molecule decreased 𝜂w% may be due to the puckered nature of its aromatic rings.
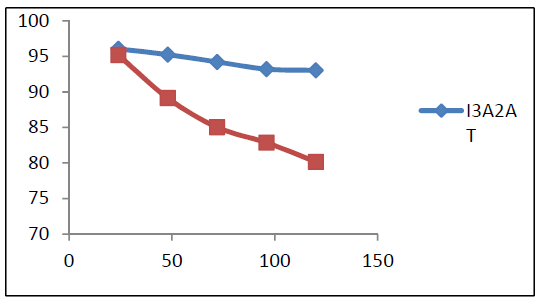
Fig. 2 represents the molecules corrosion 𝜂w% variation with time, at 1.0 mM. The plot revealed that the I3A2AT decrease in (w% was very much steeper than that of T2CDACH, as the days went on. This may be due to the I3A2AT molecules azomethine linkage (C = N) slow hydrolysis in an acidic medium, which was confirmed by the UV-visible study. The inhibitor stability in the aggressive medium is very important, if it is to be recommended for a prolonged use. From the gravimetric corrosion studies results, one can conclude that the I3A2AT molecule acted as a very good corrosion inhibitor for a long time.
Temperature effect
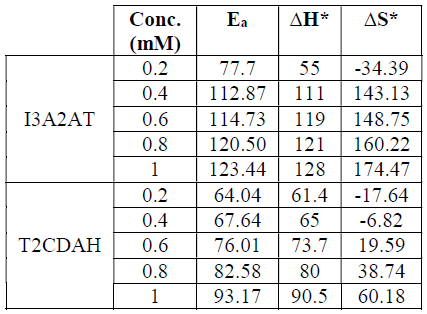
It is apparent, from the results, that the Ea of the metal dissolution increased with the inhibitor concentration. Table 2 shows the thermodynamic parameters of CS corrosion in 1.0 M HCl, with I3A2AT and T2CDACH. They imply that the metal CR decreased with higher inhibitor concentrations, which can be attributed to the considerable intervention of the ligands during that process.
It is also evident from the thermodynamic data that ∆S* increased with higher inhibitor concentrations. At the inhibitors low concentrations (0.2 mM I3A2AT, and 0.2 mM and 0.4 mM T2CDAH), ∆S* exhibited negative values. This suggests that, in the rate-determining step, the activated molecules were in a higher-order state than that at the beginning. As the inhibitors concentration went up, the activated complex disordering increased and ∆S* attained positive values.
EIS studies
MS corrosion behaviour in 1 M HCl, with and without inhibitor, was examined using EIS, at 28 ºC. Figs. 3 and 4 represent CS Nyquist and Bode plots in 1 M HCl, with and without I3A2AT and T2CDACH, respectively.
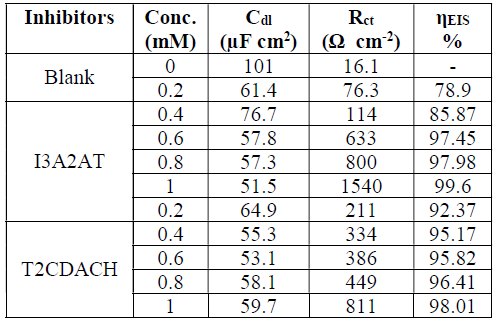
The impedance parameters, including double layer capacitance (Cdl), solution resistance (Rs) and (w%, were evaluated from the charge transfer resistance (Rct) values, and are shown in Table 3.
Table 3 Electrochemical impedance parameters of CS corrosion with and without Schiff’s bases, I3A2AT and T2CDACH, in 1 M HCl.
At both high and low frequencies, the capacitance loop intercepted the real axis. These intercepts at the higher-frequency end represent Rs, and, at the lower frequency end, denote the sum of Rs and Rct. The difference between these intercepts can be calculated to find out Rct, which is the measurement of the electron transfer that takes place on the exposed metallic surface area under analysis, and that is inversely proportional to the surface CR.
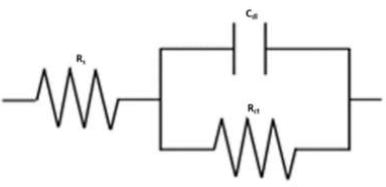
The impedance behaviour study was carried out by electric models that helped to evaluate numerical measurements for the chemical and physical properties of the corresponding electrochemical system under investigation. The equivalent circuit that exactly fitted the EIS curves generally consisted of Rs, Cdl and Rct (Fig. 5). Table 1 reveals that, with higher inhibitors concentrations of both, Rct values increased and Cdl values decreased 25-28.
The variation in Rct values can be explained by the adsorption process through which the inhibition mechanism took place. With higher inhibitor concentrations, the adsorption process considerable increased, which prevented the charge transfer of the metal atoms onto the metallic surface and into the solution, resulting in a Rct increase. Lower Cdl values with higher inhibitor concentrations can be associated to the local dielectric constant values reduction, and to the rise in the electrical double layer thickness. These observations testify the inhibitor action at the solution-metal interface. From the data, it is obvious that both Schiff’s bases, I3A2AT and T2CDACH, acted as potential corrosion inhibitors in HCl.
PDP studies
Tafel extrapolation analysis and linear PDP curves studies (Figs. 6 and 7) were made to establish the impact of the inhibitors on the metal specimens polarization, by the determination of corrosion parameters, such as polarization resistance (Rp), corrosion potential (Ecorr), corrosion current density (Icorr), and (w%, which are listed in Table 4.

Figure 6 a) Tafel plots and b) Linear PDP curves for MS specimens with and without I3A2AT in 1 M HCl.

Figure 7 a) Tafel plots and b) Linear PDP curves for CS specimens with and without T2CDACH in 1 M HCl.
Table 4 PPD parameters of CS with and without I3A2AT and T2CDACH in HCl, at 28 ºC, for an immersion period of 30 min.
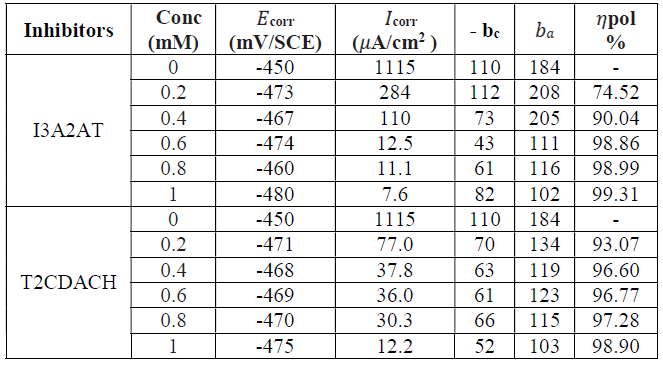
Tafel data analysis pointed out that the Icorr values significantly decreased, and high (w% were obtained by both inhibitors in 1.0 mM HCl, even at low concentrations. The maximum (w% values of 98.15% and 97.83% were shown by I3A2AT and T2CDACH, respectively, at 1 mM concentration in 1 M HCl. This is also congruent with the data obtained in the gravimetric analysis and EIS measurements. In both cases, the cathodic slopes exhibited more predominant changes than the anodic slopes, which is clear evidence for the inhibitors adsorption onto the cathodic sites.
Furthermore, the MS Ecorr values with I3A2AT and T2CDACH were not significantly altered with respect to those without them. However, an appreciable change was noted in anodic or cathodic slopes in the Schiff’s bases, suggesting that, in 1 M HCl, they behaved as mixed-type inhibitors. In other words, the hydrogen evolution process was considerably hindered by both molecules, compared to the Fe oxidation into Fe2+.
ECN studies
ECN experiments were performed with identical CS electrodes and a RE immersed in HCl, with and without I3A2AT and T2CDACH, during 1200 s, at 28 ºC.
Fig. 8 represents the current ECN for MS in HCl without and with 1 mM I3A2AT and 1 mM T2CDACH, respectively.
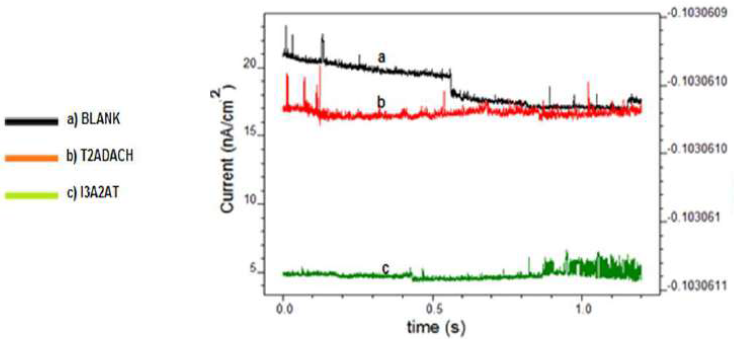
Figure 8 Current ECN for CS with and without I3A2AT and T2CDACH in 1 M HCl, at 28 ºC, with 1 mM concentration.
From the ECN data, it is evident that the current ECN mean values followed the order uninhibited solution>I3A2AT>T2CDACH. Potential ECN standard deviation (SD) to current ECN SD gave the ECN resistance (R() 29. The inhibited CS R( was much higher than that of the uninhibited metal. The inhibited solutions ECN mean values were lower than those of the uninhibited ones.
The frequency-domain analysis of ECN data gave the power spectral density (PSD) of various systems (Fig. 9).
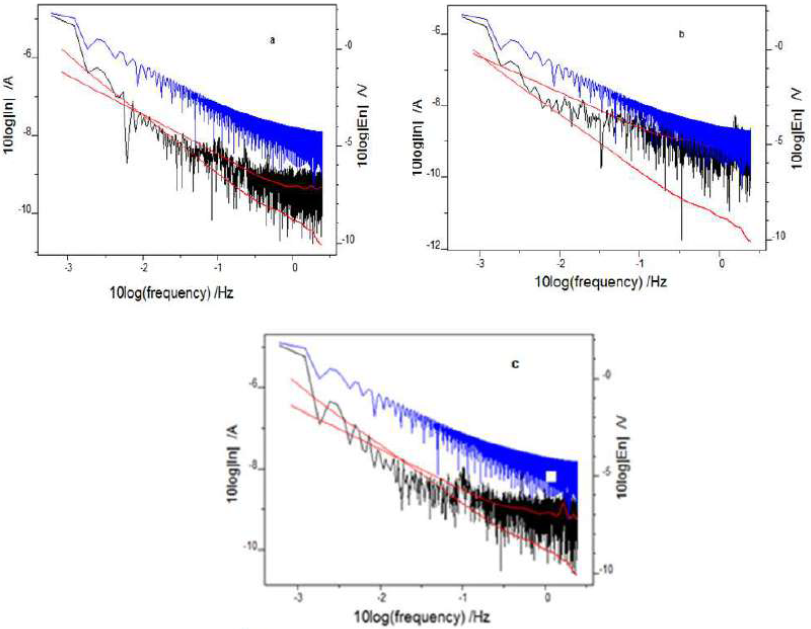
Figure 9 Power spectral density (current and voltage) of CS: (a) without inhibitor; (b) with I3A2AT; and (c) with T2CDACH, in 1 M HCl, at 1 mM concentration.
PSD advantage is that it is independent of time, and its signal statistics do not alter with it 30-32. Fast FTIR was adopted to convert time-dependent ECN data into PSD plots, using Ivium software. The ECN signals frequency can be monitored with the help of PSD plots. To improve the spectral resolution, Burg introduced a maximum entropy method (MEM) for short time records. Mathematically, this method makes some assumptions about unmeasured data, which are consistent with the existing data. The red lines shown in the fast FTIR spectrum of various CS specimens depict MEM curves.
Current and potential ECN of the uninhibited CS specimen were higher than those of the inhibited specimens. The ECN magnitude was significantly lowered with the frequency. The potential ECN signal higher amplitude indicated appreciable localized metallic corrosion on the uninhibited CS surface 33. After analysing the PSD plots and MEM curves, it was clear that the potential ECN magnitude values were very much higher for the uninhibited CS specimen than those for the inhibited ones. At all frequencies, potential and current ECN of CS treated with T2CDAC were lower than those of CS treated with I3A2AT, suggesting that the former molecule inhibits relatively well the metal dissolution in 1 M HCl.
The PSD plot slope is an important parameter that depicts the inhibitors molecules response towards the metal surface. A considerable change in the magnitude of a PSD plot slope is a measure of the metal dissolution degree 34,35. Though the PSD curves slopes almost remained unchanged for inhibited CS, a significant change in the PSD plots slopes was noticed for the uninhibited metal.
Also, the pitting index values of I3A2AT and T2CDACH were greater than those of the corresponding uninhibited solutions, which indicates resistance to corrosion.
Adsorption studies
The studied Schiff’s bases inhibition mechanism can be explained by the adsorption process and resultant surface modifications on the MS surface 35-39. It can be described by invoking suitable adsorption isotherms, such as Langmuir’s, Temkin’s, Frumkin’s and Freundlich’s isotherms.
The adsorption parameters were calculated by selecting the best-fit isotherm model assisted by the correlation coefficient (R2).
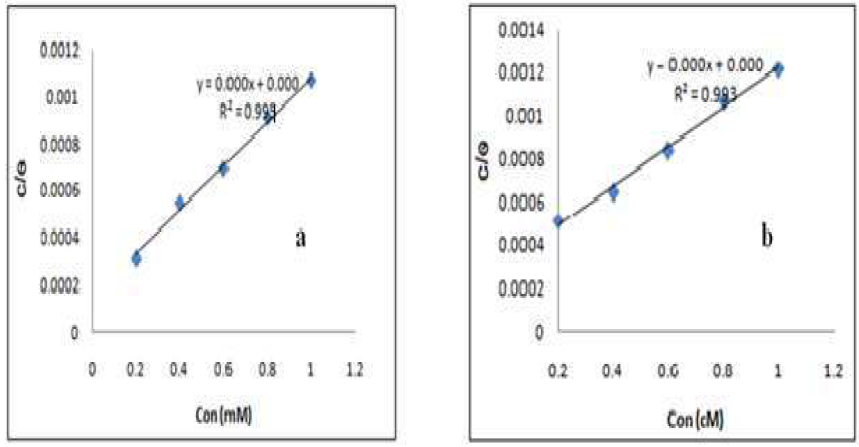
Fig. 10 represents the Langmuir’s adsorption isotherm for I3A2AT and T2CDACH, in 1 M HCl, which can be expressed as:
where C is the inhibitor concentration, θ is the fractional surface coverage and Kads is the adsorption equilibrium constant value.
The adsorption equilibrium constant, Kads, mainly depends on the standard free energy of adsorption, ∆G0 ads, by the relation:
where 55.5 is the molar concentration of water, R is the ideal gas constant and T is the temperature in Kelvin.
The derived adsorption parameter values are listed in Table 5.
The adsorption equilibrium constant, Kads, represents the measurement of the adsorption taking place on the corresponding surface. The above data show that I3A2AT has a higher Kads value than that of T2CDACH, which establishes the greater adsorption efficiency of the former. The ∆G0 ads values obtained for I3A2AT and T2CDACH are -37.08 and -30.37 kJ/mol, respectively. The ∆G0 ads values up to -20 kJ mol-1 clearly indicate the electrostatic attraction or physisorption between the charged molecule and the charged metal surface, whereas those lower than -40 kJ mol-1 indicate the inhibitors action on a metallic surface through strong co-ordinate bonds or chemisorption. In the present study, both inhibitors exhibited ∆G0 values between -20 kJ mol-1and -40 kJ mol-1, which indicates that the inhibitors absorption behaviour involved chemical and electrostatic interaction.
Surface morphological studies
The MS surface morphology was evaluated with the aid of SEM analysis 40,41. Fig. 11(a)-11(d) shows the magnified surface images of MS: bare; immersed in HCl; and immersed in HCl with I3A2AT and T2CDACH (1 M), for 24h.
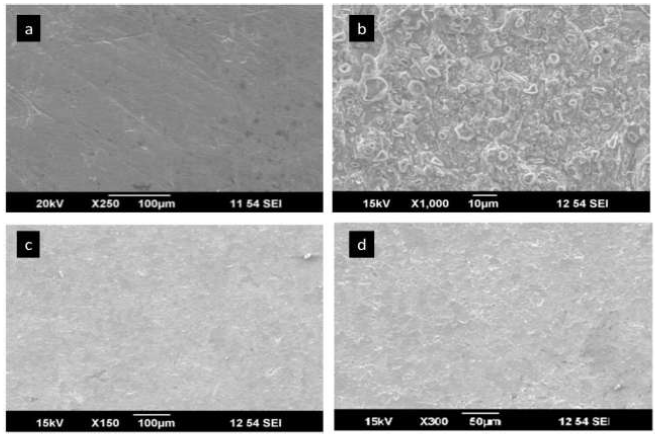
Figure 11.SEM images of CS: (a) bare; (b) in 1 M HCl; (c) in 1 M HCl with I3A2AT (1 mM); and (d) in 1 M HCl with T2CDACH (1 mM), for 24hrs.
The textures of all surface images showed considerable differences. The bare MS pits were due to the polishing effects. The roughness of the MS specimen in HCl was caused by severe corrosion. A smoother MS immersed in HCl with I3A2AT (1mM) and T2CDACH (1mM) resulted from the corrosion prevention by the inhibitors molecules adsorption onto the metal.
Quantum chemical studies
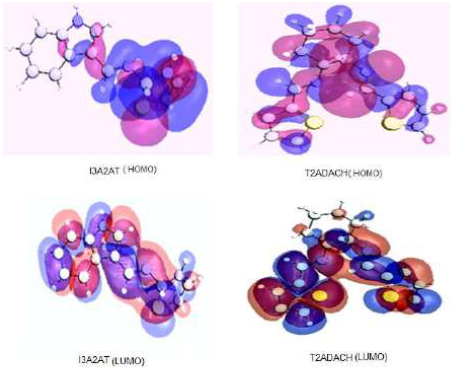
The corrosion inhibition response of organic molecules can be correlated with the frontier molecular orbitals energy. The donor-acceptor interactions (HSAB concept) between the inhibitor molecules filled molecular orbitals and the Fe atoms vacant d-orbitals on the metal surface are very important for the metal dissolution prevention. HOMO gives information on the atomic orbital with the highest contribution and, therefore, about the atom that has the highest tendency to donate electrons. Since it is spread throughout the compound, it is necessary to examine its coefficients, for a better understanding. LUMO is the unoccupied orbital that has the lowest energy, and it indicates the regions in a molecule which have the highest tendency to accept electrons from an electron-rich species.
HOMO energy (EHOMO) provides information about the tendency of a molecule to donate electrons to an electron-poor species. The higher the EHOMO, the greater is the tendency of a molecule to donate its electrons to the electron-poor species. Therefore, a comparison among the EHOMO of the studied compounds indicates the molecules that have the highest tendency to donate electrons to the metal.
The highest and lowest EHOMO values, and the energy difference between HOMO and LUMO (∆E), are important quantum chemical parameters that facilitate the strong molecule binding on the metal surface. Molecule and quantum chemical calculations geometry optimisation was performed by the DFT method, using GAMMES software. The B3LYP method was employed in DFT calculations 42,43. Fig. 12 shows HOMO and LUMO of the studied compounds.
Table 6 shows the inhibitors quantum chemical parameters which establish that I3A2AT has a higher EHOMO than that of T2CDACH, implying that it has the greater tendency to donate its electrons to the metal surface and, therefore, strongly bind on it. These results are in good agreement with the experimental data.
∆N indicates the tendency of a molecule to donate electrons. The higher the ∆N value, the greater is the tendency of a molecule to donate electrons to the electron-poor species. In the case of corrosion inhibitors, a higher ∆N implies a greater tendency to interact with the metal surface through the adsorption process. I3A2AT has a higher ∆N value than that of T2CDACH.
According to Lukovits 44,45, if ΔN < 3.6, (w% is increased, with a higher electron-donating ability at the steel surface. In this study, the synthesised inhibitors were the electrons donors, and the MS surface was the electrons acceptor. This result supports the assertion that the inhibitors adsorption onto the MS surface can occur based on donor-acceptor interactions between the compound π electrons and the metal surface vacant d-orbitals.
The dipole moment (μ) is also a significant factor, although there is lack of agreement on the relation between it and the inhibitive performance. Some researchers founded that a low μ value will favour the inhibitor accumulation on the metal surface, increasing its performance 46.
Other researchers suggested that a μ high value, associated to the inhibitor dipole-dipole interaction with the metal surface, can enhance the former adsorption onto the later, and increase its efficiency. In the present work, the I3A2AT μ value was lower than that of T2CDACH, which agrees with the first assumption. According to these inhibitors structures, there are free electron pairs on N and S, which enable to form a σ-bond with Fe. In addition, in HCl case, an electrostatic interaction is possible between the negatively charge Fe surface, which may be brought about by the Cl− anions specific adsorption, and the positively charged inhibitor. The inhibitors essential effect is due to the presence of free electron pairs in the N and S atoms, p-electrons on the aromatic ring, the type of interaction with the MS surface, and its complexes formation. It is well known that MS has a potential coordination affinity towards N and S donors Schiff’s bases. Therefore, the inhibitors adsorption onto the MS surface can be ascribed to the coordination through their heteroatoms and π-electrons of the aromatic rings 47-49. In the present case, the synthesized inhibitors had unshared electron pairs on N and S, which enabled them to coordinate with MS.
Conclusion
Two novel Schiff’s bases, I3A2AT and T2CDACH, are very effective corrosion inhibitors for CS in a HCl medium. (w% of both ligands has exceeded 95%, which may be due to the highly polarisable S atom, the lone pair of electrons on the N atom, the aromatic rings and the azomethine linkage.
The corrosion monitoring studies revealed that I3A2AT (w% was greater than that of T2CDACH, at all concentrations. T2CDACH decreased (w% may be due to the puckered nature of its aromatic ring. Both inhibitors obeyed Langmuir’s adsorption isotherm on the CS surface, during the inhibition process. The inhibitors mainly delayed the corrosion process by hindering the cathodic process. The I3A2AT and T2CDACH role in preventing CS localized corrosion in HCl was verified by ECN studies. Quantum chemical studies differentiated the molecules protective power. MS surface analysis by SEM and IR portrayed the inhibitors anticorrosive mechanism.


