Introduction
Over the past three decades, MIPs have attracted broad interest from scientists engaged in sensors development. In the recent years, MIPs have proved that they are important materials for the design of new analytical methodologies, because they are selective molecular recognition phases 1. MIPs can be tailored for different target analyses 2-4, and required templates are possible to obtain by using highly cross-linked co-polymers. Hence, MIPs are selective for the detection of a variety of analyte molecules. Depending upon the nature of the involved chemical bonds, MIPs synthesis techniques can be executed either by covalent or non-covalent imprinting 5. Non-covalent imprinting is widely preferred, due to its flexibility in the choice of functional monomers and template molecules. The main non-covalent interactions are hydrogen bonding, ion-pairing or π-π interactions. The combination of strong hydrogen bonding interactions with MIPs will create imprinted polymers with specific recognition properties.
MIPs have the potential advantage of being able to be used in place of natural receptors and enzymes, due to their superior stability, low cost and easiness of preparation. The principle in such imprinting is based on a process where functional and cross-linking monomers are copolymerized in the presence of a target analyte (the imprint molecule) that acts as a molecular template. Either reversible covalent bonding or non-covalent interactions between monomers and imprint molecules are expected in MIPs preparation. MIPs are also prepared by chemical grafting, soft lithography technique 6, molecular self-assembled approach 7, electropolymerization (EP), at an electrode surface 8 and other methods. The salient features of these techniques are the easy adherence of the polymeric films to the surface of the conducting electrodes of any shape and size, and the ability to control the films thickness under different deposition conditions 8. Various types of electro synthesized polymers based on molecular imprinting have been reported in literature, such as poly(o-phenylenediamine) 8, polyphenol 9, p-Py 10 and aniline copolymer with o-phenylenediamine 11.
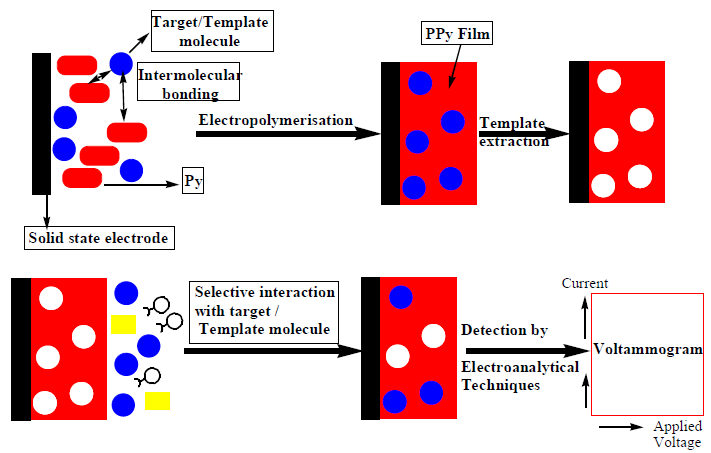
Among many polymers, such as polyphenols, poly-methacrylic acid, polyaniline and some metal organic frameworks, p-Py films are the most advantageous, because of their easy in-situ EP at the electrode surface, with or without the template molecule. Moreover, the p-Py film is rapidly formed without the aid of any cross-linker agent, and, due to its conducting ability and properties, the template extraction and rebinding is electrochemically feasible. Besides, it leads to chemically and mechanically robust films. In MIPs fabrication or preparation, Scheme 1 was commonly followed, irrespectively of the template molecule and EP technique.
Py, as an electroactive monomer, was utilized by different researchers to fabricate MIPs for determining different target compounds in a variety of real samples. The synthetic schemes and analytical procedures are reviewed and presented herein.
Py based MIPs
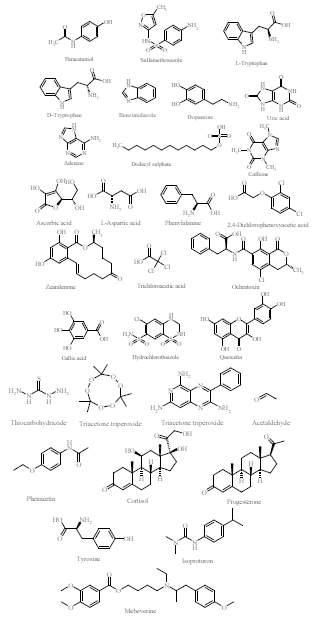
Fig. 1 shows the chemical structures of several compounds that are determined by Py-based MIPS, such as Paracetamol (PAM), which is a medication commonly used to treat pain and fever.
The preparation and use of a PAM-MIP sensor, using Py as a monomer, was described by Özcan and Sahin 12. Differential pulse voltammetric (DPV) technique was employed for PAM determination in tablets, using a MIP coated pencil graphite (PG), a Pt-wire and Ag-AgCl, as working, auxiliary and reference (WE, AE and RE) electrodes, respectively.
The p-Py film was prepared by Py cyclic voltammetric (CV) deposition, with LiClO4 (lithium perchlorate) as the supporting electrolyte (SE). The film was electrodeposited on the PGE surface. The CV operation was done in the potential range from -0.60 to +0.80 V, during four cycles, at a scan rate of 100 mV/s, in aqueous solutions of 0.1 M LiClO4, 0.05 M Py and 0.02 M PAM. After the EP process, the embedded PAM was extracted, so that a surface complimentary in shape and functionality to that of the original template was obtained. Then, the imprinted polymer was conditioned in a mixture of 0.1 M KCl and a 0.05 M phosphate buffer solution (PBS), at the potential range from -0.6 to +1.00 V. The obtained MIP-coated PGE was used to determine PAM in tablets extracts and syrups. This technique was found applicable to determine PAM, at an optimum pH of 7.0, in the concentration range from 5 μM to 0.5 Mm, with a correlation coefficient (r) of 0.9960, and a limit of detection (LOD) of 0.79 μM. However, this method was not selective to determine PAM in dopamine, phenacetin, ascorbic acid, phenol and D-glucose presence, due to their possible interference by oxidation.
The use of a p-Py imprinted-PGE sensor, for ascorbic acid (AA) (Fig. 1) determination in commercial pharmaceutical samples, has also been reported by Özcan et al. 13. 0.025 M Py was used for EP, by CV, on to the PGE. The EP process was performed in the potential range from -0.60 to +0.80 V, during seven cycles, at a scan rate of 100 mV/s, using an aqueous solution of 0.1 M LiClO4 as SE, 0.025 M Py as monomer and 0.020 M AA. The pharmaceutical samples analyses, namely tablets and syrups in the form of solutions, in the concentration range from 0.25 to 7.0 mM AA, were carried out by DPV measurements, using Pt and Ag-AgCl as AE and RE, in 0.1 M KCl and 0.05 M PBS, with pH 8.5. The electrolytic solution was purged with nitrogen (N), for 5 min, to eliminate oxygen atmosphere.
The DPVs, in the potential range from -0.30 to 0.40 V, were recorded at a step potential of 8 mV, a MA of 50 mV and a scan rate of 15 mV/s, at room temperature. The r and LOD were 0.9946 and 7.4 × 10⁻⁵ M, respectively. It was found from the investigation that the MIP sensor selectivity was lowered for AA measurement, with dopamine, D-glucose and uric acid. At a 0.50 mM AA concentration, a current of 50 μA was expected, but with 0.5 to 5.0 mM of interfering species, the measured current varied from -10.4 to + 5.56 μA.
A report on the preparation and use of Py imprinted MIP as an electrochemical sensor for SMX determination (Fig. 1), a sulphonamide group of an antibacterial drug, was made by Ozkorucuklu et al. 14. A 3 cm GP was soldered with a metal wire, washed with acetonitrile (C2H3N), dried at room temperature, and used for EP. The GP was subjected to five cycles of 1 M Py CV electrodeposition, in the potential range from -0.60 to +1.40 V, at a scan rate of 100 mV/s. The SE was 0.1 M tetrabutylammonium perchlorate (TBAP), and the concentration of sulfamethoxazole (SMX) as recognition material was 5 mM, in C2H3N. After obtaining, by extraction, the MIP complementary surface and functionality, it was repeatedly over-oxidised in a 0.1 M NaOH solution, in the potential range from +0.80 to +1.20 V, at a scan rate of 50 mV/s, and used for SMX determination by DPV. The SMX stock solutions, with concentrations in the range from -0.25 to 0.75 Mm, were prepared in 50% v/v C2H3N: water, adjusted to a pH of 2.5, using a Britton-Robinson (BR-BS) (mixture of 0.04 M each of boric, acetic and phosphoric acids), and subjected to DPV measurements. Voltammetric measurements were carried out at room temperature, in a potential range from 0.00 to 1.40 V, at a scan rate of 15 mV/s, a MA of 50 mV and a step potential of 8 mV, using the three electrode system, as described above. The r value of the calibration line between concentration and current was 0.9993, and the sensor LOD was 3.5 × 10⁻⁷ M. This MIP sensor was used for SMX determination in pharmaceutical samples such as tablets and syrups. The SMX recoveries from tablets and syrups were found to be 96.0 and 87.4%, with the relative standard deviations (RSD) values of 0.90 and 0.85%, respectively. Although the authors described the use of the PGE MIP sensor for SMX sensitive determination, they did not present the results of interference studies.
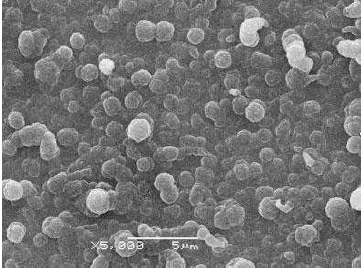
Kong et al. 15 proposed and published a work on the preparation of a p-Py MIP for the molecular recognition of L-tryptophan (L-Trp) or D-tryptophan (D-Trp) (Fig. 1) enantiomers. A p-Py thin film was prepared by EP and over-oxidation (o-o) methods. Two platinum (Pt) and one saturated calomel (SC) electrodes were used in Py electrodeposition. This process was done at 0.8 V, in a solution containing 0.1 M Py, 0.1 M NaCl and 4 mM L-Trp (6.5 pH), for 150 s. The p-Py-L-Trp films were over-oxidized in a 0.1 M NaOH solution, for 10 min, by applying a constant potential of 1.0 V. The thin film was also subjected to a Scanning Electron Microscopic (SEM) investigation, for acquiring the information on a p-Py with 1-2 μm uniform particle size. The SEM image is shown in Fig. 2.
The enantio-selectivity of the over-oxidised-p-Py (o-o-p-Py) films was determined by immersing the MIP electrode in a 0.1 M NaCl aqueous solution containing 2 mM L-Trp (or D-Trp), under open-circuit conditions, for 25 min, to enrich the latter. Then, stripping voltammetry experiments were performed to detect enriched Trp in the imprinted over-oxidized (o-o-p-Py) films. Besides, the electrochemical quartz crystal microbalance (EQCM) experiment was also performed; the results revealed that the p-Py film, made of L-Trp templates, was formed on an 8 MHz gold (Au)-coated crystal that was mirror finished, with an exposed area of 0.196 cm2. The Au-coated crystal, a Pt foil and SCE were used as WE, AE and RE, respectively. Herein, CV operation was done for the Au surface activation in 1 M sulphuric acid (H2SO4), in the potential range from -0.2 to 1.5 V vs. SCE, until a reproducible voltammogram was obtained 16. The obtained p-Py was washed with water, over-oxidised in 0.1 M NaOH, and used for further application. It is evidenced by EQCM that the mass change (Δm) of the imprinted o-o-p-Py films resulted in the conversion of the resonant frequency shift (Δf). Also, it was revealed by the change in EQCM frequency (Fig. 3), with the addition of 2 mM L-Trp and D-Trp, at pH 5.0, for Au surfaces modified with imprinted o-o-p-Py, that the first enantiomer was more effectively embedded into them than the second. In L-Trp presence, the EQCM frequencies fell sharply in the first 250 s, and continued to decrease almost linearly with time, after this period. However, in D-Trp presence, they remained almost unchanged. This is powerful evidence that the L-Trp-imprinted o-o-p-Py films have more complementary cavities than those for D-Trp, which makes these p-Py MIPs effective tools for enantiomers recognition.
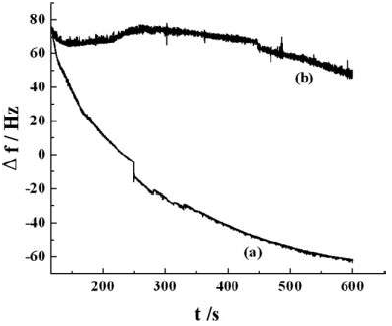
Figure 3 EQCM frequency change curves of MIP-o-o-p-Py, in the presence of 2 mM (a) L-Trp and (b) D-Trp, at pH 5.0, for modified Au surfaces.
Azizollah et al. 17 have reported the preparation of p-Py based MIPs for benzimidazole (BZI) (Fig. 1) detection in biological samples. The MIP for BZI determination was prepared by EP and Py electrodeposition on a PGE, using the former as a template molecule. The CV procedure followed p-Py film EP and deposition on the PGE, using Pt and silver-silver chloride (Ag-AgCl) as AE and RE, respectively. The electrodeposition was executed in the potential range from -1.0 to 1.9 V, during 25 cycles, at the scan rate of 100 mV/s, in the aqueous solution of 0.1 M NaClO4, 0.02 M Py and 2.5 mM BZI. The BZI embedded from the electrode was extracted to make the surface complementary in shape and functionality, like the original template. The obtained BZI-p-Py MIP was conditioned using a BRBS of pH 5.0, by DPV scanning, in the potential range from 0.1 to -0.9 V, and, thereby, the template was removed from the polymer interior. DPV techniques were used to detect BZI under room temperature in real biological samples, by measuring the current in the potential range from 0.1 to -0.9 V, with the instrumental parameters of 8 mV step potential, 50 mV modulation amplitude and 16 mV/s scan rate. The real samples of beef, turkey, chicken, lamb and fish meat were subjected to pre-treatment 18, spiked with BZI, and the current was measured by DPV. Due to BZI oxidation and concentration, the calibration curve between the generated current was found to be linear, from 3 × 10⁻⁶ to 5 × 10⁻³ M, with the r value of 0.9920. The LOD was 7 × 10⁻⁷ M. The synthetized sensor showed an acceptable selectivity for BZI determination, in the presence of 2-amino benzimidazole, aniline, methimazole, thiocarbohydrazide (TCH) and 4-(dimethylamino)-pyridine. However, thiourea and thioacetamide were found to be interfering species, since the BZI currents were measured in their presence. This interference was assumed to be caused by the formation of a hydrogen bonding between thiourea and thioacetamide electronegative amine and S and the MIP p-Py sites 12.
The Py MIP electrochemical sensor was designed by Kan et al. 18, for dopamine (DA) determination (Fig. 1). Glassy carbon (GC), electrodeposited by a carboxylic functionalised multi-walled carbon nanotube (MWCNT-COOH), SC and a Pt wire, were used as WE, AE and RE, respectively, for DPV measurements. Multi-walled carbon nanotubes (MWCNTs), with diameters from 10 to 30 nm and lengths from 1 to 2 μm, were used in the sensor fabrication. 0.5 g of crude MWNT was sonicated with 60 mL of HNO3, for 10 min. Then, it was stirred at 85 ºC, for 4 to 5 h. After being cooled to room temperature, the mixture was separated by vacuum filtration, and washed thoroughly with distilled water, several times, until the pH was adjusted to a neutral value. This process resulted in MWCNT-COOH, as a product. The bare GC was polished with 0.3 μm Al slurry on micro-cloth pads, and sequentially sonicated in water. Then, the MWCNT-COOH was deposited onto the bare GC surface by chronoamperometry (CA), at +1.7 V, for 400 s, in a solution with 0.3 mg/mL MWCNT-COOH. This process produced a MWCNT-COOH-modified GC electrode (MWCNT-GCE). The resulting MWCNT-GCE was immersed into a 0.1 M LiClO4 solution containing 0.026 M Py and 0.02 M DA. The CV operation was performed in the potential range from −0.80 V to +1.00 V, for 5 cycles, at the scan rate of 100 mV/s. In this way, the modified MWCNT-GCE polymer was obtained.
Subsequently, the embedded DA was extracted by scanning it in the potential range from −0.6 to +1.00 V, in 0.1 M KCl and 0.05 M PBS, at pH 7.0, for several cycles, until it showed no obvious oxidation peaks. This process created a molecularly imprinted multi-walled nanotube glassy carbon electrode (MIPs-MWCNT-GCE).
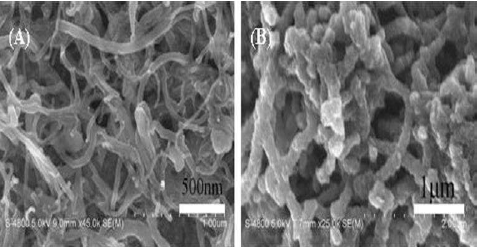
The structural morphologic distinction between MWCNT-GCE and MIP-MWCNT-GCE was observed by SEM (Fig. 4c). The resulting images reveal that MWCNT-COOH was distributed onto the GCE surface, forming a three-dimensional network structure, which enabled the MWCNT-GCE to have a much higher specific area (Fig. 4A).
However, the MIP-MWCNTs-GCE size was much larger than that of the unmodified electrode (Fig. 4B). The MWCNT-COOH complete wrapping and the network rougher surface showed that MIPs were uniformly deposited onto MWCNT-GCE.
The DA quantification was carried out by the DPV technique. The currents were measured in the potential range from -0.2 to 0.6 V, using PBS and 0.1 M KCl as SEs. It was found, from the resulting voltammograms, that the oxidation peak currents were linearly related with the DA concentration in the range from 6.25 × 10⁻⁷ to 1× 10⁻⁴ M, with an r of -0.996. The LOD of this analytical method was found to be 6.0 × 10⁻⁸ M DA.
The calibration ranges and LODs of various sensors 19-32 were compared with those of the proposed MIP-MWCNT-GCE. It was confirmed by the results that MIP-MWCNTs-GCE is applicable for wider linear dynamic ranges, with lower LODs for DA. This low cost sensor was proposed for DA measurement in clinical and pharmaceutical samples.
An article by Spurlock et al. 33 studied the use of o-o-p-Py as a functional monomer for the fabrication of MIP templates with adenosine (ADN), inosine and 5’-adenosinetriphosphate (ATP), for the determination of Ru(NH3)6 3+, uric acid and adenine (Fig. 1). The MIPs were developed by growing an ultrathin film of o-o-p-Py on GC. GC, Pt and a SCE or Ag wire were used as WE, AE and RE, respectively, in the experimental set up. The electrode areas were determined by chronocoulometry, with 3 x 10⁻³ M K3Fe(CN)6 in 0. 1 M KCl.
In CV experiments, the peak current was measured as a function of the scan rate, at analyte concentrations of 2.5 × 10⁻⁴ M in a 0.5 M PBS (pH 7.0). The scan range was from 0.020 to 0.200 V s-1. CV scan limits were from 0 to -0.5 V +, 0 to 0.5 V and 0 to 1.2 V, for Ru(NH3)6 3, uric acid and adenine, respectively.
The potentials (vs. SCE) used in the measurements were ca. -0.30 V, 0.35 V and 1.0 V, for Ru(NH3)6 3+, uric acid and adenine, respectively. The ultrathin micro electrode was prepared by Py EP in a 0.020M C2H3N and 0. 1 M TBAP solution, on GCE, at 0.900 V, using Ag wire as AE. EP was initiated by chronocoulometry, with a potential step from 0.650 to 0.900 V vs. Ag wire. The o-o-p-Py was obtained by p-Py o-o, at pH 7.0, using a 0.5 M PBS, at 0.950 V against SCE. The p-Py was templated with ADN, inosine and ATP, by EP of 3 x 10⁻³ M Py on GCE, from 80% methanol, and 0.1 M TBAP with 3 × 10⁻³ M ADN or inosine, forming p-Py-ADN and p-Py-inosine, respectively.
To obtain p-Py-ATP, 3 × 10⁻³ M Py were submitted to EP from water with 0.010 M ATP. p-Py films were over-oxidized 4 times, at 0.950 V vs. SCE, to form o-o-p-Py-ADN, o-o-p-Py-inosine and o-o-p-Py-ATP, with ca. 5 min required for the current to reach a steady state. The template formation was ascertained by an UV absorption experiment for o-o-p-Py-ATP.
The ATP absorption in to the pH 7.0 BFS was measured as 260 nm, in the concentration range from 5.0 × 10⁻⁴ to 1.0 × 10⁻⁶ M. The molar absorption coefficient value was reported to be 1.41 × 10⁴ M-1/cm-1. The apparent sensor diffusion coefficients were calculated by the rotating disk electrode technique. The fabricated sensors sensitivities, for Ru(NH3)6 3+, uric acid and ATP, were also reported. The sensors were found to be a superior group of electrodes for the compounds potentiometric detection. However, the article did not present the calibration data obtained from the experiment for the three analytes determination.
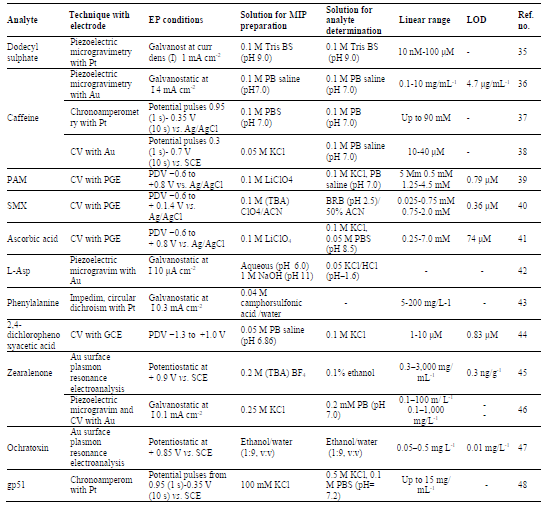
A review article by Sharma et al 34) presented the work of different researchers on MIPs fabricated using Py for the determination of various analytes, viz dodecyl sulphate, caffeine, PAM, SMX, ascorbic acid, L-aspartic acid, phenylalanine, 2,4-D, Trp, zearalenone, trichloroacetic acid, ochratoxin (Fig. 1), bovine leukemia virus (BLV) and glycoprotein gp51, by piezoelectrogravimetry, CA, impedimetry or CV electroanalytical techniques.
The review described required EP conditions for each MIP sensor, the procedures for their preparation, analytes linear concentrations ranges for determination, and sensors LODs. This article revealed the wider application of p-Py MIP for the determination of diverse compounds of different origins. The details are shown in Table 1.
Table 1 Performance characteristics of p-Py imprinted polymer (p-Py-MIP) chemosensors, using Py as a functional monomer.
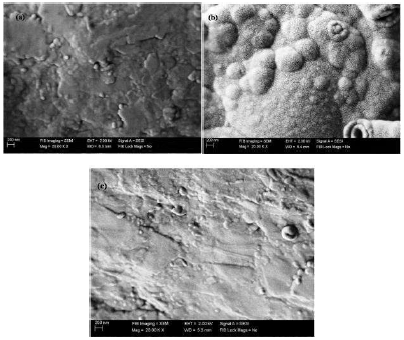
PPy material was also used to imprint into a GC polymeric surface and was used for gallic acid (GA) (Fig. 1) determination 49. This article describes a procedure for MIP preparation using electro-polymerised Py by CV. The electro-polymerisation was performed using CV in the presence of an aqueous solution of 0.1 M NaClO4 and 0.05 M Py, with and without a template molecule on to GCE. A polished GCE was immersed into a polymerisation solution of 0.1 M NaClO4, 0.05 M Py and 0.020 M GA. The PPy film was deposited onto GCE by CV, at a potential range from −0.6 and +0.95 V. for five cycles, at a scan rate of 0.1 V/s−1. The GA was extracted and its impression was left on GCE. This modified electrode was then used to detect GA in samples, after a suitable conditioning in a solution of 0.1 M KCl and 0.05 M PBS by CV, over the potential range from −0.6 to +1 V (one sweep at 0.1 V/s−1). The electrode was evaluated using DPV in a solution of 0.1 mM GA in 0.05 M PBS with 0.1 M KCl. The fabricated MIP characterisation by SEM was also reported.
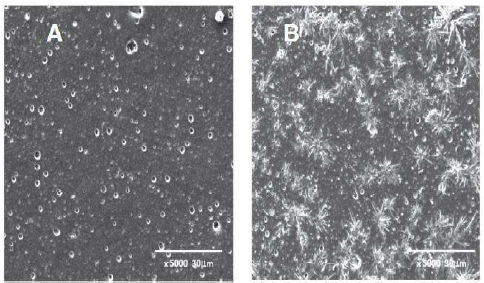
The differential SEM images between NIP and MIP are shown in Fig. 5, and they clearly show that p-Py-GA electrodeposition has a very different morphology from that of the p-Py, under identical conditions.
The monomer concentration, EP time, scan rate, and other parameters effects on MIP functioning were optimised. This MIP sensor is applicable for GA determination, in the concentration range from 0.1 to 2 mM, with an r of 0.993, by DPV, using GCE- p-Py-GA MIP, Pt and Ag-AgCl/NaCl as WE, AE and RE, respectively. The electrochemical behaviour during EP was observed by CV. In CVs, the peak potentials, with and without GA, were 0.1 and -0.15 V, respectively, and this confirmed that the template was part of the polymeric chain. This MIP sensor is advantageous, due to its ease of construction, handling and performance characteristics. Thus, it suits the requirements for GA determination in real samples.
Hydrochlorothiazole (HCT) (Fig. 1) is a diuretic drug from the benzothiadiazine class. HCT is used to treat hypertension, either alone, or in combination with other drugs. The fabrication of a MIP-based electrochemical sensor, using electropolymerized Py in HCT presence onto the PGE surface, was described by Azizollah and Maliheh 50. The prepared sensor was characterized by SEM. The influences of several parameters on the sensor efficient response were investigated using multivariate methods. The authors reported MWC preparation on to the PGE (MWCNT-PGE), by CA, followed by the MIP sensor fabrication for HCT. The prepared MWCNT-PGE was immersed into a solution containing 0.1 M NaClO4, 0.02 M Py and 0.01 M HCT. The CV using Pt and Ag-AgCl, as AE and RE, respectively, was performed from +0.60 to +2.00 V, for 10 cycles, at a scan rate of 100 mV/s-1, to obtain electropolymerized MWCNT-PGE. Subsequently, the embedded HCT was extracted by scanning it from +0.75 to +1.75 V, at a scan rate of 16 mVs-1, in a BR-BS of pH 2.7, for several cycles, until no obvious oxidation peak for HCT could be observed in the resulting CV. As a control, a NIP without HCT was also prepared in the same manner, by the EP process. The MWCNT-PGE MIP and NIP, with and without HCT, respectively, were subjected to SEM analysis, and the obtained images gave the outcome of HCT proper imprinting into the MWCNT-PGE. The CV experiment was performed for the HCT solutions calibration, at the concentration range from 1 × 10⁻⁵ to 1× 10⁻² M, and the oxidation peak currents recording. The obtained peak currents were in linear function with HCT at the above concentrations range, with the r value of 0.9921. The HCT concentrations in pharmaceutical solutions prepared by using tablets and serum samples were determined by calibration curves. The hall mark of this work is the use of Plackett-Burman design for the optimization of significant parameters that affect the electrodes performance ability.
Quercetin (QCT) (Fig. 1), a natural flavonoid, used as an anticancer, anti-allergic, anti-inflammatory and antiviral drug, was electro analytically determined by using the p-Py based MIP sensor 51. The article describes the MIP preparation by imprinting QCT onto the modified GCE. A composite of β-cyclodextrin (β-CD), Au-nano particles (AuNPs) and graphene (GR) was prepared and used to modify the GCE. The QCT template MIP was prepared by immersing β-CD-AuNPs-GR-GCE into the aqueous solution of 1.0 × 10⁻⁴ M QCT, 1.0 ×10⁻² M Py and 0.1 M KCl. The pH was adjusted to 7, by adding a citric acid and sodium citrate buffer solution (CASCBR), and the CV was performed at the scanning rate of 100 mV/s, for 15 cycles, under a potential range from -0.2 V to 1.0 V, to complete the EP. The electrode was then immersed into a solution of 0.5 M NaOH, and CV was operated at the scan rate of 100 mV/s, for 15 cycles, under a potential range from -0.2 V to 1.0 V, to extract the QCT template. This yielded the QCT MIP-β-CD-AuNPs-GR-GCE. The obtained MIP was used to determine QCT, in a CASCBR of pH 4, at room temperature, by DPV. In addition to the MIP-β-CD-AuNPs-GR-GCE sensor, the MIPs of AuNPs-GR-GCE, GR-GCE and GCE were also prepared and characterised in the same manner. In the QCT quantification, the DPV was executed over the potentials range from 0.0 to 0.4 V, at a scan rate of 100 mV/s. MIPs selectivity was evaluated using luteolin, primuletin and apigenin, as controls. The results of various experimental parameters optimisation, and MIP characterisation by CV and SEM, were reported. The article also described the different electron-transfer resistance of various modified electrodes investigated by electrochemical impedance spectroscopy (EIS), with K3Fe(CN)6 as the redox probe. Fig. 6 shows the resulting EIS curves for different MIPs used for QCT determination.
The MIP-β-CD-AuNPs-GR-GCE sensor, obtained after Py EP, has hindered the pathway for the electron transfer within the polymers, which was revealed by the C curve. This implied the perfect QCT imprinting over the modified electrode. The responses of these different MIPs were checked by DPV, and the resulting voltammograms are shown in Fig. 7. The DPV shows that the MIP-AuNPs-β-CD-GR-GCE sensor for QCT was the most efficient one, with the largest peak current. Thus, this electrode, prepared by EP, using Py as a monomer, is the most suitable sensor for QCT quantification. The reported sensor is applicable for QCT determination, in the range from 5.0 × 10⁻⁹ to 1.0 × 10⁻⁶ M, with the regression coefficient value of 0.9998 and LOD of 1.0 × 10⁻¹⁰ M. The sensor was used to determine QCT, with a recovery from 97.6 to 102.1% of QCT tablets. The interference from the controls in the QCT peak currents measured by DPV was found negligible.
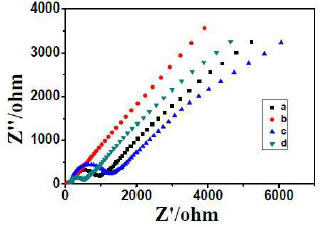
Figure 6 EIS of a. GCE, b. AuNPs-β-CD-GR-GCE, c. MIP-AuNPs-GR-GCE (with template molecules), d. MIP-AuNPs-GR-GCE (without template molecules), in CASCBR with 5 mmol/L K3[Fe(CN)6].
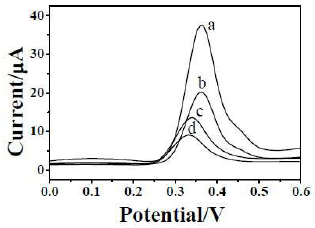
Figure 7 DPVs of a. MIP-AuNPs-β-CD-GR-GCE, b. MIP-AuNPs-GR-GCE, c. MIP-GR-GCE, and d. MIP-GCE, in 1.0 ×10⁻⁶ mol/L QCT with CASCBR.
A work on the design and optimisation of a computer-aided sensor for TCH analysis (Fig. 1), one of the important intermediates in synthetic chemistry, with anticarcinogenic and antibacterial properties, in biological matrices, using an electropolymerized modified PGE MIP, was reported 52. The TCH MIP was obtained by its electrodeposition on the PGE surface, using CV, in the potential range from -1.0 to 1.9 V, during 25 cycles, at the scan rate of 100 mV/s, in an aqueous solution of 0.1 M NaClO4, 0.02 M Py and 0.010 M TCH. The embedded TCH was extracted to make the surface complementary in shape and functionality to the original TCH template. The imprinted sensor was conditioned in a BR-BS, using DPV, by a potential scan in the range from 0.0 to 1.0 V. This process allowed the template remotion from inside the polymer. A non-imprinted polymer modified electrode was prepared under the same experimental conditions, but without TCH, to check the measurements reliability. Using PG, Pt and Ag-AgCl, as WE, AE and RE, respectively, DPV was performed to analyse TCH in the samples. DPV was performed at room temperature, over the potential range from 0 to 1.0 V, with 8 mV step potential and 50 mV MA, at a scan rate of 16 mV/s. The sensor was tested for its specific function, in the presence of some interfering substances, such as thioacetamide, thiourea, methimazole, ticlopidine hydrochloride and camphor. The obtained results indicated the non-interference from those compounds with the TCH current measurement. This MIP based electroanalytical sensor is highly selective, simple and suitable to determine TCH in human serum and meat samples, from 0.5 to 6 mM, with the r value of 0.9805. The slope and intercept of the calibration line were 1.798 and 4.336, respectively.
TATP (triacetone triperoxide) has been determined by a MIP with Py as monomer 53. TATP (Fig. 1) is one explosive that has become increasingly popular among terrorists, due to the ready availability of its starting materials and simple nature, although it is highly dangerous, with a complicated synthetic procedure. The MIP was prepared through 98.6% pure pre-synthesized TATP with electropolymerised Py onto GCE, by CV. The polished GCE was first subjected to five CV cycles, at a scan rate of 0.1 V/s−1, over a potential range from -0.1 to +1.5 V, in 0.05 M H2SO4. Then, five cycles, within a potential range from -1.2 to +0.2 V, in 1.0 M potassium hidroxide, and another five extra cycles, from -1.0 to +1.0 V, in 0.1 M KCl potassium chloride, were carried out. EP was carried out through GCE immersion into an electrolyte solution with 0.1 M Py, 0.1 M LiClO4 and 100 mM TATP, in C2H3N, as porogenic solvent. Py polymerisation and TATP entrapment were performed by CV, in the potential range from -1.0 V to +1.0 V, at a scan rate of 0.05 V/s−1, for 10 cycles, after the initial mixture purging with N gas, during 300 s. A single conditioning cycle, from -1.0 V to +1.0 V, followed by 5 min of WE equilibration, was carried out. After that, the electrode was scanned at a potential range from -1.0 V to +1.4 V, at a scan rate of 0.05 V/s−1, in an electrolyte solution containing 0.1 M KCl and a 0.05 M PBS. A fixed potential of +1.4 V was applied to the electrode immersed in 0.2 M dipotassium phosphate, for 10 min. After being dried with N gas, for 5 min, the sensor was ready to be used. DPV was done at a scan rate of 15 mV/s−1, MA of 50 mV and a step potential of 8 mV, at a potential range from -2.0 to +1.0 V. The calibration curve prepared by plotting the peak currents against TATP concentration was linear, at the range from 82 to 44300 μg/L−1, and the r value was 0.9964. LOD and LOQ values were 27 and 82 μg/L−1 TATP, respectively. MIP-GCE and GCE sensors were separately used to determine TATP. Their performance characteristics and results were compared with each other, and MIP-GCE was found to be more accurate, precise and selective than GCE. Piezoelectric quartz crystals and analogous Au substrates were used to electrolytically coat MIP-p-Py, and to analyse clofibric acid (CFA), a clofibrate metabolite, by pulsed amperometric detection (PAD) (Fig. 1) 54. The Py polymerisation by CV was performed in a potential range from -200 to 800 mV, and the resulting p-Py was coated over piezoelectric quartz crystals or glass coated wafers, in CFA presence, in aqueous KNO3 (potassium nitrate) or in a PBS (pH 7.0). The resulting sensor was thoroughly washed, dried with N gas and used for CFA determination.
The modified electrode was characterised by X-ray photoelectron spectroscopy. The surface investigation was undertaken by atomic force microscopy (AFM). The binding studies were performed by PAD, in a BFS and CFA, with a stopped flow. A sequence of five potential pulses, with a two-step waveform, was applied, for 1 s, at 0 V and 0.6 V, vs. the RE. The EQCM experiments were performed using Au-coated glass wafers, a Pt wire and Ag/AgNO3, as WE, AE and RE, respectively. The EQCM results revealed the sensor ability to detect varying CFA amounts. The selective functioning was assessed using 2,4-D and carbamazepine (CBZ) as interferents. The PAD results show MIPs higher responses than NIPs, to the CFA solution, but the non-specific binding amount was high. With an increasing number of cycles, the MIPs response decreased. This could be explained by the p-Py film thickness, which increased from ~16 nm, for 50 cycles, to ~23 nm, for 120 cycles, and to ~29 nm, for 240 cycles. A decrease in sensitivity and specificity, with an increase in the number of cycles, was also observed for other p-Py coated electrodes, which is explained by the slower diffusion of the analyte molecules through the recognition sites. Thus, the MIP-p-Py sensor is useful for CFA determination in real samples. Binding tests with 2,4-D and CBZ showed MIP pronounced selectivity for CFA vs. CBZ, but the response for the former was higher than that for the latter, presumably due to the structural similarities between the two molecules. Nevertheless, the non-specific binding was high.
The Py effective monomeric action in EP was utilised 55 to fabricate an electrochemical MIP based sensor for detecting triamterene (TAT) (Fig. 1), a diuretic drug, in pharmaceutical and serum samples. In this work, the authors used computational methods and multivariate optimization techniques, following two steps: density functional theory (DFT), and the fabrication of a MWCNT electrode by imprinting MIP onto a modified PGE.
The sensor voltammetric response was optimised by multi-variated techniques. The MWCNT was subjected to oxidation, functionalised to be converted into MWCNT-COOH, and modified by the sonicated MWCNT-COOH (0.36 g/L-1 in distilled water) immobilization, using the CA technique (1.7 V, 2000 s) on a PGE.
After being dried at room temperature, the MWCNT-PGE was immersed into a solution of 0.03 M Py, 0.01 M Tr and 0.1 M NaClO4 in DMSO.
Using a bare or modified PGE, Pt wire and Ag/AgCl, as WC, AE and RE, respectively, the MIP film was deposited by CV, in the potential range from 0 to 2 V, for 25 cycles. The NIP was also prepared without TAT. The TAT template was removed from the p-Py through DPV, by scanning it in the potential range from 0.95 to 1.35 V, at a scan rate of 16 mV/s-1, in a BR-BS of pH 5.
The fabricated TAT-MWCNTs-PGE MIP was characterised by SEM analysis, and the resulting images are shown in Fig. 8. The images reveal that the TAT-MWNTs-PGE MIP surface has a more porous and rough structure than that of NIP, and this confirms the effective polymer imprinting.
In DPV analysis, the loaded TAT-MWCNTs-PGE MIP was brought into a cell containing 15 mL of a BR-BS, with pH 5, and a standard TAT solution of the sample. DPV was run from +0.95 to +1.35 V, at the scan rate of 16 mV/s−1, applying the step potential of 8 mV, and maintaining the MA of 50 mV. The MIP is applicable to determine TAT in the concentration range from 0.08 to 265 μM, with a LOD of 3.35 nM. The MIP sensor was used to determine TAT in the serum sample, and the analysis obtained recovery values in the range from 98.07 to 104.25%. The TAT% recovery values from the tablets analysis ranged from 97.26 to 104.65. The studies on the interference by several drugs, such as piroxicam, tetracycline hydrochloride, hydrochlorothiazide, ibuprofen, pantoprazole sodium sesquihydrate and phenothiazine, were made by DPV, using a fabricated TAT-MWCNTs-PGE MIP. The characteristic peak current for TAT, with interferents, was almost the same to that obtained without them. The statistics of the MIP application for TAT determination in the serum and pharmaceuticals revealed its superiority, sensitivity and selectivity.
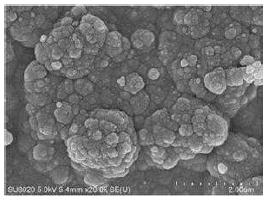
A chemiresistive MIP sensor using p-Py was developed by Debliquy et al. 56, for acetaldehyde (AcA) (Fig. 1) selective determination, a volatile and carcinogenic organic compound. Au interdigitated electrodes deposited on a silicon dioxide /silicon (SiO2/Si) substrate were used to deposit MIP by EP with Py. The pulse voltammetric cell was filled with a solution of 50 mL C2H3N (99.8% anhydrous), 0.62 g NaClO4, 0.335 mL Py monomer and 50 μL acetaldehyde, and it was electrolysed under the potential of 1.8 V, for 0.1 s, by maintaining 0 V during 0.1 s, with a total number of 4000 pulses. The molecular template extraction was carried out by dipping the samples in a mixture of acetic acid and methanol, for 8 h. The MIP film was characterised by SEM, from which authors inferred the cauliflower structure of the fabricated sensor (Fig. 9). The NIP was also prepared in AcA absence.
The electro analysis was performed by the EQCM technique, using MIP, Pt and Ag/AgCl, as WC, AE and RE, respectively. The electrodes and quartz crystals were placed in a gas cell, exposed to various AcA concentrations, in humid air (50% RH, at 22 ºC) tanks, using mass flow controllers, at a constant total flow of 1000 mL/min. The AcA curve resulted conductance vs. concentration revealed MIP significant response to its detection, which can be seen from the p-Py intrinsic low conductivity in AcA absence. Thus, this sensor is proposed to analyse samples containing AcA.
A MIP using Py has been reported for phenacetin (PA) (Fig. 1) detection 57, using GCE. PA is a widely used commercial compound, because of its antipyretic and analgesic properties. It has been extensively employed as an aspirin-phenacetin-caffeine analgesic APC tablet, for fever and pain mitigation. Herein, the authors reported the synthesis of a PA-selective MIP based sensor, by Py EP in 1:1 (v/v) water and ethanol, in HClO4. The MIP was able to preconcentrate one of the PA electrochemical oxidation intermediates, (acetaminophen), indicating the possibility of its monitoring. In this investigation, the authors used a GC electrode, after its modification by MIP, with Py as WE. Ag-AgCl and Pt wire were used as RE and AE electrodes, respectively. A GC electrode was polished with alumina and immersed into a voltammetric cell containing 1:1 (v/v) water/ethanol solution with 0.1 M HClO4, 12.5 mM Py and 25 mM PA. Py EP was made to deposit it, through CV, onto the GC electrode, by applying the potential range from -0.60 to 1.80 V, over five cycles, at the scan rate of 50 mV/s−1. Then, the modified electrode was immersed into a 1 M NaNO3 solution, and further scanned five times by CV, in the potential range from -0.6 to 1.8 V, at a scan rate of 50 mV/s−1. This obtained the MIP for PA determination. A NIP was also prepared in the same manner, but without the PA template molecule.
The electrochemical measurements were made by the CV technique using the developed PA-MIP. The analysis of the solution containing 25 mM PA in a 0.1 M HClO4 was carried out by running CV fifteen times, and recording the voltammograms in the potential range from -1.0 V to 1.8 V, at a scan rate of 50 mV/s−1. The selectivity was also checked using procaine and aminopyrine as interferents. Fig. 10 shows the 15 CVs recorded under the described conditions. Six peaks can be observed in the traces, four related to the oxidation process, and the other two to the reduction scan. As shown by the arrows, the currents of all six peaks increased with the number of consecutively recorded cycles, indicating that some of the molecules in the solution, or produced through chemical and electrochemical reactions, can be accumulated inside the polymer. PA electrochemical oxidation was described by the authors, who depicted the formation of various intermediates, being acetaminophen one of them. The formation of intermediates, according to the resulted voltammetric waves, was described. As shown in Fig. 10, the different intermediates, namely, A1, A2, A3, A3′ and C1 were described and named by the authors. The possible electrochemical conversions were explained.

Figure 10 CVs obtained with MIP-PA (A) in the absence (dashed lines, five cycles) and presence (solid lines, fifteen cycles) of 25 mM PA, under the proposed conditions. (B) Emphasis on the voltammograms obtained without 25 mM PA (dashed line), and on the (a) first and (b) second voltammograms obtained with 25 mM PA.
2,4-D (Fig. 1) is a common compound used to kill weeds on agricultural crops and in aquatic environments. The fabrication of a p-Py coated capacitive sensor, using PGE as MIP for 2,4-D determination in water, was described by Arun and Sunil 58. A modified PGE electrode was prepared by Py EP and a 2,4-D template molecule imprint, using CA. The prepared electrodes were characterized by field emission gun-SEM, CV and EIS.
Py EP and p-Py deposition onto the PGE were performed out using Ag-AgCl, Pt and PGE, or MIP-PGE, as RE, AE and WE, respectively. Suitable volumes of a 2.5 mM Py monomer, 0.56 mM 2,4-D and 0.1 M LiClO4 were prepared in deionised water, and transferred into the cell. The cleaned PGE was immersed into the cell, and EP was done at a current of 100 μA, for 300 s, using the customised CA setup. The authors presumed that the electrostatic interaction between the -COOH and Cl of 2,4-D with -NH of the Py unit would facilitate 2,4-D entrapment in the p-Py backbone. The obtained MIP electrode was over- oxidised at pH 12, in 10 mM NaOH, for 600 s, at 1.3 V. This process removed the 2,4-D molecules embedded in the MIP electrode. The reaction mechanism that took place during the o-o process was also depicted by the authors. A non-imprinted p-Py (NIP) with PGE was also prepared without 2,4-D, for performance comparison.
All electrochemical measurements for PG, NIP and MIP electrodes characterization were done in a three setup, as previously described. A 10 mM PBS, of pH 7.0, was used for all measurements. In the characterization studies, different electrodes were incubated for 5 min, in 10 mM PBS with 1 mM [Fe(CN)6]3−/4−, and then measured.
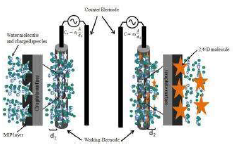
The potential scan range from -0.2 V to +0.4 V was chosen, at a scan rate of 10 mV/s−1, to perform the CV studies. EIS studies were done by using an a.c amplitude signal of 10 mV, with a frequency range from 0.01 Hz to 100 KHz. All sensing measurements were done by using EIS technique, in a three electrode setup. Initially, the MIP electrodes were incubated for 5 min in a 10 mM PBS, and then, the reference signal was measured. The change in the capacitance, due to 2,4-D binding onto the sensor, was utilised to calibrate the MIP. The decrease in the sensor capacitance, after its interaction with 2,4-D molecules, was attributed to the replacement of the charges inside the binding sites of the MIP, accumulated during the incubation in the PBS. Since the capacitance is directly proportional to the charge, the decrease in the charge accumulation reduces the capacitance. The probable reasoning for this decrease is shown in Scheme 2.
The surface morphological studies were carried out by FEG (Field Emission Gun)-SEM, and the resulting images showing the bare PGE and MIP surfaces electron micrographs, before and after 2,4-D extraction, are presented in Fig. 11.
The first, second and third images show the PGE surface roughness, the 2,4-D that forms a thin polymeric layer completely covering the graphite surface, and the covered PGE surface that was smoothed after 2,4-D extraction, respectively.
The resulting CV curves that correspond to PGE, NIP and MIP electrodes were also discussed. They show the oxidation by the redox couple, the PGE electrode decreased peaks (35 μA), and the MIP-PGE oxidation and peak currents lower than those of PGE.
In order to investigate the response of the developed sensor, a series of capacitance measurements were performed with of 2,4-D varying concentrations, in the range from 0.02 to 12.5 μg/L−1, in 10 mM PBS, of pH 7, by using EIS. The MIP was used as a sensor to measure the change in the capacitance, and its selectivity was tested using atrazine (AZ). The obtained response of the capacitance (%) change corresponds to 2,4-D varying concentrations, and AZ has been plotted. The curve was linear for 2,4-D concentrations in the range from 0.06 to 1.25 μg/L−1, with the LOD value of 0.02 μg/L−1. For AZ, the change in its capacitance (%) was calculated and found to be much lower than that of 2,4 D, which confirms the 2,4-D MIP selective functioning. The MIP sensor was further tested for 2,4-D detection in spiked drinking water, and it was found suitable, with satisfactory recovery values, in the range from 92 to 110%.
The computational modelling, with the quantum chemical method, was employed for the development of a detection sensor by the theoretical study on the interaction between the cortisol (Fig. 1) steroid and Py, in MI pre-polymerization mixtures 59. The authors chose steroids of the same ranges, namely, cortisol, progesterone, prednisolone, 21-deoxycortisol and 6-methylprednisolone (Fig. 1), for the investigation. The pre-assembled structure of cortisol-Py monomer systems possible conformations has been optimized by DFT. The template-monomer complexes model was set up, and calculations were made using the Gaussian electronic structure program. Gauss View was used to draw steroid hormone templates and Py. The transition states (TS) were traced. Harmonic vibrational frequencies have been computed for all the species, and characterized as either minima or TS on the potential energy surface. All minima states have real frequencies, while TS have a single imaginary frequency. In order to aid in the TS connection to the products and reactants, imaginary vibrational frequency animation and intrinsic reaction coordinate computation were made. The authors found that cortisol derived steroids (prednisolone and 6-methylprednisolone) have five important binding sites that are C3, C11, C17, C20 and C21 atoms, with hydroxyl or the ketone group implicated in the interaction with Py. Binding energies were computed as the difference between the energy of the complex and of each molecule. The binding energies were calculated for different molecular systems, and, based on their values, the inference about the affinity for the imprinting process could be drawn. The authors found that the change in the functional group was responsible for the variation in the binding energies.
Based on the steroid-Py MI systems conformational analysis and calculated binding energies, the authors concluded that the interactions between cortisol and Py were more specific and stronger than those between other steroids (progesterone, prednisolone, 21-deoxycortisol and 6-methylprednisolone) and Py. Thus, this study helped the researchers to use the available literature on MIP templates for active substrates determination in any real samples.
Tyrosine (Ty) (Fig. 1) is a non-essential amino acid, but it is vital for herbivores, being a basic constituent of proteins, and a precursor of several important compounds, such as neurotransmitters, including dopamine, nephrine and epinephrine. Parkinson’s disease, mood disorders and depression are majorly due to a rise in Ty. Investigators have devoted their findings to the fabrication of a MI p-Py film on an Au electrode, for Ty detection in human plasma samples 60. Py EP on to the Au electrode was done by CV. Au, Ag and Pt were used as WE, AE and RE, respectively.
The cleaned and polished Au electrode was immersed into the cell containing a 0.5 M acetate BS, of pH 4.0, with 0,06 M Py and 0,03 M Ty. The p-Py film electro-synthesis was performed by CV, in 20 scans, with a potential from 0 to 1.5 V, vs. Ag/AgCl, at a scan rate of 100 mV/s-1. The free template molecule was removed by extracting it to 1:1 alcohol. A NIP electrode, without Ty, was also prepared in the same manner.
A standard three-electrode cell, with an Au-MIP sensor, Ag-AgCl/KCl (saturated) and Pt, as WE, AE and RE, respectively, was used for electrochemical measurements. The SE was 0.01 M K3[Fe(CN)6] or K4[Fe(CN)6,] in 0.1 M KCl (1:1 v/v). CV measurements were made over a potential range from 0 to 0.6 V, at a scan rate of 100 mV/s. Square wave voltammetry (SWV) measurements were performed at a potential range from -0.04 to 0,45 V. AC impedance was measured at a potential of 0.175 V, over the frequency range from 100 mHz to 100 kHz, using an alternating voltage of 5 mV. All experiments were carried out at room temperature. A solution without Ty was used to obtain the blank peak current.
CV results show that an irreversible oxidation peak, at a potential of 0.9 V, was due to the formation of a polymer film onto the electrode surface. After EP, a loss in the current response was observed and thought to be arisen from a hindrance of the redox access to the electrode surface. The Ty MIP sensor was also characterised by SEM and Fourier transform infrared (FTIR) techniques. The SEM images presented by the authors indicated the morphological differences between NIP and MIP. The supporting data to conform and confirm the MIP sensor formation were also obtained from FTIR data.
Ty quantification in a human plasma sample was carried out through SWV, by preparing a calibration curve. The curve was linear, over the concentration range from 5 × 10⁻⁹ to 2.5 × 10⁻⁸ M. The LOD value was found to be 2.5 × 10⁻⁹ M. The MIP sensor selectivity was evaluated by SWV, for other three molecules similar to Ty: phenylalanine, histidine and L-3,4-dihydroxyphenylalanine (L-DOPA). After the template removal, MIP modified electrodes were separately immersed in 10 µM solutions of the above-mentioned molecules. It was found that the MIP response for Ty was 10, 6 and 4 times larger than that for the other compounds, respectively, revealing the greater selectivity of this sensor. Ty recoveries from plasma analysis, by SWV, ranged from 106.5 to 108.5%, with RSD values of 1.6 to 2.2%, and evolved well regarding the sensor performance.
Isoproturon (IPU) (Fig. 1) is a selective, systemic herbicide used in the control of annual grasses and broad-leaved weeds in cereals. A MIP of p-Py films was electrochemically synthesized for IPU detection 61. GC (area of 0.07 cm2), Ag/AgCl saturated with KCl and a curved Pt wire were used as WE, RE and AE, respectively. A cell containing 20% (v/v) ethanol in water, 10 mM Py, as monomer, and 0.1 M LiClO4, as SE, was inserted in the GCE, and 1 mM IPU was immersed in the assembled electrolysis cell. EP was carried out, either by CV, in 5 scans, over the potential range from 0 to 1.4 V, in reference to Ag/AgCl, at a scan rate of 10 mV/s−1, or by CA, with a potential set at 1.1 V, in reference to Ag/AgCl, for 600 s. The resulting MIP-GCE, obtained from CV or CA, was washed with water and immersed into 70% ethanol in water and 0.1 M H2SO4, respectively. Then, it was scanned at a range from -0.4 to 1.5 V, against Ag-AgCl, for several times, until the extraction of the embedded IPU molecules was completed. After the extraction, the sensor was used for IPU detection. The optimisation of every experimental parameter, for the MIP-GC fabrication using p-Py, by CV, and for the analysis of IPU determination (in the concentration range from of 2.5 × 10⁻⁹ to 5 × 10⁻⁶ M) through the sensor, in real water samples, by SWV, was discussed. The varying IPU concentrations were observed to yield peak currents at 1.05 V. Both of them are in a linear relationship with the r value of 0.9959. The LOD and LOQ values for the sensor were 2.76 × 10⁻⁹ M and 9.2 × 10⁻⁹ M IPU, respectively. The precision was evaluated by seven analyses with a single electrode. The RSD value of the resulting peak currents for the well-shaped voltammograms was 7.6%. The RSD value of 12%, obtained for the results of analysis by seven different electrodes, reveals the fair reproducible functioning of the sensor.
NIP, in IPU absence, was also prepared and used following the same procedure for MIP.
The selectivity of the MIP-GC sensor was evaluated by analysing the solution containing IPU with any one of carbendazime, diuron and CBZ interferents 62. The authors found no interference from either cabendazime or CBZ, which allows the limited application of this sensor for IPU quantification in their presence. On the contrary, in diuron presence, at equivalent or 10 times higher concentrations, IPU lowered its signal by 50% and 80%, respectively. However, the authors justified that, in natural waters, diuron is found at concentrations up to 17 times lower than those of IPU and, hence, they claimed that the former does not exhibit major interference with the latter.
Mebeverine (MEB) (Fig. 1) is a musculotropic drug widely used to treat irritable bowel syndrome and gastrointestinal spasm secondary to organic disorders. The preparation and use of a MIP sensor thin film, by the CV EP method, with Py monomer using PGE, for MEB as a template molecule, were described 63. The Ag nanoparticles (AgNPs) electrodeposition was also carried out in MIP fabrication for MEB. The electroanalytical DPV, CV and CA experiments were performed using a three electrode cell assembly consisting of a MIP-modified PGE, a Pt wire, and Ag/AgCl (saturated KCl), as WC, AE and RE, respectively. Bare and modified PGEs were used in the measurements. The PGE was immersed into a solution of 0.1 M KCl, 0.04 M BRB of pH 6.5, 50 mM Py as functional monomer and 5 mM MEB. The CV operation was carried out by applying the potential range from -0.75 to 1.30 V, for 20 cycles, at a scan rate of 40 mV/s-1. The modified PGE was rinsed thoroughly with ethanol, and then immersed in a mixture of 0.1 M KNO3 and 3 mM AgNO3. Additionally, AgNPs potentiostatic electrodeposition onto the imprinted PGE was performed by applying the potential of -0.4 V, for 400 s. The embedded MEB was extracted by scanning the electrode in the potential range from 0.3 to 0.8 V, at the scan rate of 16 mV/s-1, in the BRBS (pH 6.5), for several cycles, until no obvious oxidation peak was observed. This process resulted in AgNPs-MIP-PGE. The obtained sensor was used for MEB determination, by DVP, in serum and capsules.
DPV analysis of MEB solutions and samples was performed in a BRBS (pH 6.5), in the potential range from 0.3 to 0.8 V, at a step potential of 8 mV, MA of 50 mV, and at the scan rate of 16 mV/s-1, at room temperature. The sensor selectivity was tested using donpezile, chloroquine, levetiracetam, venlafaxine, ketorolac, naproxen and mequinol, as interfering compounds.
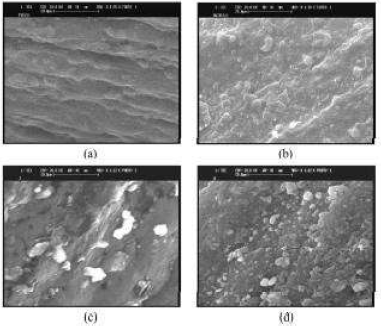
The MIP-PGE and AgNPs-MIP-PEG surface morphology was investigated by SEM analysis, of which images are shown in Fig. 12.
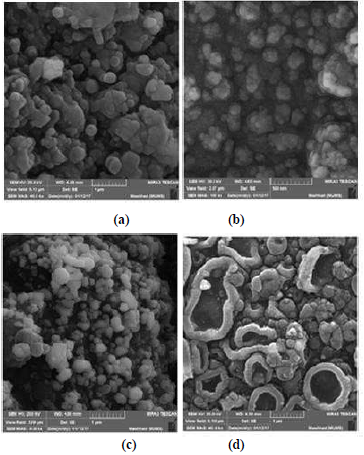
Figure 12 SEM images of: (a) MIP-PGE and (b) AgNPs-MIP-PGE, before the template extraction; (c) AgNPs-NIP-PGE and (d) AgNPs-MIP-p-Py, after the template extraction.
As seen in the MIP-PGE and AgNPs-MIP-PGE images, before and after the MEB template extraction, the differentiation between each and every image shows the clear description of the formation of MIP with PGE and with AgNPs-PGE.
MIP-PGE and AgNPs-MIP-PGE electrochemical behaviours, before and after the template molecule extraction, were recorded by CV experiments, in K3[Fe(CN)6] presence, of which images substantiated the sensors formation. The developed MIP-PGE sensor yielded a weak and broad peak at 0.72 V. At the other end, the AgNPs-MIP-PGE sensor gave an anodic peak at 0.66 V, with a larger peak current than that of MIP-PGE. Besides, the reduction peak absence in the CV curve of the reversed scan suggested that the electrochemical reaction was a totally irreversible process.
For the quantification purpose, different MEB concentrations were prepared to be subjected to a calibration curve, by DPV. It was observed that the graph of the peak currents vs. MEB concentrations produced two linear curves, in the concentration ranges from 1 × 10⁻⁸ to 1 × 10⁻⁶ M and 1 × 10 -5 to 1 × 10⁻³ M, with an r of 0.9880. The calculated sensor LOD value was 8.6 × 10⁻⁹ M. The interferences study results for MEB revealed that there was no obvious signal from chloroquine, levetiracetam, venlafaxine, naproxen and mequinol species, but donepezil and ketorolac decreased the sensor peak current. Therefore, these two species were adjudged as interferents in MEB assay. The MEB recoveries, from the analyses of serum and capsules, were in the ranges from 95 to 116% and 90 to 102.05%, respectively. The results revealed no serious interference from the additives in the capsules. Thus, the AgNPs-MP-PEG sensor is a selective, sensitive and low cost tool to determine MEB in real samples, such as serum and pharmaceutical samples.
Conclusions
The popularity of analytical techniques is ever increasing in the field of chemical sciences. Analytical quality control is one of the dominant areas in pharmaceutical industries. Bio-analytical and environmental laboratories play decisive roles in chemical compounds quantification in a variety of their samples origins. Analytical techniques must be cost effective, accurate, precise, selective and specific, in order to succeed their goals. MIPs invention as analytical devices, has drawn great attention among researchers, by virtue of their wide applicability for organic compounds determination or detection in samples. Due to its ability to undergo EP, Py (Py) is one of the most widely used combinant monomer molecules in MIPs fabrication. The MIPs based electroanalytical techniques are simple, fast, sensitive and free from stringent experimental conditions, such as pH, temperature, extraction steps, the need of a skilful operator etc., and from chromatographic, spectroscopic, fluorimetric and chemiluminescent techniques. This review undertook to present the highlights of the fabrication, optimisation and application of Py induced MIPs. The techniques, raw materials, electrodes, electroanalytical conditions, applications and results on the studies of MIPs sensors developed for analytes determination have been herein highlighted. The sensors chemistry procedures described in this review benefit pharmaceutical, biochemical and environmental laboratories that adopt them in routine analytical processes. The use and modification of a wide number of electrodes, for their use as MIPs in the quantification of active organic compounds taken as template molecules, by CV, DPV, SWV or others, were presented. The characterisation results were also included for the benefit of scientific material obtention.


