Introduction
Over the years, different types of materials have been used by industries, for several applications. Among them, steel is one of the most widely used, due to its low cost and ready availability 1-3. Steel has been used in many industrial applications that involve high strain rates and stresses 4,5. Low and medium C steels are essential engineering materials, which have found different applications in marine applications, transportation and chemical processing, due to their availability, low cost, good mechanical properties, ease of fabrication and weldability 6,7. These steels account for a large percentage of all annual steel production and availability all over the world 8,9. Steel has also been employed for railway, coupling, driving rings, flanges, hand tools, sockets, levers, cams, machinery parts, such as nuts and bolts, shafts and gears, connecting rods and laminated springs. These numerous applications have made essential the study of steel welded joints mechanical, corrosion and microstructural properties.
Welding is an amazingly significant industrial process that is used in automotive industries, high rise office buildings, aeroplanes, rockets and pipelines. More specifically, arc welding is the most common type of welding, whereby the source of heat is supplied by a high-current electric arc, between the base metal and the electrode material 10,11. The generated heat is enough to melt the electrode tip and the base metal. Due to this large amount of generated heat, the base metals melt, and a strong welded joint is formed after its cooling.
It has been discovered, in most cases, that welded joints exhibit lower resistance to corrosion and weaker mechanical properties, since welding causes changes in their chemical compositions, residual stress and structure 12,13, which could make the soldered metal and the HAZ corrode more rapidly than the base metal 14-16.
Corrosion failure, which can cause welds mechanical and microstructural failures, often occurs, in spite of the selection of suitable base and filler metals, and strict adherence to industry codes and standards. There are also instances in which the weld exhibits higher corrosion susceptibility than that of the unwelded base metal 17.
However, with HT aid, these problems can be mitigated. PWHT has been reportedly employed, in order to reduce the residual stress gradients, and also to minimize the welded joint susceptibility to stress corrosion cracking 18-20. PWHT minimizes the composition gradients and the formation of micro galvanic cells. This treatment also transports hydrogen from the weld regions, thus preventing its cracking or embrittlement 21,22. In this study, suitable HT conditions for enhancing electrochemical corrosion and microstructural characteristics of two PWHT MS grades were investigated.
Materials and methods
The investigated MS plates (base metals) chemical compositions were determined by OES (Table 1).
Table 1 MS samples chemical compositions (% mass).
| Steel | Fe | C | Cr | S | P | Mn | Mo | Ni | Si |
| SAE 1015 | 99.232 | 0.150 | 0.004 | 0.003 | 0.005 | 0.539 | 0.005 | 0.035 | 0.027 |
| SAE 1010 | 99.322 | 0.100 | 0.002 | 0.003 | 0.005 | 0.534 | 0.005 | 0.004 | 0.025 |
A Hero E6013 Stone bridge flux coated MS electrode was used to supply the filler metal. The flux (a thin layer coating around the welding electrode) provided a shield to the molten metal zone from the atmospheric O and N during welding. This flux also prevented the formation of O-2 and N-3. The flux chemically reacted with O-2 in the metal, forming a low melting temperature fusible slag. The used electrodes diameter and length was 2.5 and 300 mm, respectively. The MS electrode chemical composition is shown in Table 2.
Table 2 MS electrode chemical composition (% mass).
| Electrode | C | Mn | Si | S | P |
| MS | 0.12 | 0.50 | 0.33 | 0.031 | 0.040 |
Electric arc welding procedure
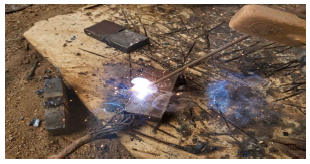
Electric arc welding was performed on the base metals using an AC electric machine. The base metals were thoroughly cleaned with a wire brush, in order to remove impurities and corrosion products that could lead to weak welds or porous welded surfaces. The MS electrode was inserted into the electrode holder, at an angle of 60 to 80°, with the work piece placed in Fig. 1. The welding procedure was done by bringing the electrode in contact with the base metals, and then separating the former to a proper distance, in order to produce an arc. When the arc was obtained, the intense heat melted the base metals below the arc, thus forming a molten metal pool. A small depression was formed in the base metals, and the molten metal, called arc crater 23,24, deposited around the edge of this depression. The weld beads length was about 40 mm each, and the weldments width was approxim. 10 mm. After welding, the specimens were naturally cooled to room temperature, in still air. The slag that floated on top of the weld was brushed off after solidification and cooling of the weld joint.
PWHT and sample preparation
After welding, the samples were subjected to PWHT, with a holding time of 1 h each, and at soaking temperatures of 650, 750, 850 and 950 ºC, using a Lenton electric furnace, in order to compensate for the joints properties weakening by the unequal volume fractions of ferrite and austenite in the weld zone. Then, the samples were cooled to room temperature in still air, polished, rinsed in distilled water, and cut into 10 x 10 x 5 mm, for various examinations.
Corrosion testing
These MS samples were mounted on a Cu wire, and then embedded in epoxy resin for the corrosion test, using PDP technique in a three-electrode cell. 100 mL seawater (3.5 wt.% NaCl) were used as the corrosion medium, at the room temperature of 25 ºC. The WE, RE and CE were inserted in the test solution. The MS weld, the graphite rod and the saturated calomel acted as WE, CE and RE, respectively. The polarization was performed at a SR of 0.166 mV/s, from -250 mV OCP to +1000 mV of SCE. The CR was calculated using equation 1.
where jcorr is the corrosion current density (A/cm2), EW is the equivalent weight (g) and D is the metal density (g/cm3). By the Tafel extrapolation, the jcorr was determined.
Microstructural examination
SAE 1015 and 1010 MS samples microstructural examination was carried out using a SEM at the magnification of 250X.
Results and discussion
Corrosion properties
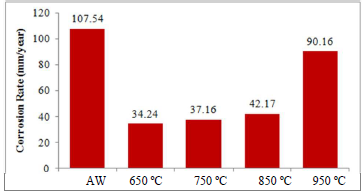
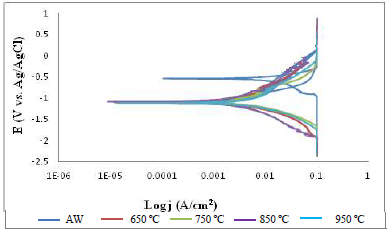
Table 3, Figs. 2 and 3 illustrate the effect of 3.5 wt.% NaCl on AW and PWHT SAE 1015 MS samples.
Table 3 Polarization data for AW and PWHT SAE 1015 MS samples.
| Temp. | Ecorr (V) | jcorr (A/cm2) | CR (mm/year) | Rp (Ω) |
|---|---|---|---|---|
| AW | -0.6216 | 0.009255 | 107.54 | 4.1925 |
| PWHT at 650 ºC | -1.1615 | 0.002947 | 34.24 | 24.550 |
| PWHT at 750 ºC | -1.1614 | 0.003198 | 37.16 | 17.347 |
| PWHT at 850 ºC | -1.1411 | 0.003629 | 42.17 | 34.020 |
| PWHT at 950 ºC | -1.1764 | 0.007759 | 90.16 | 15.899 |
Table 3 shows that the PWHT MS sample had lower corrosion jcorr values than those from the AW sample, which could be attributed to the HT effect that minimized the ions exchange within the metal anodic and cathodic sites. At 650 ºC, it exhibited the minimum jcorr and CR values of 0.002947 A/cm2 and 34.240 mm/year (Fig. 2), respectively, which were lower than those of the AW sample 25. This showed that minimal ingression of Cl- ions into the PWHT MS sample active sites occurred 26, and that it was subjected to the most favorable HT temperature.
Furthermore, Fig. 3 shows SAE 1015 PWHT and AW MS samples polarization curves (Tafel plots) of the welded sample. The figure indicates that the PWHT MS sample polarization curves shifted towards a more negative region than those from the AW one. This behavior indicates that PWHT enhanced the material cathodic polarization in the test medium.
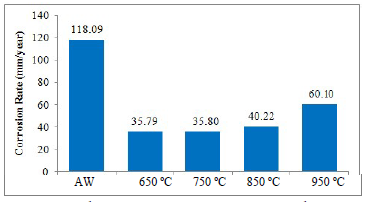
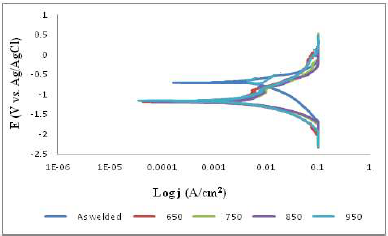
Table 4, Figs. 4 and 5 revealed the effect of simulated seawater (3.5 wt.% NaCl) on AW and PWHT SAE 1010 MS samples.
Table 4 Polarization data for AW and PWHT SAE 1010 MS samples, at different temperatures.
| Temp. | Ecorr (V) | jcorr (A/cm2) | CR (mm/year) | Rp (Ω) |
|---|---|---|---|---|
| AW | -0.7106 | 0.010163 | 118.09 | 11.215 |
| PWHT at 650 ºC | -1.1897 | 0.003081 | 35.79 | 24.848 |
| PWHT at 750 ºC | -1.1933 | 0.003085 | 35.80 | 21.106 |
| PWHT at 850 ºC | -1.2022 | 0.003461 | 40.22 | 18.435 |
| PWHT at 950 ºC | -1.1675 | 0.005172 | 60.10 | 21.369 |
Table 4 shows that the PWHT MS sample had lower corrosion jcorr values than those from the AW one. At 650 ºC, it exhibited the minimum jcorr value of 0.003081 A/cm2, which could be ascribed to the HT that reduced the Cl- ions effect on the PWHT MS surface. Some proportion of passive film could have been formed on the metal surface after HT, leading to a stronger anti-corrosive property 27. Similarly, Fig. 4 indicates that the PWHT SAE 1010 MS sample had lower CRs values than those from the AW one, which shows that minimal penetration of Cl- ions into the metal active sites occurred. At 650 ºC, it displayed the lowest CR of 35.79 mm/year. This reveals that the PWTH MS sample was subjected to the most favorable HT temperature, leading to a remarkable reduction in CR, compared to the AW one.
Moreover, Fig. 5 shows the AW SAE 1010 MS sample Tafel plots. The PWHT MS sample Tafel plots shifted towards a more negative region than the polarization curve from the AW one. However, the PWHT MS sample polarization curves, at 950 ºC, exhibited similar behavior as the AW one.
Microstructure properties
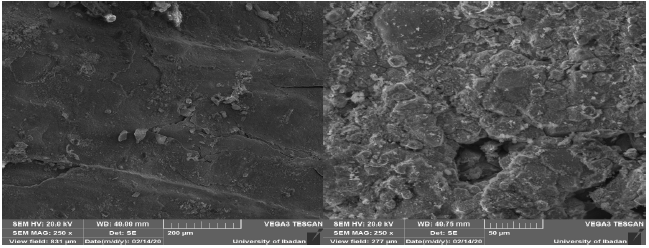
Figs. 6 and 7 show the SEM images of PWHT SAE 1015 and 1010 MS samples, respectively, at 650 and 950 ºC. It is seen that the two PWHT MS samples, at both temperatures, exhibited a similar microstructure.
The PWHT MSs samples, at 650 ºC, exhibited lower porosity, smaller grain size and boundaries, and more uniform structures than those at 950 ºC. This behavior is in agreement with the study of Kazemipour M. et al. 28, where the metal grain size increased with higher HT temperatures.
The remarkably reduced CR and jcorr values observed in PWHT SAE 1015 and 1010 MS samples, at 650 ºC, could have been due to their low porosity, smaller grain size and boundaries, which minimized Cl- ions ingression. On the contrary, their higher porosities and grain boundaries, at 950 ºC, could have acted as crevices for corrosion initiation and propagation. Pitting corrosion attack is often predominantly on the grain boundaries, where higher lattice energy and defects exist. Therefore, the crevices acted as sites for Cl- ions strong penetration, thereby increasing the metal CR rate.
Conclusions
PWHT effect, by electric metal AW, on SAE 1015 and 1010 MS samples corrosion and microstructure properties was investigated, and the following conclusions were drawn:
The lowest CR values, of 34.240 and 35.793 mm/year, were observed for PWHT SAE 1015 and 1010 MS samples, respectively, at 650 ºC.
The highest CR values, of 90.16 and 60.10 mm/year, were observed for those samples, respectively, at 950 ºC.
For AW SAE 1015 and 1010 MS samples, the CR values were 107.54 and 118.09 mm/year, respectively.
The reduction in both PWHT MS samples CR values could be ascribed to the formation of passive films on their surfaces, which enhanced their corrosion resistance.
The SEM images, at 650 ºC, revealed smaller grain sizes and boundaries and less porosity than those at 950 ºC, which indicates that they can be utilized for advanced industrial applications.
Authors’ contributions
O. O. Ajide: conceived and designed the analysis; offered key intellectual support, assessed and appraised the manuscript; developed some sections of the manuscript, revised the manuscript. O. O. Anifalaje: performed experiments and analyzed data; developed some sections of the manuscript. I. G. Akande: analyzed data; developed some sections of the manuscript; revised the manuscript. F. A. Musa: assisted in plagiarism test and editing of the manuscript. O. S. I. Fayomi: provided laboratory, offered key intellectual support, assessed, reviewed and appraised the manuscript. O. O. Oluwole: offered key intellectual support, assessed, reviewed and appraised the manuscript. K. M. Oluwasegun: assisted in plagiarism test and editing of the manuscript. O. J. Ajao: reviewed and edited the manuscript.
Abbreviations
AW: as-welded
CE: counter electrode
CR: corrosion rate
CV: cyclic voltammogram
Ecorr: corrosion potential
HAZ: heat-affected zone
jcorr: current density
MS: mild steel
N3: nitrides
O-2: oxides
OCP: open circuit potential
OES: optical emission spectroscopy
PDP: potentiodynamic polarization
PWHT: post-weld heat-treatment
RE: reference electrode
Rp: polarization resistance
SCE: saturated calomel
SEM: scanning electron microscopy
SR: scan rate
WE: working electrode


