


 Inglês (pdf)
 Artigo em XML
 Referências do artigo
 Enviar este artigo por email
 Citado por SciELO
  Similares em
SciELO
Similares em
SciELO 
 Permalink
Introduction
In many industries, corrosion is a major threat to the infrastructures, and also tends to affect the GDP of a nation, due to the economic costs associated with it. Based on the recent GDP growth rate, the Indian government is losing about 2.4% of its economy, due to metals and alloys corrosion 1. In Nigeria, corrosion economic costs in the oil industry were estimated to be from 3 to 4% of the country’s GDP 2, while, in South Africa, they were calculated in the range from 3 to 5%, and closely related to the global losses of $255 billion 3. MS is an iron and carbon alloy, being the major metal in several industrial installations 4. However, within most of these industries, activities such as acid cleaning, etching, engraving and others, can accelerate MS CR, especially in acidic or basic environments 5-10. Approaches to protecting metals against corrosion damages are varied, but include methods such as coating, electroplating, painting/greasing, cathodic/anodic protection and the use of corrosion inhibitors 11-14. Inhibitors can be added to the corrosive substance in minute C, to protect metals against corrosion, through the initial adsorption mechanism 15,16. Most compounds employed as corrosion inhibitors are required to be biodegradable, less expensive, non-toxic and simple to handle 17. The above-listed properties are valuable, and have positioned the use of corrosion inhibitors as one of the greatest alternatives for metal corrosion prevention 18.
The choice or design of a corrosion inhibitor is based on several chemical considerations, but the basic ones are the possession of heteroatoms, pi-electron or conjugated systems, high molecular weight, aromatic systems, multiple bonds, etc. 19. Given the depth of knowledge that is available for guiding the choice of new ecofriendly inhibitors synthesis, several compounds have been explored for their corrosion IE (%) 18. Some literature on the usage of carboxamide derivatives as corrosion inhibitors is available. For example, Dadgarinezhad and Daghael 20 explored the corrosion inhibition potential of 2-phenyl-1-hydrazine carboxamide in H3PO4, and observed that the adsorption mechanism obeyed the Langmuir’s isotherm. Chafig et al. 21 reported (E)-2-(4-(2-(methyl(pyridine-2-yl)amino)ethoxy) benzylidiene)hydrazine-1-carboxamide as a cost-effective and efficient corrosion inhibitor, with maximum IE (%) of 97%, at a C of 0.005 M. Their experimental findings were in good agreement with data generated from theoretical calculations. Other related works about corrosion inhibitors have also been documented on 2-(1-(2-oxo-2H-chromen-3-yl) rthylidene) hydrazine carboxamide, for Zn-Al alloy in HCl solutions 22, and salicylaldehyde-based Schiff bases of semicarbazide and p-toluidine, for MS in an acidic medium 7. On the other hand, studies on the inhibitive properties of pyridine substituted amines are much scanty, except some reports that include the study conducted by Farahati et al. 23, who found that 4-(pyridic-3-yl) thiazol-2-amine was an effective and eco-friendly inhibitor for Cu corrosion in HCl.
In continuation of this novel exercise, we have successfully synthesized and applied two aromatic compounds (FD and ACP), as inhibitors for MS corrosion in acidic media. Despite the other relevant works, the use of these compounds as inhibitors for MS corrosion in HCl and H2SO4 has not been previously reported. The current study researched the synthesis and corrosion inhibitive properties of these compounds, at 303 K, which is the approximate temperature in which most fluids are handled in industries. Although most industrial fluids pH values are relatively acidic, the study was conducted under simulated acidic conditions, at 1 M. The compounds chosen for the present study have hetero atoms, pi-electrons and aromatic rings, and were expected to exhibit corrosion IE (%).
Experimental
Material preparation
A commercially available MS sheet was procured and cut into coupons of the required dimensions 5 ( 1 and 1 ( 1 ( 1 cm, for gravimetric and electrochemical experiments, respectively. MS composition was (%): C = 0.014; Si = 0.007; Mn = 0.195; S = 0.014; P = 0.010; Ni = 0.014; Mo = 0.014; Cr = 0.041 and Fe = 99.691. Each coupon was polished using varying grades (120-1200 grits) of emery sheets. They were further cleaned with ethanol, for degreasing, and rinsed with acetone, before being stored in a desiccator.
FD preparation
At a temperature from 0 to 5 ºC, 0.02 M aniline were dissolved in glacial acetic acid and 0.5 mL HCl. The mixture was diazotized with 0.2 g sodium nitrite, under constant stirring, while 0.01 M semi-carbazone was slowly added, and allowed to cool overnight. The resulting solution was decanted into cold water, and the precipitated crystals were separated and recrystallized with ethanol. The re-crystalized crystals were used to prepare formazan of p-dimethyl amino benzaldehyde, by dissolving 10 mg of this compound. FD C needed for the corrosion study were prepared through serial dilution.
ACP preparation
ACP was synthesized using the method described by Zhang et al. 24. A stock solution of ACP was made by dissolving 10 mg of it in 100 mL of the test solution, and carrying out serial dilution to obtain the desired C.
WL method
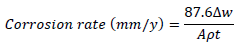
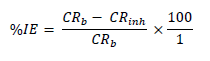
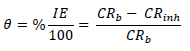
WL experiments were conducted by completely immersing the weighed MS specimens into various beakers containing different FD and ACP C. Each MS coupon was taken out from the solution, following 24 h of immersion, washed, and returned to the solution after weighing. The experiments used a thermostated water bath (303 K), and they were repeated and concluded in seven days. MS CR, FD and ACP IE (%) and θ were computed by the measured values substitution into Equations 1, 2 and 3, respectively 25:
 ***
***
 ***
***
 ***
***
where Δw, A and ( are the MS coupons WL, cross-sectional area and density, and t is the contact period, respectively.
PDP study
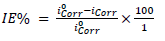
The MS sample, SC and Pt were used as WE, RE and AE, respectively, in the PDP cell. The electrolyte was the respective corrosive acid (HCl or H2SO4). PDP measurements were accomplished in the potential ranges from -1000 to 250 mV and from 1000 to 2000 mV, at a SR of 0.5 mV/s-1. Data obtained from the PDP cell were Ecorr, Icorr, (c and (a. From PDP measurements, FD and ACP IE% were computed by the following equation 25:
 ***
***
where Iºcorr and Icorr are the corrosion current without and with inhibitor. LPR experiment was also carried out in the same electrochemical cell. From Rp calculated values, IE% was evaluated by using the following equation 26:
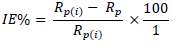 ***
***
where Rp(i) and Rp are polarization resistance without and with inhibitor, respectively.
EIS
EIS study was performed using an electrochemical analyzer, and the conventional three electrodes that were similar to those used in the PDP experiment. A steady-state potential wave was first obtained, and sine wave AC signal of 10 mV amplitude was overlaid, in order to obtain OCP. This was conducted using the frequency range from 100 kHz to 10 MHz, in order to obtain values for the real (Z') and imaginary (Z'') parts. Cdl was calculated by the following equation 27:
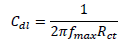 ***
***
where fmax is the frequency at Z” value. IE% was calculated by using the following equation 7 28:
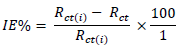 ***
***
where Rct and Rct(i) are the charge transfer resistance without and with inhibitor respectively.
SEM
Morphological analysis of the corroded MS surface (without and with inhibitor) was carried out at Metallurgical and Material Department, NIT Tiruchi, India, using SEM (Model- HITACHI S3000H, Japan). The MS coupons were immersed in the test solutions (without and with 35% inhibitors C), and allowed to stand for seven days, before they were withdrawn for SEM analysis.
Computational calculations
Chemical structures were drawn with the aid of ChemBio 12.0 software, and the structured produced were saved as a SDF input file, for structural optimization. DFT calculations were performed with a /631G** basis set and B3LYP hybrid functional. FMO graphs plotting was also performed at this level of theory. Calculations were performed for both aqueous and gaseous phases. FF calculations were carried out using electrostatic E, MC and NBOC. In order to determine the interaction between the inhibitor and the MS surface, Monte Carlo simulation was performed using HyperChem software.
Results and discussion
WL method
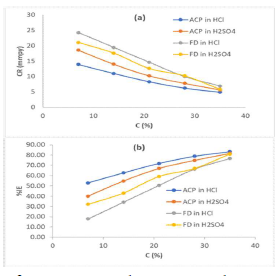
The MS coupons CR was observed to decline with increasing ACP and FD C, as shown in Table 1.
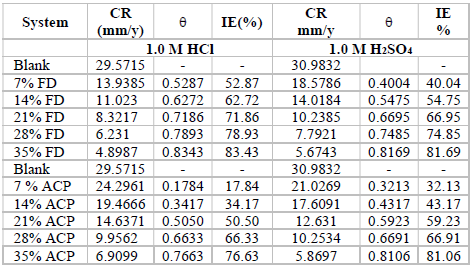
MS coupons CR were 29.5715 and 30.9832 mmpy, in 1 M HCl and H2SO4, respectively. As ACP C was increased from 7 to 35%, CR decreased from 13.9385 to 4.8982 mmpy, in HCl, which corresponded to an IE (%) increase from 52.87 to 83.43%. In H2SO4, CR decreased from 18.5786 to 5.6743 mmpy, while the corresponding IE (%) rose from 40.04 to 81.69%. This reveals that MS coupons CR in 1.0 M H2SO4 was higher than that in 1.0 M HCl, because the former is a stronger dibasic acid than the latter. Similarly, FD IE (%) for MS coupons CR in HCl was found to be slightly better than that in H2SO4. ACP exhibited relatively lower corrosion IE (%) than that of FD, within the studied C range (from 7 to 35%). ACP demonstrated the capacity to reduce MS coupons CR from 24.2961 to 6.9099 mmpy in 1 M HCl, and from 21.0269 to 5.8697 mmpy in H2SO4. ACP seems to be a better inhibitor for MS coupons corrosion in H2SO4 than in HCl. This may be because H2SO4 tends to form a passivating layer on the metal surface, through tetraoxosulphate (VI) ions adsorption.
Further, the observed trend for the changes in corrosion IE (%) concerning the inhibitors and the acidic media was: FD in HCl > FD in H2SO4 > ACP in H2SO4 > ACP in HCl (Fig. 1). Considering the two inhibitors chemical structures, it is obvious that FD has more functional corrosion inhibition enhancing properties than those of ACP, including two aromatic rings and several heteroatoms, with multiple bonds and higher molecular mass. Therefore, the observed results are consistent with the compounds chemical structures.
MS CR, and instantaneous ACP and FD IE (%), with eight 4 h intervals (from 4 to 24 h), were also calculated, and the obtained results are presented in Table 2.
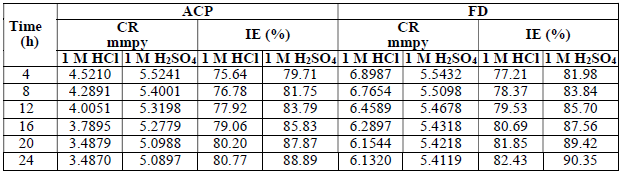
The recorded results clearly show that the instantaneous ACP and FD IE (%) were much better than those of other inhibitors. Similar results have been reported for some effective corrosion inhibitors 29.
The instantaneous MS coupons CR, and ACP and FD IE (%) in the acidic media linearly decreased with time (Fig. 2), which implies that MS corrosion in both media was uniform.
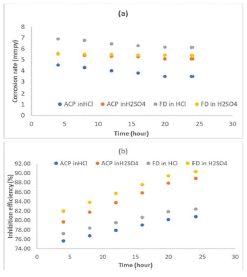
Figure 2 Time variation with instantaneous: (a) MS CR in 1 M HCl and 1 M H2SO4; and (b) ACP and FD IE (%).
Time changes with MS C in the corrosive media were also monitored through WL measurement, and the obtained data were used to test for the best suited kinetic plots. The requirements for a first-order kinetic were satisfied:
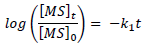 ***
***
where (MS) 0 and (MS) t are the alloy initial and final C in the corrosive media, t is time and k1 is the first-order rate constant.
From the plots of log Fe t Fe 0 against t (figure not shown), half-life 𝑡 1 2 = 0.693 𝑘 1 was estimated (Table 3).
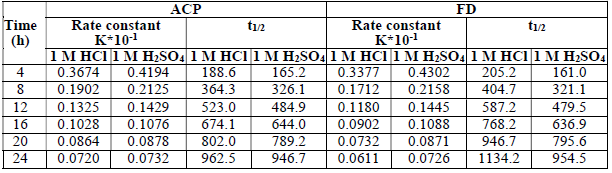
The presented results reveal that the inhibitors effectively extended MS half-life up to 963, 947, 1134 and 955 h, with ACP and FD in HCl and H2SO4, respectively.
Adsorption/thermodynamic study
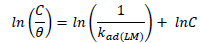
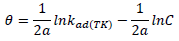
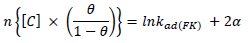
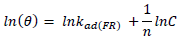
ACP and FD characteristics against MS corrosion in HCl and H2SO4 solutions are essential parameters in their interaction level, inhibition mechanisms and other inhibitory roles features. The adsorption linear fitness results indicated that the mechanism best fitted Langmuir’s, Temkin’s, Frumkin’s, and Freundlich’s isotherms, which are expressed in Equations 9 to 12, respectively 30,31.
 ***
***
 ***
***
 ***
***
 ***
***
where a is Temkin’s interaction parameter, 𝛼 is the lateral interaction factor describing the adsorption layer and 1/n is the Freundlich’s constant for the adsorption intensity or surface heterogeneity. Langmuir’s, Temkin’s, Frumkin’s and Freundlich’s isotherms are presented in Table 4.
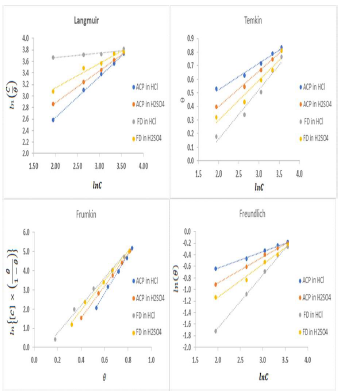
The plots fitness was excellently supported by R2 high values. The various adsorption constants for the isotherms are illustrated in Fig. 3.
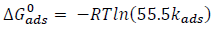
ΔG°ads for the inhibitors adsorption was calculated from the respective kads values using equation 13 32:
 ***
***
where R is the gas constant, T is temperature and 55.5 is the molar heat of water adsorption.
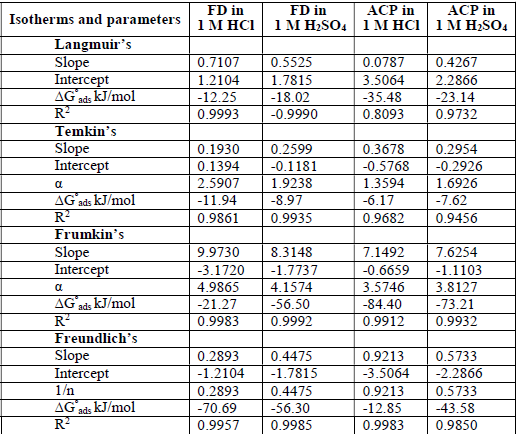
The ideal Langmuir’s isotherm describes a homogenous adsorption layer with no interaction between the adsorbed species. Since the expected slope value for the ideal Langmuir’s isotherm is unity (Equation 9), there was an observable deviation concerning ACP and FD adsorption onto the MS surface (slope > 1 for ACP and FD). Hence, there was an interaction between the adsorbed species. The interaction parameters calculated through Temkin’s and Frumkin’s isotherms reflected the inhibitors adsorption behavior, since they were positive. In both cases, the interaction strength was most intense for FD in HCl.
The calculated ΔG°ads (Table 4) values correspond to different adsorption mechanisms. For example, the Langmuir’s, Temkin’s, Frumkin’s and Freundlich’s models generated ΔG°ads values of -12.25, -11.94, -21.27 and -70.29 kJ/mol, for FD in HCl, respectively. ΔG°ads values lower than -20 kJ/mol and higher than -40 kJ/mol favor physical and chemical adsorption mechanisms, respectively. Free energy values from -20 to -40 kJ/mol often indicate a mixed adsorption mechanism. Therefore, the inhibitors adsorption onto the metal surface first underwent physisorption, and then chemisorption. Interestingly, Freundlich’s constant (1/n) was lower than unity, and supported chemisorption mechanism (unlike cooperative adsorption, which requires that 1/n should be greater than unity). Some levels of agreement between data obtained from the various isotherms were also observed, for example, ΔG°ads values evaluated from Frumkin’s and Freundlich’s isotherms were -56.50 and -56.30 kJ/mol, respectively, for FD adsorption onto the MS surface (in H2SO4).
Polarization studies
PDP and LPR studies were also useful in ACP and FD IEs evaluation (Fig. 4).
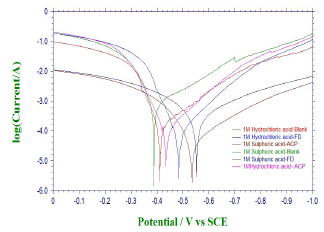
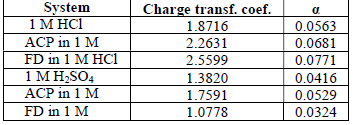
Table 5 contains polarization data and calculated ACP and FD IE (%). The inhibitors addition to HCl and H2SO4 led to an increase in Ecorr absolute value, while Icorr decreased. This indicates that ACP and FD inhibited MS corrosion in the acidic media.
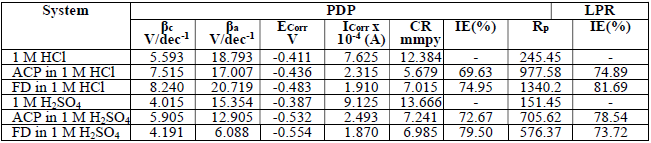
The observed changes in βc were more significant than those in βa, which suggests that the inhibition process significantly retarded H reduction mechanism. It also implies that the anodic reaction was more favored than the cathodic one. Calculated differences in E were also greater than the threshold value (85 mV), confirming that the inhibitors are majorly anodic 33. Further investigation of the inhibitors anodic character was made through the results obtained from the transfer coefficient calculations. The transfer coefficient can be calculated by the substitution of R values, temperature and Tafel slope, and by the number of electrons associated with the redox reaction, into equation 14:
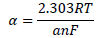 ***
***
where ( is the Tafel slope, n is the number of electrons in the redox reaction and F is Faraday’s constant. The Tafel slope was deduced from the following equation:
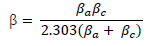 ***
***
( calculated values are shown in Table 6. Generally, anodic reaction and cathodic polarization are favored when 𝛼 values are from 0.25 to less than 0.5, and close to 0.75, respectively. The presented results also confirmed that the inhibitors are majorly anodic, and suppress HER more than MS anodic dissolution.
LPR study on the acidic solutions (Table 5) indicated that Rp was increased by ACP and FD, which imply that the inhibitors decreased CR in the acidic media. IE (%) calculated from PDP and LPR studies are consistent with each other, and with the instantaneous IE (%) presented in Table 2.
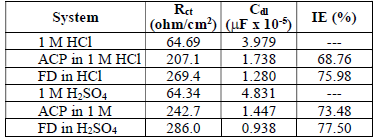
EIS
EIS measurements were also performed to study ACP and FD corrosion inhibition properties. The Nyquist plots generated from the EIS study are shown in Fig. 5, which reveals that the semicircle widened in FD presence, showing higher increment and better IE (%) than those from ACP. The phase angles approached 80(, implying that diffusion was not the rate control parameter. Cdl values can also be calculated through the following equation 34:
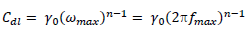 ***
***
Corrosion inhibition may be thought of as the inhibitor displacing adsorbed water onto the metal surface (Equation 17):
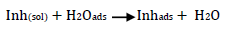 ***
***
In most cases, organic inhibitors have a lower dielectric constant and higher volume than water, and the relationship between Cdl and dielectric constant is given as follows:
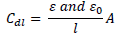 ***
***
where (0 and ( are the dielectric constant in vacuum and in the solution, respectively, 𝑙 is Cdl thickness and A is the MS cross-sectional area.
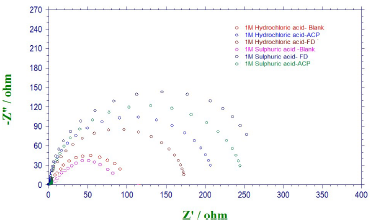
From equation 18, it is evident that the higher the ( value, the higher will be Cdl. Therefore, the replacement of the adsorbed water molecule (with a higher dielectric constant), on the metal surface, by an organic inhibitor (with a lower dielectric constant) will cause a reduction in Cdl, as shown in the results obtained for FD and ACP (Table 7). Thus, the observed decreasing trend in Cdl indicates that the inhibitors were adsorbed at the MS-solution interface. On the other hand, FD addition to the acidic solutions led to the highest increase in their Rct. This can be ascribed to Cdl reduction and, hence, to MS corrosion inhibition by the formation of a protective film on its surface, through the inhibitors electrostatic attraction.
The radius of the semi-circle for the blank solutions is larger than those observed for ACP or FD in the corrosive media. This is due to the depressive capacitive loop (of which center is below the real axis) made by the impedance spectra, causing roughness and inhomogeneities at the MS surface.
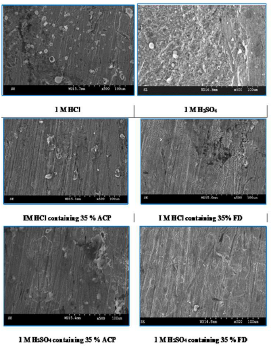
SEM
Fig. 6 shows MS SEM in 1 M HCl and H2SO4, without and with ACP and FD.
The micrographs reveal that the MS surface was intensely rough, but got smoother with ACP and FD, which have formed a protective coverage on it through adsorption.
Quantum chemical study
Global reactivity
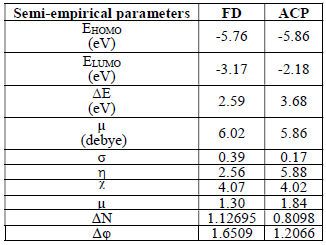
Semi-empirical parameters were calculated for ACP and FD in the gas phase. They included EHOMO, ELUMO, (E and µ (Table 8).
The reactivity of a corrosion inhibitor can be predicted from FMO theory, which states that LUMO is located in the electrophilic site. The theory requires the molecule reactivity to be a function of FMO energies. Consequently, reactivity (and, hence, adsorption) increases with higher EHOMO value and with lower ELUMO and (E values.
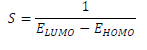
(E is the measure of a compound ( or σ, in terms of its tendency towards adsorption or reactivity 7. Higher the (E, higher the reactive molecules σ (hence, lower (). Molecular σ and ( are defined as follows 35:
 ***
***
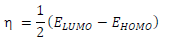 ()
()IP and EA of an inhibitor are defined as EHOMO and ELUMO negative values, respectively, while χ is defined as the inhibitor chemical E negative value, which can be calculated by IP and EA substitution into the following equation:
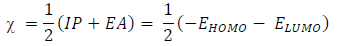 ***
***
(N from the inhibitor to the metal vacant d-orbital and the initial inhibitor-MS interaction were estimated using Equations 22 and 23, respectively:
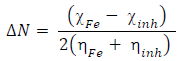 ***
***
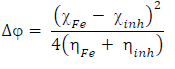 ***
***
Calculated values of all the variables obtained from Equations 17 to 21 are also presented in Table 8. The results favor FD as better corrosion inhibitor than ACP, because it has EHOMO, (N, ((, σ, ( and µ higher values. Also, FD better IE (%) than that of ACP was supported by its observed (E lower values. This theoretical proposal is in agreement with the results obtained for the average IE (%) of ACP and FD. Also, the relative closeness of the calculated global parameters between the two inhibitors explains why their IE (%) are also close to each other.
The corrosion inhibitor protonation is an essential step towards its adsorption, because higher fractions of inhibitor molecules are adsorbed in the protonated state. Energy minimization was first carried out on the inhibitors molecules, to identify the protonation sites, which were carboxyl oxygen and aromatic nitrogen in FD and ACP, respectively. Consequently, we calculated the two inhibitors protonation affinity , using the following Equation 24 36:
 ***
***
where Eprot ( mol(aq), Eneut ( mol(aq) and Eprot ( H + are the protonated inhibitor, neutral inhibitor and proton total energy, respectively. FD and ACP calculated PA values were 277.98 and 703.01 kJ/mol, respectively, which implies that the former can be easily protonated, because it requires lower energy than that of the latter. Therefore, FD IE (%) is expected to be better than that of ACP, as observed in the experimental results. Fig. 7 shows HOMO and LUMO optimized structures and gas-phase diagrams for ACP and FD.
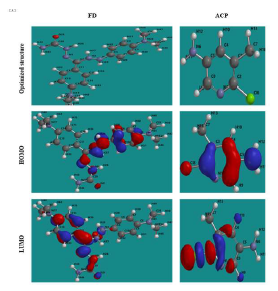
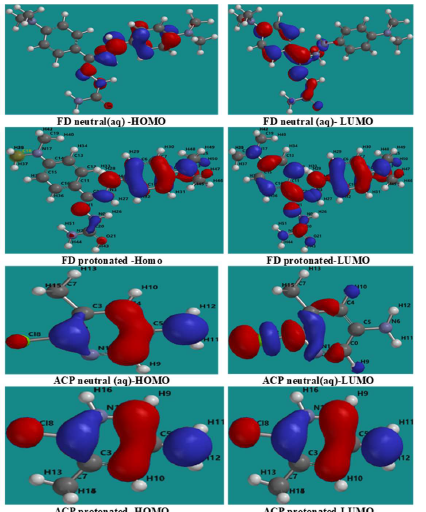
Fig. 8 shows similar diagrams for the inhibitors aqueous phase neutral and protonated forms. The diagrams reveal that the lobes are mostly concentrated in the benzene ring and on the heteroatoms, and that protonation seemed to enhance the inhibitors adsorption (especially FD), by increasing available active sites.
Recorded in Table 9 are FMO energies of neutral and protonated ACP and FD, in an aqueous solution.
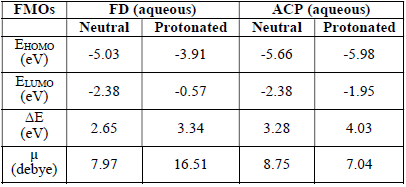
The results show more significant and favorable changes in the FMO of the FD protonated species than of that in the neutral species (in an aqueous medium). For example, EHOMO increased, while ELUMO decreased, due to protonation. The contrary was observed for ACP inhibitors, which also explains why ACP IE (%) is lower than that of FD.
LRD
Approaches to LRD analysis involve exploring the functions that can predict the molecules reactivity through their atoms. Some of the indices include charges on the molecules, FF, local σ and other parameters. FMO theory proposed that an electrophilic attack favors LUMO, while a nucleophilic attack favors HOMO. The electrons and charges involvement in the adsorption process can be simplified by ΔN from HOMO to LUMO, which corresponds to nucleophilic and electrophilic attacks, respectively. The transfer process depends on (E and other factors, such as electrons density in the respective sites, metal charge, etc. DFT was used to evaluate the condensed FF for the electrophilic and nucleophilic attacks, which can formally be defined according to the following equations 37:
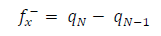 ***
***
 ***
***
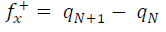
where qN, qN(1 and QN+1 are the ground state charges of the neutral, positive and negative species, respectively. In this study, different FD and ACP charges were used for evaluating FF indices, including EPC, MAC and NOBC. The results are shown in Tables 10-15.
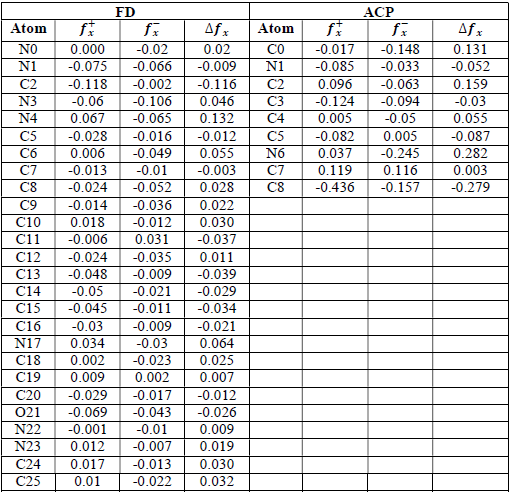
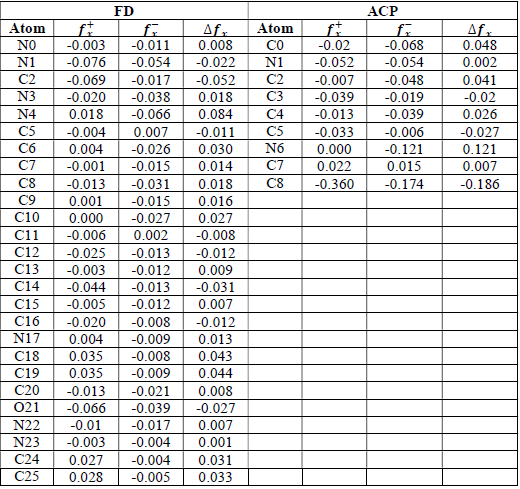
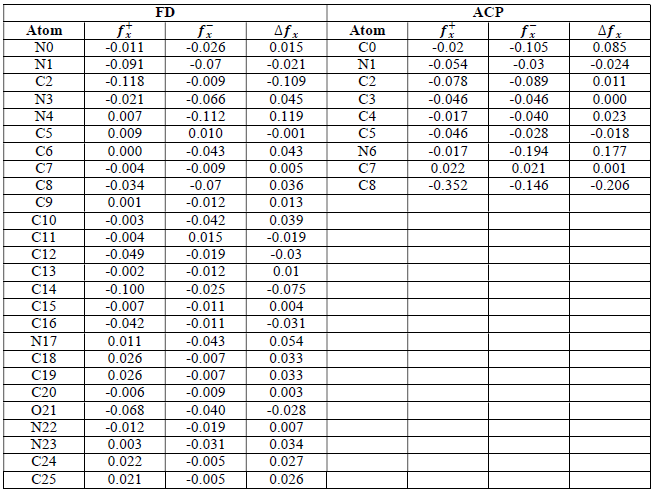
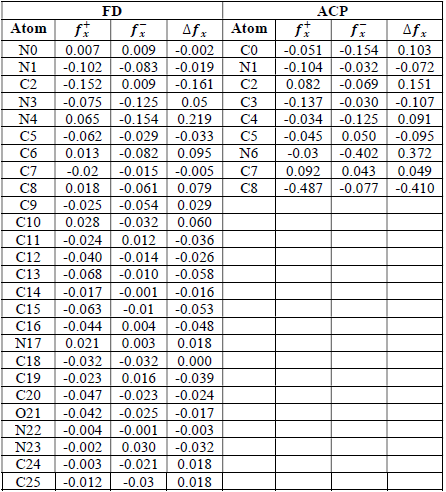
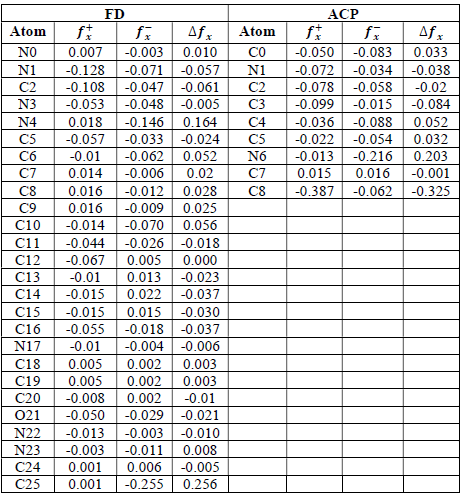
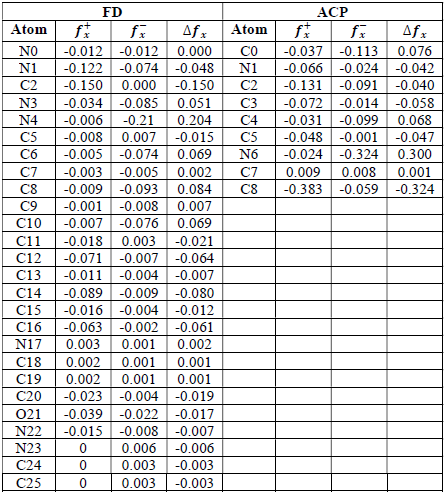
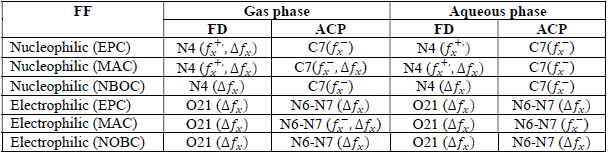
Since FD and ACP behavior was significantly influenced by protonation in the aqueous, gas and aqueous phases, FF were evaluated and applied for the interpretation of the respective reaction sites. The sites of nucleophilic and electrophilic attacks in FD and ACP, for both gas and aqueous phases, were predicted using different FF predictors, including 𝑓 𝑥 − , 𝑓 𝑥 + 𝑎𝑛𝑑 ∆ 𝑓 𝑥 . The nucleophilic attacks were at the N(4) and C(7) atoms, in FD and ACP molecules, respectively. The electrophilic attacks were located at the C(20)-O(21) and N(6)-N(7) bonds (which are also the most favorable sites for protonation), for FD and ACP, respectively (Table 16).
Binding energy
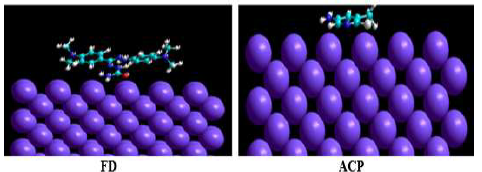
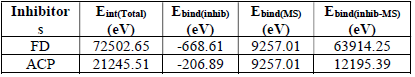
The interaction between the inhibitors and the MS surface was evaluated by calculating the binding energy that existed between the formers and the latter, after merging their optimized structures of the metal crystal (Fig. 9). Equation 25 was adopted to calculate the binding energy between MS and the inhibitors 38:
 ***
***
where 𝐸 𝐵𝑖𝑛𝑑(𝑇) and 𝐸 𝐵𝑖𝑛𝑑(𝐼𝑛ℎ𝑖𝑏𝑖𝑡𝑜𝑟) are MS and inhibitors total binding energies, respectively. The calculated inhibitors binding energies are shown in Table 17. The results reveal that FD binding energy (12195.39 eV) was lower than that of ACP (63914.25 eV). Therefore, FD average IE (%) was better than that of ACP, because the interaction between the MS surface and FD was stronger than that between the former and ACP.
Adsorption mechanism
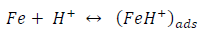
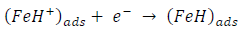
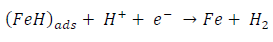
ACP and FD went through chemical adsorption, which involves electrons transfer. One general concept on the adsorption of a corrosion inhibitor is believed to be a displacement of an adsorbed water molecule from the metal surface by the inhibitor, as expressed in Equation 17. However, where other components (such as acidic anions) tend to be adsorbed, this model may not suffice to predict the adsorption mechanism. Therefore, to propose a suitable model, the mechanisms of MS anodic dissolution and the corresponding cathodic HER should be considered. The mechanism for MS anodic dissolution can be presented as follows:
 ***
***
 ***
***
 ***
***
On the other hand, the mechanism for cathodic HER can be written as:
 ***
***
 ***
***
 ***
***
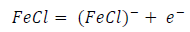
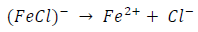
From the above, it is most probably that the initial mechanism was the adsorption of HCl- or SO4 2- ions released by the respective acid ionization 39, as shown in the following equations:
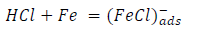 ***
***
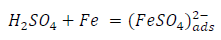 ***
***
However, without inhibitors, the passivation zone will be overcome, and MS will corrode. However, with an inhibitor, further adsorption may involve the anions (HCl- or SO4 2- ) displacement (Equation 27a) or join adsorption onto MS passivating layer (Equation 36):
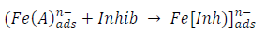 ***
***
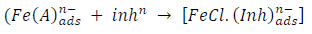 ***
***
where A is the conjugate base of the acid and Inh represents the charged/protonated inhibitor. In the above-proposed mechanism, whichever reaction is favored depends on several factors, especially temperature, protonation degree, etc.
Conclusions
The results of the present study and the findings drawn therein led to the following conclusions:
ACP and FD are good inhibitors for MS corrosion in both HCl and H2SO4 solutions. Although their IE (%) are relatively comparable, FD seems to perform slightly better than ACP.
ACP and FD IE (%) had a strong correlation with calculated quantum parameters, such as FMO energies, σ, ( and (N.
The inhibitors adsorption favored Langmuir’s, Temkin’s, Freundlich’s and Frumkin’s isotherms, and presented an energy barrier that suggested mixed type adsorption, with an initial physisorption mechanism.
Polarization data confirmed that the inhibitors majorly acted as cathodic, by retarding cathodic HER more than suppressing MS dissolution. Cdl varied inversely with Rct, and gave a strong signal that the inhibitors were effective against MS corrosion in the acidic media.
The protonated inhibitors adsorption seems to have prevailed over the neutral molecules adsorption. FF indices were useful in predicting the inhibitors adsorption sites, and the strong influence of the aqueous environment over the inhibitors reactivity was upheld through calculated aqueous phase data.
Acknowledgement
The authors acknowledge tertiary education trust fund of Nigeria for providing the computational chemistry calculations through National Research fund, with Professor Nnabuk Okon Eddy as Principal Investigator.
Authors’ contributions
Anand Balasubramanian: conceived and designed the analysis; collected the data; inserted data or analysis tools; wrote the paper. Vidyadharani Gopalakrishnan: conceived and designed the analysis; collected the data. Loganathan Subramanian: conceived and designed the analysis; collected the data. Rabiu Ibraheem Muhammed: conceived and designed the analysis; collected the data; inserted data or analysis tools. Rajni Garg: inserted data or analysis tools; edited and formatted the paper. Nnabuk Okon Eddy: inserted data or analysis tools; performed the analysis; wrote the paper.
Abbreviations
AC: alternating current
ACP: 6-chloro-5-methylpyridin-3-amine
AE: auxiliary electrode
C: concentration
Cdl: double-layer capacitance
CR: corrosion rate
DFT: density functional theory
E: electric potential
EA: electron affinity
Ecorr: corrosion potential
EHOMO: energy of the highest occupied molecular orbital
EIS: electrochemical impedance spectroscopy
ELUMO: energy of the lowest unoccupied molecular orbital
EPC: electrostatic potential charges
FD: ((Z)-2-(4-(dimethylamino)phenyl)(2-phenylhydrazinyl)methylene) hydrazinecarboxamide
FF: Fukui function
FMO: frontier molecular orbital
GDP: gross domestic product
H2SO4: sulfuric acid
H3PO4: phosphoric acid
HCl: hydrochloric acid
HER: hydrogen evolution reaction
HOMO: energy of the highest occupied molecular orbital
Icorr: corrosion current density
IE (%): inhibition efficiency
IP: ionization potential
kads: adsorption equilibrium constant
kads(FK): adsorption-desorption constant
LPR: linear polarization resistant
LRD: local reactivity descriptors
LUMO: energy of the lowest unoccupied molecular orbital
MAC: Mulliken atomic charges
MS: mild steel
NBOC: natural bond orbital charges
OCP: open circuit potential
PA: protonation affinity
PDP: potentiodynamic polarization
R: gas constant
R2: correlation coefficient
Rct: charge transfer resistance
RE: reference electrode
Rp: polarization resistance
SC: saturated calomel
SDF: spatial data file
SEM: scanning electron microscopy
SR: scanning rate
WE: working electrode
WL: weight loss
Symbols definition

