Introduction
Corrosion research has been among most trending study topics in the past few years, due to its diverse usage in constructional and industrial applications 1,2. Recently, a study revealed that corrosion causes economic losses of about 2.5 trillion US dollars a year, constituting almost 3.4% of the worldwide GDP 3. As corrosion is associated with economic and safety issues, it should be highly addressed by the researchers throughout the world.
Metals and alloys are exposed to hostile environments during their industrial usage, including manufacturing, processing and transportation, which accelerate their degradation. In particular, steel and its alloys are the most utilized metals in renowned industries, for different applications, due to their low cost and good mechanical strength, with high thermal and mechanical conductivity 4-6. However, their practical utility in industries is threatened during cleaning, pickling and oil well oxidization in acidic solutions that corrode them 7,8. This natural phenomenon can be minimized to a great extent through the use of corrosion inhibitors. The development of new, in particular, eco-friendly and green corrosion inhibitors is therefore urgently required, for ensuring humankind and environmental safety.
Natural products, such as plant extracts, are highly demanded, due to ecological consciousness and eco-friendly regulations in different fields of science and technology, since they are ecologically acceptable and renewable sources 9-11. Plant extracts corrosion inhibition activity is correlated to the presence of abundant chemical constituents, such as alkaloids, flavonoids and tannins, which have large potential to prevent corrosion 12,13. Alireza et al. have made a comparative study of henna extract and its constituents, namely, gallic and tannic acids, a-D-Glucose and Lawsone, for MS corrosion inhibition in HCl. Henna inhibitor molecules were chemisorbed on the MS surface, but the corrosion inhibition was slightly enhanced by oxygen scavenging 14. Mohsen et al. have analysed the effect of two oleo-gum resin exudates on MS corrosion inhibition in aggressive media. They acted as mixed-type inhibitors, predominantly controlling corrosion. EIS showed that corrosion was controlled by a charge transfer process 15.
Although many plant extracts have shown potential to mitigate corrosion, no study has yet investigated the effect of harsh conditions, such as high T, on their IE(%).
SVLE, which has been widely used in numerous applications 16, due to its significant nutritional value, lesser water requirements and high adaptability to a broad range of growing conditions, is greatly available. It is expected to show high corrosion IE(%), since it contains phenolic compounds, such as flavonoids 17.
Prompted by SVLE abovementioned properties, the present study aimed to measure the feasibility of using this natural, inexpensive and green corrosion inhibitor. Electrochemical measurement results showed good agreement with the MS surface examination by AFM and SEM. Furthermore, thermodynamic parameters that govern MS corrosion have also been evaluated, and showed SVLE great potential as corrosion inhibitor.
Experimental method
SVLE preparation
50 g of fresh and washed SV leaves were taken and poured into a 100 mL 0.5 M H2SO4 solution. This extract was refluxed for 180 min, allowed to cool down at 25 ºC, and filtered. Thus, 50% SVLE were obtained. From the proper extract dilution, solutions of 10, 20, 30 and 40% were obtained.
MS specimen preparation
MS specimens (composition: 95.5% Fe, 1.92% C, 0.034% S, 0.165% Si, 0.203% Cu and 0.60% Mn), with 1 x 1 cm2 exposed surface area, were encapsulated in an Araldite standard epoxy adhesive, and used as WE for electrochemical measurements, i.e. PDP and EIS measurements. To obtain a MS uniform surface, the exposed surface area was successively abraded with different grades of emery paper (i.e., 220, 400, 800, 1000 and 2000), and degreased with acetone and distilled H2O, in order to obtain polished coupons for electrochemical experiments.
Electrochemical techniques
SVLE was utilized with four different C: 10, 20, 30 and 40%. A three-electrode assembly cell was used to evaluate T effect on MS corrosion inhibition, at 298, 308, 318 and 328 K. This assembly was then kept in the water bath for 3 h, in order to attain a steady-state and OCP. An electrochemical work station impedance analyzer (CHI 760D) was used for investigations. Tafel plots were performed at a SR of 0.01 mV s-1, in an E range from -0.9 to + 0.0 V. Kinetic and activation parameters for adsorption and dissolution processes were then calculated. EIS measurements were performed by using an AC signal, with 5 mV amplitude, at OCP, in the frequency range from 105 to 1 Hz.
Surface characterization
Polished MS coupons were dipped into a 0.5 M H₂SO₄ solution without and with SVLE, in its highest and lowest C of 40 and 10%, for 1 day. MS coupons surface morphology was analyzed using Ziess S-3700 N SEM and Nanosurf Naio AFM, both from Germany.
Results and discussion
PDP study
The MS surface exhibited better corrosion inhibition with SVLE, as demonstrated by electrochemical PDP results from Tafel curves in H₂SO₄ (Fig.1 (a-d)).
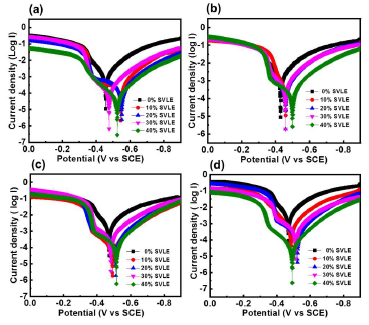
Figure 1 Tafel curves of MS in 0.5 M H₂SO₄ with different SVLE C, at: (a) 298; (b) 308; (c); 318; and (d) 328 K.
Corrosion electrochemical parameters values, such as Ecorr and Icorr, were calculated from Tafel curves (Table 1), following our previous article 18.
Table 1 PDP parameters for MS corrosion in 0.5 M H₂SO₄ with various SVLE C.
| T (K) | SVLE C in 0.5 M H2SO4(%) | Ecorr (mV) | βc (mV/dec) | βa (mV/dec) | Icorr (mA/cm2) | IE(%) | Θ |
|---|---|---|---|---|---|---|---|
| 298 | 0 | 457 | 114 | 61 | 1.017 | - | - |
| 10 | 547 | 124 | 172 | 0.303 | 70.14 | 0.701 | |
| 20 | 553 | 220 | 151 | 0.219 | 78.46 | 0.784 | |
| 30 | 478 | 108 | 90 | 0.107 | 89.40 | 0.894 | |
| 40 | 526 | 119 | 108 | 0.064 | 93.65 | 0.936 | |
| 308 | 0 | 429 | 116 | 61 | 1.267 | - | - |
| 10 | 458 | 137 | 108 | 0.461 | 63.58 | 0.635 | |
| 20 | 459 | 111 | 43 | 0.314 | 75.21 | 0.752 | |
| 30 | 458 | 173 | 119 | 0.164 | 87.04 | 0.870 | |
| 40 | 502 | 156 | 159 | 0.104 | 91.74 | 0.917 | |
| 318 | 0 | 474 | 144 | 66 | 1.984 | - | - |
| 10 | 489 | 148 | 683 | 0.786 | 60.36 | 0.603 | |
| 20 | 514 | 116 | 211 | 0.605 | 69.46 | 0.694 | |
| 30 | 484 | 116 | 58 | 0.302 | 84.74 | 0.847 | |
| 40 | 517 | 107 | 194 | 0.202 | 89.80 | 0.898 | |
| 328 | 0 | 470 | 133 | 63 | 3.009 | - | - |
| 10 | 487 | 120 | 86 | 1.293 | 57.02 | 0.570 | |
| 20 | 523 | 132 | 542 | 1.075 | 64.27 | 0.642 | |
| 30 | 514 | 119 | 160 | 0.625 | 79.21 | 0.792 | |
| 40 | 504 | 115 | 43 | 0.420 | 86.02 | 0.860 |
IE% values were obtained from PDP, using the following relation 19:
where Icorr and Icorr(Inh) (in uninhibited and inhibited solutions, respectively) were evaluated by the intersection of extrapolated Tafel lines. βa and βc varied with the addition of different SVLE C, implying controlled reactions. Additionally, the extract not only hindered cathodic HER, but also retarded MS anodic dissolution. As the extract C increased, inhibition of cathodic and anodic reactions became more visible.
Recent studies have shown that, if the inhibited solution Ecorr values are ± 85 mV with respect to the corrosive medium, the inhibitor is categorized as of the anodic or cathodic types 20-22. The observed data (Table 1) depict that Ecorr values varied from 10 to 75 mV, towards less negative values. Ecorr value did not change significantly by adding SVLE, which indicates that the inhibition behavior was of the mixed type, but with a slight predominance towards the cathodic direction, at lower C. A prominent decreasing trend in Icorr values was observed with SVLE in H₂SO₄. Icorr values decreased with higher SVLE C, and increased with a rise in T, which indicates that the extract is an effective inhibitor in higher C for MS corrosion in H₂SO4, at lower T. It is noticeable that, at SVLE lowest and highest C (10 and 40%), IE(%) was 70.1 and 93.6%, respectively. This could be due to the better ( accomplished by SVLE molecules onto the MS surface 23. Further, SVLE IE(%) showed a decreasing trend with an increase in T, but it still was 86%, at 328 K (Fig. 1). A similar decreasing trend in IE(%) was seen for the other three C.
According to Le-Chatelier’s principle, the adsorption exothermic reaction started to move in the opposite direction, leading to the extract molecules desorption from the MS surface, as the system T increased 24. Therefore, ( by the extract molecules decreased with increasing T, thereby diminishing IE(%). These results suggested that SVLE adhered onto the MS surface, which hindered anodic reaction kinetics and retarded MS dissolution, even under high T conditions.
Adsorption isotherm
( is an important parameter for studying the adsorption process involved during corrosion inhibition. ( values for various SVLE C in 0.5 M H2SO4 were evaluated from PDP studies, in the T range from 298 to 328 K (Table 1). The best correlation between the electrochemical investigational outcomes and adsorption functions was evaluated by the Langmuir’s adsorption isotherm, according to the relation 25:
The plot of C/(, as a function of SVLE C in H2SO4, with a raise in T from 298 to 328 K, exhibits a straight line (Fig. 2).
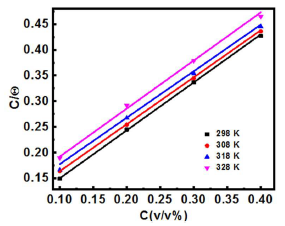
Figure 2 Langmuir’s adsorption isotherm for SVLE molecules adsorbed onto the MS surface in 0.5 M H2SO4, at various T.
The linear regression parameters obtained at different T are given in Table 2.
Table 2 Linear regression parameters for SVLE.
| T | Intercept | Slope | R2 |
|---|---|---|---|
| 298 K | 0.056 | 0.934 | 0.993 |
| 308 K | 0.072 | 0.914 | 0.994 |
| 318 K | 0.086 | 0.905 | 0.979 |
| 328 K | 0.098 | 0.936 | 0.976 |
It is apparent, from the results, that all R2 values were approximately equal to 1, which signifies that SVLE molecules that were adsorbed onto the MS surface followed the Langmuir’s adsorption isotherm. Calculations for the adsorption process from the straight line obtained by plotting C/θ versus C (Fig. 2) show the correlation between Kads and ΔGºads26.
The determined thermodynamic parameters are shown in Table 3.
Table 3 Thermodynamic parameters obtained for SVLE molecules adsorbed onto the MS surface, at various T.
| T (K) | Kads (L/mol) | ΔG°ads (kJ/mol) | ΔH°ads (kJ/mol) | ΔS°ads (k/J mol) |
|---|---|---|---|---|
| 298 | 17.71 | -17.07 | -10.01 | 23.69 |
| 308 | 13.84 | -17.01 | 22.72 | |
| 318 | 11.50 | -17.07 | 22.20 | |
| 328 | 10.15 | -17.27 | 22.13 |
It is clearly indicated that Kads decreased slightly as T increased, which confirms that SVLE molecules were strongly adsorbed onto the MS surface. Adsorbed SVLE molecules tended to desorb from the MS surface with elevated T, and IE(%) also decreased 27,28.
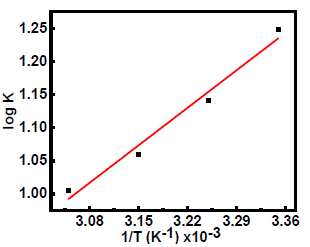
Further, ΔH°ads was evaluated from the plot of Kads log variation against 1/T (Fig. 3).
ΔH°ads negative value (-10.01 kJ/mol) indicates that SVLE molecules adsorption onto the MS surface was a spontaneous and exothermic process 29,30, which concurs with the decrease in IE(%) at elevated T. Usually, ΔG°ads values up to -20 kJ/mol signify that the interaction between the inhibitor and the charged metal was electrostatic 31,32. Calculated ΔG°ads values ranged from -17.01 to -17.27 kJ/mol, which means that SVLE physisorption occurred onto the MS surface immersed in H2SO433,34.
Additionally, ΔS°ads positive values indicate an increase in the adsorption process entropy, which can be explained by considering a substitution mechanism. When SVLE molecules in the aqueous phase are getting adsorbed onto the MS surface, they and H2O molecules at the electrode surface swap sites with each other. This way, the inhibitor molecules adsorption takes place when H2O molecules simultaneously leave their position and enter in to the solution. ΔS°ads and desorption process algebraic sum create a net positive ΔS change. ΔS value reveals that SVLE molecules adsorption was not reversible, which substantiates the inhibitor good thermal stability 35.
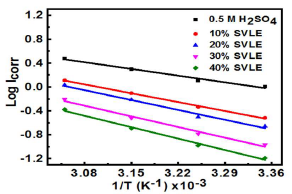
Arrhenius equation was used to calculate MS Ea in H2SO4, which was given by equation 36:
where A is the Arrhenius factor and R is the universal gas constant. Fig. 4 presents the Arrhenius plots of Icorr natural logarithm versus T reciprocal.
CR decreased in SVLE presence, with a marked increase in Ea values (Table 4).
Table 4 Ea values for MS corrosion in solutions without and with SVLE.
| SVLE C in 0.5 M H2SO4 (%) | Ea (kJ/ mol) |
|---|---|
| 0 | 13.37 |
| 10 | 17.61 |
| 20 | 19.60 |
| 30 | 21.16 |
| 40 | 22.68 |
Ea was found to be 22.68 and 17.61 kJ/mol, at 40 and 10% SVLE, respectively. As already reported, based on Ea value, the adsorption phenomena can be classified into physisorption (Ea < 40 kJ/mol) and chemisorption (Ea > 80 kJ/mol) 37. This confirms that SVLE was physically adsorbed onto the MS surface, acting as a protective coverage against H2SO4.
EIS
EIS measurements were conducted for examining the corrosion process quantitative kinetics. The impedance measurements were carried out in a 0.5 M H2SO4 solution without and with SVLE, at 40, 30, 20 and 10%, in a three electrode cell assembly, as shown in Fig. 5(a).
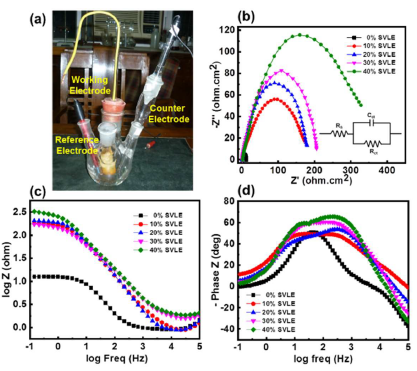
Figure 5 (a) Three electrode cell assembly showing MS WE, calomel RE and Pt CE in 0.5 M H2SO4 that acted as electrolyte or corrosive medium. EIS parameters: (b) Nyquist (inset shows an equivalent circuit model); (c) Bode; and (d) phase angle-frequency plots in a 0.5 M H2SO4 solution without and with various SVLE C, at 298 K.
EIS results are presented in the form of Nyquist and Bode plots (Fig. 5(b) and (c)). Nyquist plot possesses a depressed capacitive loop, which is attributed to a single time constant for H2SO4 and SVLE solutions, at 298 K. The diameter of these semicircle increased with higher SVLE C, indicating the effective extract inhibition of MS surface corrosion. This single capacitive loop suggests that MS corrosion was primarily controlled by a charge transfer process. However, the deviation from a perfect semicircle is attributed to porosity in mass transport effects, and frequency dispersion and relaxation 38.
The Bode plot represents an increase in the absolute impedance value |Z|, at low frequencies, after MS preliminary treatment with SVLE. An increase in the extract C, from 10 to 40%, led to its effective adsorption onto the MS surface, which protected it more effectively from corrosion. Fig. 5(d) is in agreement with Bode plot, showing a continuous well-pronounced phase angle shift at higher frequencies, which indicates that the protection barrier was less stable. It also suggests that the pseudo-capacitive film has been formed onto the MS surface, inhibiting its corrosion in H2SO439.
Impedance parameters, such as Cdl, Rct, frequency at maximum Z’’max (fmax) and IE(%), are listed in Table 5. Further, IE(%) was calculated by using the following formula 40:
where Rct (Extract) and Rct (Acid) are charge transfer resistances with and without SVLE, respectively.
From Table 5, it was noted that, with higher SVLE C, Rct increased, and its highest value, obtained with 40% SVLE, was 396.65 Ω/cm2, and IE(%) was 93.4%. 30% SVLE gave a Rct value of 191.79Ω cm2, with an IE(%) of 86.4%. A lower SVLE C produced decreased Rct values of 127.74 and 88.83 Ω/cm2, with an IE(%) of 79.5 and 70.6%, respectively.
Table 5 Electrochemical impedance parameters in 0.5 M H2SO4 without and with different SVLE C, at 298 K.
| Extract | C (%) | Rct (Ω/cm2) | Cdl (μF/cm2) | Fmax | IE% | ( | Phase angle α° |
|---|---|---|---|---|---|---|---|
| H2SO4 | 0.5 | 26.06 | 369.67 | 9.03 | - | - | - |
| SVLE | 40 | 396.65 | 4.50 | 89.16 | 93.42 | 0.934 | 63 |
| 30 | 191.79 | 11.70 | 70.93 | 86.41 | 0.864 | 57 | |
| 20 | 127.74 | 31.23 | 39.90 | 79.59 | 0.795 | 46 | |
| 10 | 88.83 | 77.42 | 23.15 | 70.66 | 0.706 | 43 |
On the contrary, SVLE absence gave a very lower Rct value of 26.06 Ω/cm2. It is noticeable from the results that Cdl decreased with an increase in Rct. Due to Cdl reduction, it can be ascertained that SVLE molecules were adsorbed onto the MS surface, forming a protective layer on the metal-electrolyte surface 41,42.
Morphological characterization
Complimentarily, AFM micrographs investigated MS topography and surface properties. In the present study, MSR was quantitatively evaluated (Table 6), in order to predict its morphological changes after SVLE addition.
Table 6 AFM roughness data for the MS surface in 0.5 M H2SO4 without and with SVLE.
| Extract | C (%) | SR average area (nm) |
|---|---|---|
| Polished MS | - | 125.54 |
| H2SO4 | 0.5 | 964.47 |
| SVLE | 10 | 328.97 |
| SVLE | 40 | 204.00 |
The plain MS surface morphology shown in Fig. 6(a) clearly displays almost no roughness. The micrographs further revealed that the MS surface immersed in H2SO4 with 10 and 40% SVLE was smoother and less damaged than the one dipped into the blank aggressive medium (Fig. 6(b-d)). Fig. 6(b) and Table 6 show the corroded MS bumpy structure, with an average roughness of 964.47 nm, without SVLE. However, a smoother MS surface morphology was obtained with higher (40%) than with lower (10%) SVLE C, as can be noticed by their MSR values of 204.0 and 328.97 nm, respectively.
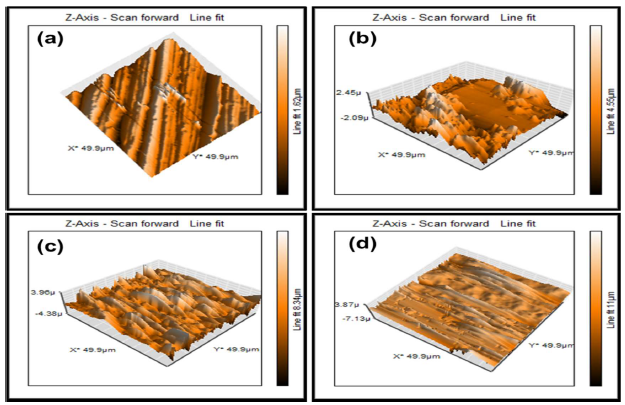
Figure 6 AFM images with surface height for MS: (a) polished surface; (b) in 0.5 M H2SO4; (c) in 10% SVLE; and (d) in 40% SVLE.
In addition to this, SEM micrographs (Fig. 7) investigated 10 and 40% SVLE molecules interaction with the MS surface in H2SO4 (Fig. 7(c-d)).
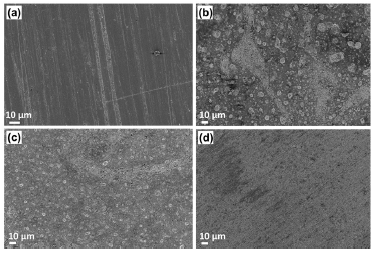
Figure 7 SEM micrographs for MS surface: (a) polished; (b) in 0.5 M H2SO4; (c) with 10% SVLE; and (d) with 40% SVLE.
As shown in the micrographs, SVLE mitigated MS corrosion process in H2SO4. The SEM image of the extract lower C (10% (Fig. 7(c)) displayed MS surface slight roughness, with some cracks and pits, while, at a higher C (40 % (Fig. 7 (d))), it is as smooth as the polished one shown in Fig. 7(a).
Conclusions
SVLE is the most abundant, economical, easy processable, effective and efficient eco-friendly inhibitor for MS corrosion in aggressive media. Electrochemical measurements have showed that SVLE retarded MS corrosion in 0.5 M H2SO4, with high IE(%) of 93.6%, which was 86%, even at elevated T. SVLE is a mixed type inhibitor, with a slight predominance towards the cathodic direction, at lower C. SVLE molecules absorbed onto the MS surface followed Langmuir’s isotherm. ΔG°ads values signify that SVLE mechanism of adsorption onto the MS surface in a H2SO4 solution involved physisorption. IE(%) data obtained from EIS and PDP measurements showed analogous results, in agreement with the diminished MSR shown by AFM and SEM micrographs.
Authors’ contributions
S. Sharma: was in the main charge of this research; conceived the idea and supervised the whole project; performed the experiments; analyzed the experimental data; prepared the paper. M. Sharma: prepared the paper. N. Dheer: discussed the results; helped in the analysis; edited the paper. S. K. Ujjain: discussed the results; helped in the analysis; edited the paper. P. Ahuja: discussed the results; helped in the analysis; edited the paper. G. Singh: edited the paper. R. Kanojia: conceived the idea; supervised the whole project; prepared and edited the paper.
Abbreviations
AC: alternating current
AFM: atomic force microscope
C: concentration
Cdl: double layer capacitance
CE: counter electrode
CR: corrosion rate
E: electric potential
Ea: activation energy
Ecorr: corrosion potential
EIS: electrochemical impedance spectroscopy
HCl: hydrochloric acid
HER: hydrogen evolution reaction
Icorr: corrosion current density
IE(%): inhibition efficiency
Kads: adsorption equilibrium constant
MS: mild steel
MSR: metal surface roughness
OCP: open circuit potential
PDP: potentiodynamic polarization
R2: regression coefficient
Rct: charge transfer resistance
RE: reference electrode
SEM: scanning electron microscope
SR: scan rate
SVLE: Sorghum vulgare leaf extract
T: temperature
WE: working electrode
Symbols definitions


