Introduction
MS is the most widely used Fe alloy in industries. It comes very frequently in contact with Cl- ions, under numerous conditions and circumstances 1. Cl- ions are known to be aggressive towards MS, causing severe corrosion problems. Various inorganic compounds, e.g., nitrates, sulfates, silicates and chromates, have been reported as inhibitors of MS corrosion in water containing Cl-, but their IE(%), when used by themselves, was found to be very low 2-4. Zn2+, as inhibitor of steel corrosion in water, has been known since the 19th century, with many examples of its use in combination with other compounds, in order to improve metals protection 5-9. Zn salts relatively low toxicity and ready availability have led to their wide use in practice.
Many organic composites with N, S and P atoms have also been examined as corrosion inhibitors for Fe dissolution in acidic and halide media 10-13. Compounds containing P, such as phosphonates and polyphosphates 14,15, have also been included among such inhibitors. In fact, such composites, in combination with Zn2+16-19, have shown synergistic effects, and can provide high IE(%) for MS corrosion in water containing Cl-. In various industries, water is in great demand, and its largest source is sea water, which has high corrosivity, due to the presence of approx. 3.5% NaCl 20-24. Moreover, MS, the cheapest and more applicable material in industries, gets attacked by Cl-. So, it becomes a basic need to investigate various corrosion inhibitors for MS in 3% NaCl solutions 25-30.
Experimental procedure
Electrochemical cell
The electrolysis cell was a borosilicate glass (Pyrex®) cylinder closed by cap, with three apertures. The used WE was MS, and its chemical composition is summarized in Table 1. The investigated surface had 1 cm2. Before each experiment, MS was polished using emery paper until 1500 grade, cleaned with ethanol, washed with distilled water and dried at room T. MS, Pt and SC were used as WE, CE and RE, respectively. For long exposure experiments, between two measurements, the RE was washed from the test solution, for minimizing its contamination by Cl-, and the WE was set in immersion for 30 min, before each test. Also, the three Ti glasses were very soluble in a NaCl solution.
Table 1 MS chemical composition (wt%).
| C | Si | Mn | Cr | Mo | Ni | Al | Cu | Co | V | W | Fe |
|---|---|---|---|---|---|---|---|---|---|---|---|
| 0.11 | 0.24 | 0.47 | 0.12 | 0.02 | 0.1 | 0.03 | 0.14 | <0.0012 | <0.003 | 0.06 | Balance |
Glasses preparation
The glasses were elaborated by direct melting of NaPO3 and TiO2, with the compositions (100-x) NaPO3-x TiO2 (x = 0, 5 and 7% mol), in stoichiometric proportions. The reagents were finely ground in an agate mortar, and then placed in a porcelain crucible. Two thermal stages for minimizing P2O5 evaporation, at 300 and 700 ºC, during 1 and 2 h, respectively, were achieved. The melting T (1100 ºC) of the most refractory composition was used as the preparation T for the entire composition series of this system. Finally, after heating at the preparation T, for 30 min, the glasses were poured into a SS plate.
Polarization measurements
The WE was immersed in a 3% NaCl solution, during 30 min, until the Ecorr steady state was reached. The cathodic polarization curve was recorded from Ecorr, towards a negative direction, with a SR of 1 mV/s. After this scan, the WE was kept in the solution, until the steady state Ecorr (±0.02 V) was reached. The anodic polarization curve was recorded from Ecorr, towards a positive direction, also at 1 mV/s. The obtained polarization curves were corrected for ohmic drop, and the electrolyte resistance was determined by EIS. These measurements were carried out using a PGZ100 potentiostat monitored by a personal computer. For each C, three independent experiments were performed. The mean values and SD were also reported. However, the overall icorr was considered as the sum of two contributions, ia and ic. For the domain not too far from OCP, we can consider that both processes obeyed the Tafel law (Eq. 1) 2,31:
where icorr,. βa and βc are expressed in A/cm-2 and V-1, respectively. These constants are related to β (V/dec-1), in a usual logarithmic scale, by the following equation:
The corrosion parameters were then evaluated by the NLS method, with EC-Lab software, applying that equation. However, for this calculation, the applied E range was limited to ±0.100 V around Ecorr . Thus, a significant systematic divergence was sometimes observed for both anodic and cathodic branches. IE(%) was calculated using the following equation 2:
where iº corr and icorr are represent values without and with inhibitors, respectively.
EIS measurements
EIS measurements were carried out using a transfer function analyzer (Voltalab PGZ100, Radiometer Analytical), over the frequency range from 100 kHz to 100 mHz, with 10 points per decade. The amplitude of the AC signal was 10 mVrms. All experiments were performed at OCP. The obtained impedance data were analyzed in terms of the equivalent electrical circuit, using Bouckamp’s program 32. IE(%) applied was evaluated from Rp (which was obtained from the semicircle diameter in Nyquist representation), with the following equation 33:
where Rº p and Rp represent values without and with inhibitors, respectively.
Surface studies
In order to support electrochemical results, surface morphological SEM was used for the MS specimens immersed in a 3% NaCl solution, during 24 h, without and with Ti glasses.
Results and discussion
FTIR analysis
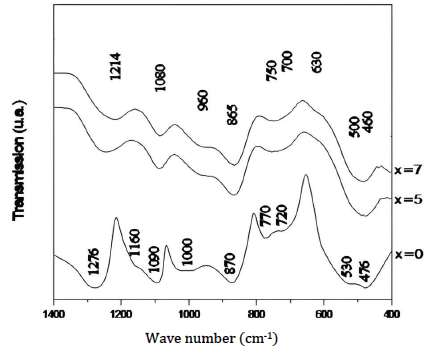
The infrared spectra of the Ti glasses system, in the frequency range from 400 to 1400 cm-1, are shown in Fig. 1.
The different spectra are composed of broad lines that are typical of amorphous systems.
The plot, representative of NaPO3 (50Na2O - 50P2O5) (x = 0) is consistent with data reported in the literature on this type of composition 34. We found AVV and SVV of the PO2 groups at 1276 and 1160 cm-1, respectively, which are characteristic of highly condensed phosphates. The absorptions at 1090 and 1000 cm-1 correspond to AVV and SVV of the PO3 groups (terminal groups), respectively. The bands located around 870 and 750 cm-1 (doublet) are attributed to AVV and SVV absorptions of the P-O-P bonds, respectively. All the deformation vibrations of PO4 are grouped in the area from 530 to 470 cm-1.
The spectra corresponding to the glasses containing Ti (x = 0, 5 and 7) show absorption bands typical of NaPO3 glass. However, the band attributed to the AVV of PO2 shifted from 1276 cm-1, for the NaPO3 glass, to 1214 cm-1, for the (45)Na2O-10TiO2-(45)P2O5 composition. This result was expected, since the phosphate chains interact more strongly with Ti than with Na and, therefore, the P-O bonds that bind with Ti ions are longer than those that bind with Na ions.
Along with the shift in the bands related to AVV of PO2, the intensities of the absorption bands corresponding to AVV of O-P-O and SVV of P-O-P decreased with higher TiO2 content. These changes in the spectra of glasses with higher TiO2 C were due to a decrease in the length of the phosphate chains 35.
NaPO3 depolymerization by TiO2 led to the formation of short phosphate chains, characterized by the appearance of the AVV of PO2 at 1214 cm-1. Indeed, this band appears at 1000-1240 cm-1 in P 4 O 13 6− , and at 1215 cm-1 in Na5P3O1034.
XRD
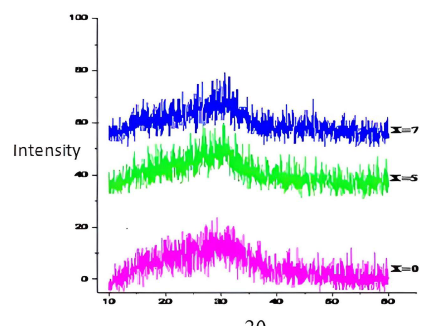
In order to confirm the amorphous nature of our processed samples, XRD was performed. The recorded curves (Fig. 2) do not show diffraction peaks on our synthesized glass samples, but they show diffuse and broad peaks characteristic of the glassy state.
PDP
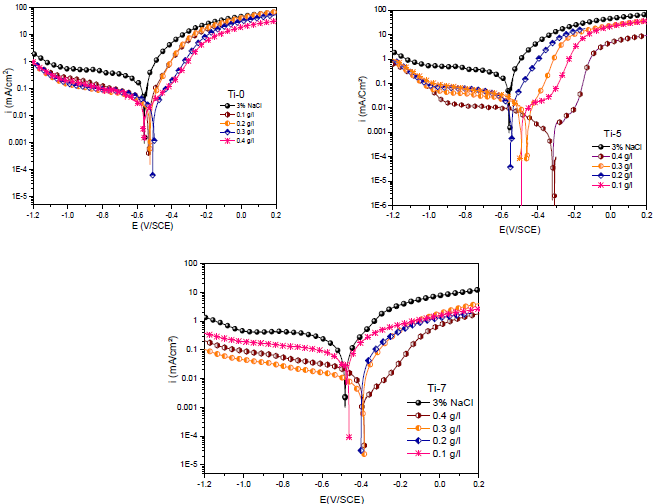
PDP curves of MS in the 3% NaCl solution without and with the three inhibitors, in various C, are presented in Fig. 3.
The C range of Ti-0, Ti-5 and Ti-7 was from 0.1 to 0.4 g/L. All these curves were obtained after 1 h of immersion of the electrode in the electrolytic solution at OCP Ecorr36,37. Then, cathodic and anodic polarization curves were recorded from independent experiments. For the cathodic and anodic scans, the initial E values were slightly more positive and negative, respectively, from Ecorr.
From polarization diagrams shown in Fig. 3, it is evident that the inhibitors suppressed both cathodic and anodic reactions. Table 2 shows that Ti-0, Ti-5 and Ti-7, at the optimum C of 0.4 g/L, reached the highest IE(%) values of 92.8, 99 and 98.3%, respectively, and it also displays parameters, such as Ecorr, icorr, βc and βa, derived through the extrapolation method. βc values for the inhibitors changed with higher C than those of the blank solution, which suggests their effect on the kinetics of H2 release. When Ti-0, Ti-5 and Ti-7 C were raised to 0.4 g/L, βa values decreased to 110, 8.83 and 104 mV/dec-1, respectively 38-40.This implies that the kinetics of Fe dissolution in 1 M HCl was modified by these compounds, during the protection process, which can be attributed to their adsorption onto the MS surface active centers. The icorr values decreased with higher C of the inhibitors in 1 M HCl, reaching their lowest values at 0.4 g/L 41-44.
Table 2 Electrochemical parameters for MS in NaCl 3% containing different inhibitors C.
| Medium | Conc. (g /L) | Ecorr (mV/SCE) | icorr (µA/cm-2) | β (mV/dec) | IE (%) | |
|---|---|---|---|---|---|---|
| -(c | (a | |||||
| 3% NaCl | - | 559 | 280 | 121 | 121 | - |
| Ti-0 | 0.1 | 532 | 37 | 177 | 119 | 86,7 |
| 0.2 | 524 | 35 | 158 | 97 | 87,5 | |
| 0.3 | 499 | 22 | 176 | 104 | 92,1 | |
| 0.4 | 558 | 20 | 145 | 110 | 92,8 | |
| Ti-5 | 0.1 | 498 | 27 | 2.48 | 10.2 | 90 |
| 0.2 | 594 | 40 | 12 | 9 | 85 | |
| 0.3 | 463 | 14 | 4.64 | 7.93 | 94 | |
| 0.4 | 320 | 3 | 10.84 | 8.83 | 99 | |
| Ti-7 | 0.1 | 478 | 22 | 73 | 138 | 92 |
| 0.2 | 404 | 14 | 75 | 142 | 95 | |
| 0.3 | 394 | 12 | 95 | 120 | 95.6 | |
| 0.4 | 390 | 5 | 101 | 104 | 98.3 | |
Tafel plots revealed that, with the increase in the three compounds C, anodic and cathodic icorr decreased, Ecorr shifted to more positive values, and both cathodic and anodic β were affected. These results confirm the inhibitor anodic activity. Accordingly, Ecorr shifted to the cathodic branch direction, but the changes in the anodic β were more significant, implying the inhibitor role on the anodic MS dissolution mechanism. The lowest icorr value was obtained at the highest inhibitors C. The polarization data revealed that 0.4 g/L of the three inhibitors offered higher corrosion IE(%) than that of other C. These results showed the high capability of Ti glass inhibitors for MS CR reduction, through adsorption and/or film formation on the active sites 34,45.
EIS
MS specimens were immersed in the 3 wt% NaCl solutions with and without the three inhibitors, and their influence on the corrosion IE(%) of the samples was investigated by EIS. Fig. 4 shows the Nyquist plots for the various MS samples, which exhibited larger semicircles for the solutions with inhibitors than for those without them.
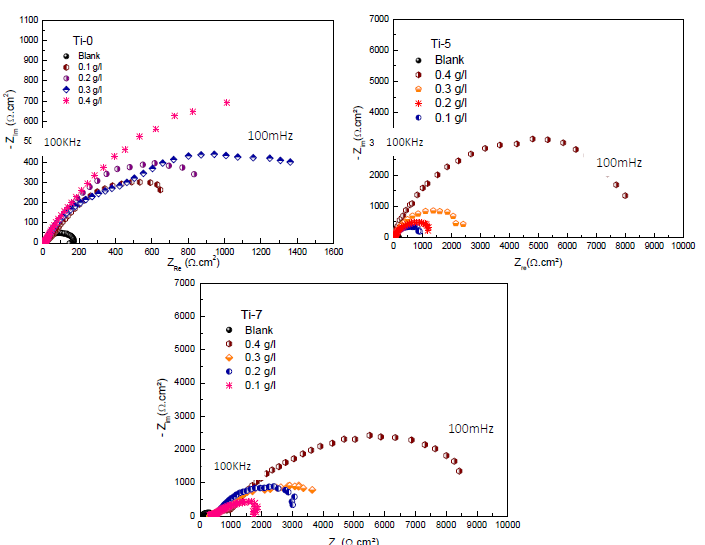
Figure 4 Nyquist diagrams for MS without and with Ti-0, Ti-5 and Ti-7, in different C, after 30 min of immersion.
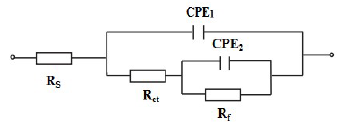
In the case of brass, equivalent circuits (Fig. 5) were connected in series with two times constants. CPE means the possibility of a non-ideal capacitance, where n is the variable. CPE impedance is given by the following equation 35,46:
where A is CPE magnitude, ω is the sine wave modulation angular frequency, 1 is the imaginary number and n is an empirical exponent that measures the deviation from the ideal capacitive behavior. Depending on n values (0, 1, -1 and 0.5), CPE can represent resistance, capacitance, inductance and Warburg impedance, respectively. 47. The Cdl values derived from CPE and τ of the charge-transfer process, can be calculated using eqs. 6 and 7, respectively 48.
The proposed electrical circuit, as shown in Fig. 5, was used to describe the MS /electrolyte interface model. The employed circuit allowed for the identification of Rs, Rct and Rf. It is noteworthy that the Cdl value was affected by imperfections on the surface, and this effect was simulated via CPE 49,50. Qct and n parameters were employed when the surface heterogeneity could affect them. This heterogeneity might be due to surface roughness, corrosion product adsorption and porous layer formation. Therefore, the expression differs from CPE impedance frequently used nowadays, where the impedance of parallel connection between CPE and Rs will be expressed as 51:
Table 3 Electrochemical impedance parameters for MS corrosion in 3%NaCl with various C of Ti-0, Ti-5 and Ti-7.
| Inhibitors | C (g/L) | Rs (Ω/cm²) | Qf (µF/cm²) | nf | Rf (KΩ/cm²) | Qct (µF/ cm2) | nct | Rct (KΩ/ cm²) | Rp (KΩ/ cm2) | IE(%) |
|---|---|---|---|---|---|---|---|---|---|---|
| 3% NaCl | - | 10 | - | - | - | - | - | 0.175 | 0.165 | - |
| Ti-0 | 0.1 | 11 | 3145 | 0.706 | 0.522 | 2057 | 0.937 | 0.676 | 1.187 | 86.1 |
| 0.2 | 13 | 3648 | 0.602 | 0.258 | 3600 | 0.601 | 0.979 | 1.224 | 86.5 | |
| 0.3 | 7 | 808 | 0.633 | 0.932 | 3198 | 0.574 | 1.082 | 2.007 | 91.7 | |
| 0.4 | 10 | 3352 | 0.724 | 1.144 | 7623 | 1 | 0.912 | 2.046 | 91.9 | |
| Ti-5 | 0.1 | 15 | 550 | 0.70 | 0.04 | 30 | 0.54 | 1.1 | 1.1 | 85 |
| 0.2 | 12 | 107 | 0.67 | 0.1 | 146 | 0.98 | 1.5 | 1.6 | 90 | |
| 0.3 | 12 | 441 | 0.68 | 0.3 | 72 | 0.97 | 2.4 | 2.7 | 94 | |
| 0.4 | 8 | 61 | 0.85 | 2.1 | 75 | 0.65 | 6.9 | 9 | 98 | |
| Ti-7 | 0.1 | 32 | 41 | 0.52 | 0.153 | 495 | 0.43 | 1.875 | 2.028 | 92 |
| 0.2 | 31 | 71 | 0.6 | 0.109 | 491 | 0.65 | 3.250 | 3.359 | 95 | |
| 0.3 | 32 | 115 | 0.52 | 0.420 | 203 | 0.76 | 4.420 | 4.840 | 95.6 | |
| 0.4 | 43 | 22 | 0.57 | 0.707 | 171 | 0.63 | 8.920 | 9.627 | 98.3 |
In the 0.4 g/L inhibited solutions, the impedance responses in the low frequency presented an increasing trend over time. It seems that more inhibiting species were available at the MS surface active zones with higher Ti glasses C up to 0.4 g/L. This means that this C of Ti-0, Ti-5 and Ti-7 in 3% NaCl led to a higher corrosion IE(%).
Inspection of the results in Table 3 indicates that Rct value increased with higher inhibitors C. In addition, CPE value varied regularly with the Ti glasses C. The change in Rct and CPE values can be related to the gradual removal of water molecules by the inhibitors molecules on the MS surface, which led to a decrease in the number of active sites prone to the corrosion reaction 52. The increase in Rct value was due to the formation of a protective film on the metal/solution interface. The ongoing stability of ( (in the range of 0.79-0.93) indicates that MS dissolution mechanism was charge transfer controlled, without and with the inhibitors. Moreover, Cdl decreased with higher Ti-0, Ti-5 and Ti-7 C, which was probably caused by a decrease in the local dielectric constant and/or by an increase in the electrical double layer thickness at MS surface. This suggests water molecules replacement (with high dielectric constant) by the inhibitors molecules (with low dielectric constant), which enhanced MS resistance 53. The thickness of this protective layer was evaluated from the Helmholtz model given by the following equation 54:
where ε0 is the permittivity of space, ε is the local dielectric constant, e is the film thickness and S is the surface area. Eq. 10 suggests that Cdl is inversely proportional to the protective layer thickness. So, the decrease in Cdl values resulted in an increase in IE (%) values (Table 3).
SEM analysis
SEM micrographs of MS surfaces after 24 h immersion in 3% NaCl, without and with inhibitors (0.4 g/L), are shown in Fig. 6.
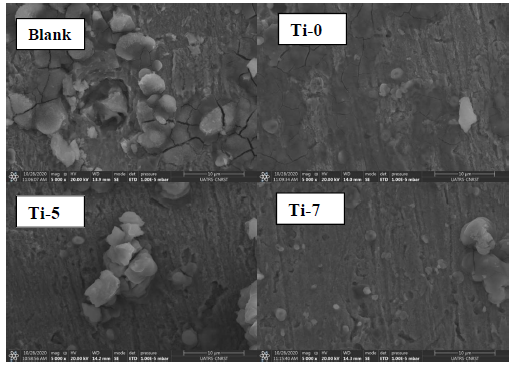
Figure 6 SEM images of MS after 24 h immersion in 3% NaCl without and with Ti-0, Ti-5 and Ti-7 (0.4 g/L).
It can be clearly observed that, without inhibitors, MS surface is highly corroded, due to the NaCl attack. However, with inhibitors, MS surface morphologies remarkably improved 55-60, which suggests that they were adsorbed at the metal-electrolyte interfaces, forming protective films.
Conclusion
Electrochemical studies showed that the tested Ti glasses compounds are good inhibitors of MS corrosion in 3% NaCl. The inhibitors acted simultaneously on the anodic and cathodic electrochemical processes. Polarization curves show that the inhibiting effect of this compound resulted in a clear decrease in the cathodic and anodic icorr values, especially in the vicinity of Ecorr. A remarkable corrosion inhibition effect of Ti glasses was observed when their C was 0.4 g/L. Their IE(%) depended on the vitreous phase composition, reaching its higher value (98%) at 0.4 g/L and 7% TiO2. The impedance tests confirmed these results and revealed that the inhibitor addition effect was seen as an increase in Rct, and as a strong decrease in electrochemical interface capacity value. The studies of the examined compounds adsorption onto the MS surface were reinforced by SEM, EDS and AFM. All these analyses led the authors of the present study to propose the formation of a strong inhibiting film that passivated MS, with very low icorr values.
Authors’ contributions
A. Shaim: wrote the paper. M. Galai: collected the data. A. K. Ba: conceived and designed the analysis. K. Dahmani: conceived and designed the analysis. A. Chahine: collected the data. D. Rair: performed the analysis. M. Ebn Touhami: collected the data. A. Benlhachemi: inserted data or analysis tools.
Abbreviations
AC: alternating current
AFM: atomic force microscopy
AVV: antisymmetric valence vibrations
C: concentration
Cdl: double layer capacitance
CE: counter electrode
CPE: constant phase element
CR: corrosion rate
E: potential
Ecorr: corrosion potential
EIS: electrochemical impedance spectroscopy
FTIR: Fourier transform infrared
I: current density
ia: anodic current
ic: cathodic current
icorr: corrosion current density
IE(%): inhibition efficiency
MS: mild steel
n: CPE exponent
nct: heterogeneity coefficient of charge-transfer electrons
nf: heterogeneity coefficient of the inhibitors film
Na5P3O10: sodium tripolyphosphates
NaCl: sodium chloride
NaPO3: sodium hexametaphosphate
NLS: nonlinear least square
OCP: open circuit potential
P2O5: phosphorus pentoxide
PDP: potentiodynamic polarization
Qct: double layer capacitance of MS
Qf: double layer capacitance of the inhibitors film
Ra: average roughness
Rct: charge transfer resistance
RE: reference electrode
Rf: resistance associated with the layer of products formed
rms: root-mean-square
Rp: polarization resistance
Rs: solution resistance
SC: saturated calomel
SD: standard deviation.
SEM: scanning electron microscopy
SR: scan rate
SS: stainless-steel
SVV: symmetric valence vibrations
T: temperature
WE: working electrode
XRD: X-ray diffraction


