Introduction
Corrosion results from the environment chemical or electrochemical action on metals and alloys. Corrosion inhibitors are substances that are added to aggressive environments, such as acid pickling, chemical cleaning and oil wells acidification processes, since they can significantly reduce the attack rate of metals and alloys, by decreasing corrosion processes 1-4. In spite of this, large amounts of steel are destroyed in acidic media, especially HCl, due to corrosion 5,6. Acidic solutions are more widely used in industrial fields (fertilizers manufacture, pickling and metal scaling) 7-9. In a large number of articles, reviews and books, the use of heterocyclic compounds as corrosion inhibitors of metals in acidic media has been investigated 10-12. Among the most emblematic works, there is the review published by Schmitt, in 1984, “Application of inhibitors for acid media” 13. Thus, we will briefly describe recent works that deal, in particular, with the field of Fe and steel acidic corrosion protection by heterocyclic compounds containing several heteroatoms 14-17. Steel corrosion in 1 M HCl has been studied by Elayyachy et al. 18. Galai et al. have shown that the increase in N atoms electron density enhances IE(%) 1, while heterocyclic compounds containing N heteroatoms, such as pyridine, quinoline and various amines, have obtained good IE(%) in acidic media 19,20. H atom substitution by pyridine increases considerably its inhibitory action 21. The authors evaluated the studied polymer IE(%), by using WL and electrochemical techniques, namely, PDP and EIS 22-24. Due to quinoxalines (e.g. indeno-1-one 2,3 quinoxaline, acenaphtho 1,2 quinoxaline, ethyl 2- (4-(2-ethoxy-2-oxoethyl)-2-p-tolylquinoxalin-1 (4H)-yl) acetate and 1- (4-acetyl-2- (4-chlorophenyl) quinoxalin-1(4H)-yl)acetone) excellent mechanical, thermal, viscosimetric and rheological properties25-28, they have shown to be good inhibitors against acidic corrosion 20,29-31. Theoretical studies have been widely used to explain corrosion inhibition mechanism, interpret the experimental results, and also find a correlation between the organic compounds molecular structure and their IE(%). Global quantum chemical descriptors of the studied inhibitor molecules, such as HOMO, LUMO and μ, have been researched 32-40.
In the present work, Q1 and Q2 have been investigated as potential corrosion inhibitors for OS in a 1 M HCl medium, using electrochemical studies and theoretical calculations. Further, activation kinetic parameters, such as Ea, ΔH°, ΔS° and ΔG°, have been calculated and thoroughly discussed. The geometry optimization of the studied molecules and the parameters calculation were carried out using DFT method level, at 6-31G(d,p) basis set.
Materials and methods
OS used
OS chemical composition (% by wt.) is shown in Table 1.
The OS surface was a rectangle of 1 cm2, which was prepared, before immersion, by polishing it with an abrasive paper up to a grain size of 2000. It was rinsed with distilled water and acetone, and dried with hot air. The corrosive medium was a 1 M HCl solution, prepared from the commercial solution (37%), using bi-distilled water. The C range used for the two tested inhibitors was from 10-6 to 10-3 M, which was determined after studying their solubility in the corrosive medium.
Used inhibitors
Quinoxalinone derivatives compounds were synthesized, as characterized by Lalami et al. 41, and their structures are listed in Table 2.
Electrochemical measurements
The electrochemical experiments were carried out in a conditioned cell equipped with a conventional three-electrode arrangement: OS as WE, Pt as AE and Ag/AgCl as RE. Electrochemical methods for the study of corrosion can be classified into two main groups: the so-called stationary (classical) and non-stationary (transient) methods. In the first one, the intensity-E curves are obtained in a PDP mode, where the E applied to the sample varies continuously, with a SR of 1 mV/S-1. The measurements were made by a PGZ100 Potentiostat-Galvanostat, associated with Voltamaster 4 software. Before the curves were drawn, the WE was maintained at its E, for 30 min. EIS measurements were made under the same conditions as those of the PDP plotting, at the frequency interval from 100 to 10 KHz.
DFT calculations
Optimization of the quinoxalinones compounds geometric structure was performed by the DFT method, with the non-local Lee-Yang-Parr correlation function (B3LYP), at 6-31G (d,p) basis set, using 09W Gaussian software 42. The various GQCD parameters, such as χ, Pi and ΔE, are expressed by the following relations 43-46:
η and σ are given by the following equations 47:
ω was introduced by Parr 48,49, and it is given by:
This index measures the propensity of chemical species to accept electrons. A more reactive nucleophilic is characterized by μ and ω lower values; conversely, a good electrophile is characterized by μ and ω greater values. ΔN was calculated as follows 50:
where χFe and χinh represent Fe absolute ( and the inhibitor molecule, respectively; ηFe and ηinh denote Fe absolute η and the inhibitor molecule, respectively; and χFe = 7.0 eV and ηFe = 0 theoretical values were used to calculate ΔN 49.
Results and discussion
EIS analysis
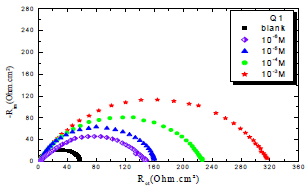
In order to understand OS corrosion mechanisms, after 30 min of immersion in 1 M HCl, at 303 K, EIS diagrams obtained at Ecorr, without and with Q1 and Q2, in different C, are shown in Figs. 1 and 2.
From the analysis of Figs. 1 and 2, we note that there is a large increase in the loop, in Q1 and Q2 presence and, consequently, an increase in Rct, which is inversely proportional to CR. Corrosion IE(%) and OS Cdl were calculated by the following equations 51-54:
 and
and are values without and with the inhibitor, respectively. Cdl values are also expressed by the Helmholtz relation 55.
where ( is the double layer capacity thickness, S is the OS electrode surface, and ε° and ε are vacuum and solution dielectric constants, respectively.
The electrochemical parameters associated with the impedance diagrams are recorded in Table 3.
Table 3 EIS parameters of OS in 1 M HCl without and with studied inhibitors, and their corrosion efficiencies IE(%) .

Table 3 indicates that Pr increased with higher C of the studied inhibitors. Further, Q1 and Q2 IE(%), at inhibitors optimal C of 10-3 M, reached the maximum values of 86.2 and 92.5%, respectively. Cdl was inversely proportional to Rct. Cdl values calculated in the 1 M HCl medium without inhibitors were lower than of those with Q1 and Q2. This decreases can be attributed to the organic molecules adsorption onto the metallic surface 56,57. From these observations, it can be said that Q2 adsorption performance onto the metallic surface was higher than that of Q1.
The equivalent electrical circuit used to output the electrochemical parameters is shown in Fig. 3.
PDP investigation
Figs. 4 and 5 show the cathodic and anodic polarization curves of OS in 1 M HCl without Q1 and Q2 and with them in different C, at 298 K. The electrochemical parameters taken from these curves are grouped in Table 3. Figs. 4 and 5 show that the increases in C of the tested inhibitors led to a shift in Icorr, in the two anodic and cathodic domains, to lower values.
The cathodic slope is in the form of Tafel line, for the entire range of examined E, indicating that H reduction on the OS surface took place through a pure activation mechanism 58-60.
IE(%) was calculated by the following equation:
The electrochemical parameters determined from the polarization curves, such as Ecorr, βc, icorr and IE(%), are grouped in Table 4.
Table 4 IE(%) and electrochemical parameters obtained from the curves of OS in 1 M HCl without and with inhibitors at different concentrations.
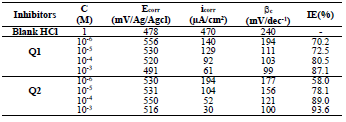
From the analysis of Table 3, we observed that, for all Q1 and Q2 C, icorr decreased with higher inhibitor C and, consequently, IE% increased, reaching a maximum value of 87.1 and 93.6%, respectively. In general, this behavior is due to the active sites blocking by the formation of a protective layer on the OS surface.
The different C of the studied inhibitors slightly modified βc values, with respect to the blank HCl.
Thus, these compounds are mixed inhibitors, predominantly cathodic, because there was a displacement in the Ecorr values, in both cathodic and anodic domains, with Q1 and Q2 different C in 1 M HCl. This maximum displacement was 78 mV/Ag/AgCl for Q1. βc and βa were extensively changed by Q1 and Q2. This modification indicates that the organic compounds derivatives, which were elaborated as potential inhibitors, were adsorbed onto the OS surface, by blocking the active centers through the chemical bonds.
Cathodic and anodic reactions for OS substrates were inhibited by Q1 and Q2. PDP results confirmed the data obtained by EIS measurements.
T effect
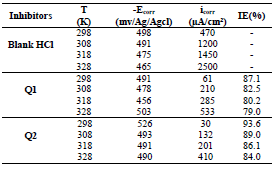
T effect on Q1 and Q2 IE(%) for OS corrosion in a 1 M HCl solution without and with them, in a C of 10-3 M, at a range from 298 to 318 K, was obtained by PDP measurements. Table 5 lists all the electrochemical parameters, as a function of the different T.
IE(%) underwent a decrease, while CR increased with higher T, in the absence of Q1 and Q2 and in their presence (10-3 M) .
Activation kinetic parameters, such as Ea, ΔH° and ΔS°, were calculated. Ea (kJ/mol-1) relative to the corrosion process was calculated from Arrhenius equation:
where R is the perfect gas constant and T is absolute.
Fig. 6 shows the icorr logarithm variations, as a function of T inverse.
where ln is the natural logarithm, f is the frequency and t is the time period.
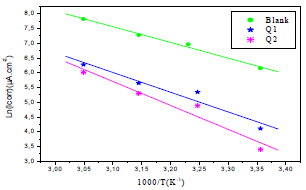
Figure 6 Arrhenius lines calculated from PDP for OS in 1 M HCl without and with Q1 and Q2 inhibitors.
The icorr logarithm variations enabled to calculate Ea values from the slope of each one of the obtained straight lines. Ea values are listed in Table 6, which shows that this parameter, in HCl without Q1 and Q2 is higher than of that with them. This result is interpreted as an indication of an electrostatic character of the inhibitors adsorption. It can be said that the studied inhibitors were adsorbed onto the steel surface by forming physical bonds (physisorption) 6.
Another formulation of the Arrhenius equation is 61:
where h is the Plank constant and N is the Avogadro number.
Ln(icorr/T) variation, as function of T inverse, is a straight line (Fig. 7), with a slope of 1000/R and an ordinate at the origin equal to (LnR/Nh + 1000/ R). Fig. 7 shows that the lines are almost straight, and that all R2 values are close to 1. From the slopes and lines intersections, Ea,  and
and  values were computed and grouped in Table 6.
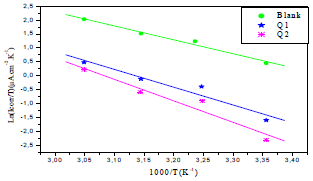
Figure 7 Ln (icorr/T) as function of 1000/T for OS in 1 M HCl without and with Q1 and Q2 inhibitors.
The endothermic reactions positive values were expressed on the OS dissolution process. Indeed, the increase in  with Q1 and Q2 was 52.9 and 63.9 kJ/mol-1, respectively, whereas in their absence it was 41.4 kJ./mol-1, which corresponds to a decrease in the metal dissolution. The high and negative entropy values mean that there was an increase in disorder when the reactants were transformed into an activated Fe-molecule complex in the solution (1, 8, 35).
Adsorption isotherm
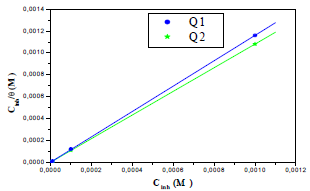
The adsorption isotherm can give additional data on the compounds adsorption performance on the metal surface. θ values for different inhibitor C in a 1 M HCl solution were obtained according to the IE% ratio. There are several adsorption models, such as Langmuir’s, Temkin’s and Frumkin’s isotherms, based on Cinh/θ. As a function of Cinh, we found that there were excellent experimental values for Q1 and Q2. For Langmuir’s isotherm, its R2 coefficient was close to 1, relative to those found in Temkin’s and Frumkin’s isotherms, as shown in Fig. 8 (45, 46, 62). Therefore, experimental results obeyed the Langmuir’s adsorption isotherm, where θ and Cinh are linked to each other via the equation:
The rearrangement gives:
Kads can be calculated from the straight lines intersections.
Fig. 8 shows Cinh/θ variation, as a function of the inhibitor C, where the shown lines are close to one.
 is related to Kads by relationship (16), and the corresponding results are listed in Table 7 (63).
From Table 7, we find that Kads values are high, indicating that Q1 and Q2 were readily adsorbed onto the OS surface (64). In general, if  values are close to or greater than -20 kJ/mol, they are linked to electrostatic interactions; those which are close to -40 kJ/mol or lower involve the formation of chemical nature bonds between the inhibitor molecules and the metal surface. For
  values in the range from -20 to -40 kJ/mol, the two phenomena apply at the same time 65. However, these criteria remain insufficient in order to distinguish between the two phenomena (chemisorption and physisorption). The results in Table 8 indicate that the two inhibitors obeyed the order Q2> Q1. That is, Q2 adsorption performance onto the OS surface was higher than that of Q1, due to the existence of an electro-donor group on the N atom number four (N4) in the first compound.
Table 7 Thermodynamic parameters of Q1 and Q2 with different concentrations on the OS surface in 1 M HCl, at 298 K.

DFT calculations
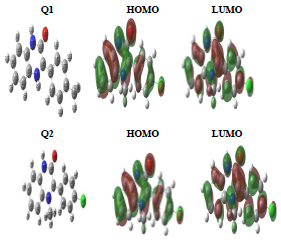
Quantum chemistry calculation was carried out by the DFT 6-31G (d, p) method, and compared with experimental results. During this study, we calculated chemical quantum parameters. Also, HOMO and LUMO optimized geometric structures and electron density distributions for these inhibitors are presented in Fig. 9. It is seen that HOMO and LUMO were distributed over Q1 and Q2 entire surfaces. This indicates that these molecules are rich in electrons.
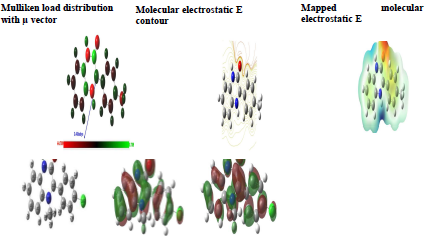
Mulliken atomic charges on the Q1 and Q2 atoms, the μ vector direction, and the contour and surface representation of the electrostatic E are presented in Figs. 10 and 11.
From these figures, it is evident that the N, O and some C atoms for the two inhibitors carry negative charges. So, they are responsible for a nucleophilic attack towards the OS surface. The electrostatic E different values were given using red, yellow, green and blue. Red (electrophilic active regions) and blue (nucleophilic regions) represent MESP negative and positive parts and green depicts the zero region electrostatic E 66,67. Depending on the studied inhibitors ESP and MESP contour surfaces, the negative parts are electrophilic active regions mainly found on the O surface.
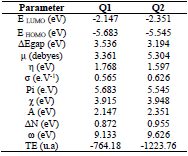
EHOMO indicates the molecule ability to give electrons to another empty molecular orbit; ELUMO describes the ability of a compound to accept electrons. ΔE is the energy difference between EHOMO and ELUMO. The energy absorption between the inhibitors and the metal surface increases when ΔE decreases, i.e., the energy to remove an electron from the last occupied orbit will be low 68-70. The corresponding results of the quantum parameters are presented in Table 8, from which we note that the ΔE values for Q1 and Q2 are 3.536 and 3.194<eV, respectively. Q2 had a weaker ΔE than that of Q1. This indicates that Q2 adsorption performance was greater than that of Q1, in the order: ΔE (Q1)>ΔE (Q2)
Consequently, η and σ are important properties for measuring molecular stability and reactivity. Q1 and Q2 IE(%) increased with higher chemical reactivity 71-75. Q2 had good chemical reactivity with the metal surface, due to the increase in the σ value (0.626 eV-1) and the decrease in η (1.597 eV), according to the following order: η (Q2)> η (Q1).
Q2 maximum µ value was 5.304 Debye, which shows that this is highly polarizable. So, Q2 is very reactive, which could be related to the µ-µ interaction between the inhibitor molecules and the metal surface 12,76,77.
Q2 had a minimum Pi of 5.545 eV, indicating that it is more effective. On the other hand, the IE(%) was higher with an increase in the inhibitor electron donor capacity to the metal surface. The transferred electrons displacement from the inhibitor to the metal surface occurred in the following order: ΔN = 0.955 (Q2) > ΔN = 0.872 (Q1).
Table 8 shows that Q2 had higher ω than that of Q1 (9.626 eV). It was found that this inhibitor acts as an electrophile (electron acceptor). Finally, Q2 total energy was equal to -1223.76 a.u, which indicates that it was favorably adsorbed through the active adsorption centers.
The theoretical study showed that quantum parameters were in agreement with experimental observations.
Conclusion
Two quinoxalinone derivatives were used to inhibit OS corrosion in a 1 M HCl medium. The study was carried out using various experimental and theoretical approaches. The results of this study are as follows:
Q1 and Q2 inhibitors were effective inhibitors for OS corrosion.
Those molecules were mixed inhibitors, of predominantly the cathodic type.
EIS results displayed that the Nyquist diagrams had a single capacitive loop, indicating that the corrosion inhibition was controlled by Rct process.
T effect suggested that IE(%) decreased with higher T.
The studied inhibitors adsorption onto the OS surface in a 1 M HCl solution obeyed Langmuir’s adsorption isotherm.
Theoretical approaches and experiments data were in good agreement.
Authors’ contributions
A. Benallal: collected the data. M. Galai: performed the analysis. F. Benhiba: performed the analysis; wrote the paper. N. M’hanni: wrote the paper. Rachid Hsissou: wrote the paper. S. Ibn Ahmed: conceived and designed the analysis. M. Ebn Touhami: conceived and designed the analysis. H. Oudda: other contributions. S. Boukhris: contributed with data or analysis tools. A. Souizi: conceived and designed the analysis.
Abbreviations
AE: auxiliary electrode
C: concentration
Cdl: double layer capacity
CR: corrosion rate
DFT: density functional theory
Ea: activation energy
E: potential
Ecorr: corrosion potential
EIS: electrochemical impedance spectroscopy
EHOMO: energy of the highest occupied molecular orbital
ELUMO: energy of the lowest unoccupied molecular orbital
GQCDs: global quantum chemical descriptors
HOMO: highest occupied molecular orbital
Icorr: corrosion current density
IE(%): corrosion inhibition efficiency
Kads: equilibrium constant of adsorption
LUMO: lowest unoccupied molecular orbital
MESP: molecular electrostatic potential
OS: ordinary steel
Pi: ionization potential
PDP: potentiodynamic polarization
Pr: polarization resistance
R2: regression coefficient
Rct: charge transfer resistance
RE: reference electrode
SR: scan rate
T: temperature
WE: working electrode
WL: weight loss
Symbols definition
βc: Tafel slope
ΔEgap: gap energy
ΔG°: activation free enthalpy
ΔG° ads: adsorption free energy
ΔH°: activation standard enthalpy
ΔS°: activation standard entropy
η: chemical hardness
μ: dipole moment
σ: chemical softness
θ: surface coverage rate values
ω: overall electrophile index
χ: electronegativity


