Introduction
Metals are amongst the most widely used materials, particularly in mechanical engineering, transport industry, electronics and construction. However, metals and alloys usefulness is limited by the common problem of corrosion 1,2. Corrosion is defined as the deterioration of a metal, due to chemical attack or environmental reaction 3. Cu is among the materials that are commonly used in heating and cooling systems, due to its excellent thermal conductivity and good mechanical workability 4,5. However, scale and corrosion products have a negative effect on heat transfer, and lead to a decrease in the equipment heating efficiency, which requires periodic descaling and cleaning with H2SO4 or HCl pickling solutions 6. Recently, several studies have examined the possibility of using organic inhibitors mechanisms against metallic corrosion in different acidic media 7,8,9. Considerable efforts have been made to find suitable compounds that inhibit metal corrosion in various aggressive environments 10. Therefore, metals and alloys protection is of particular interest, and one approach is the use of corrosion inhibitors 11.
Many compounds that are green inhibitors have been investigated for their corrosion prevention potential 12. All these studies state that organic compounds containing N, S and O in their structures have shown significant IE(%) 13. These inhibitors retard metals corrosion by being adsorbed onto a metal surface. The adsorption process is influenced by factors such as the inhibitor molecular size and Ct, the substituents nature, T and nature of the test solution 14,15. Organic compounds and extracts from plants have been examined for their inhibitory properties, including caffeic acid 16, pennyroyal oil 17, caffeine 18, thyme 19, jojoba oil 20, rosemary oil 21,22 and eugenol 23. Polymers, polymeric polyepoxides and epoxy resin 24-28, e.g., TGETBAE and HGTMDAE, are also used as metals corrosion inhibitors 29,30. EO are studied for their corrosion IE(%) that is linked to terpenoids, hydrocarbons and S compounds naturally present in different Ct 31,32. For the same plants, the EO nature and constituents amount differ according to their origin (climate, soil, altitude), which has a huge impact on their effectiveness. Within this framework, the present study aimed to determine the chromatographic analysis of MP EO, from the region of Zaër (Western Morocco), and to study its IE(%) for Cu corrosion in a 0.5 M H2SO4 medium, by varying two essential parameters: Ct and T.
Zaër region
Zaër region is of trapezoidal shape, located in the heart of Morocco, between the Atlas Mountains and the Atlantic Ocean, at 33° and 34° North latitude and 6° and 7° West longitude, and covers an area of approximately 3.860 Km2. 33. It is bordered to the north by the Rabat region, to the east by the Zemmour region, to the south-west by the Chaaouia region and to the south by the Beni Khiran domain. Cherrat, Bou Regreg and Grou rivers set their limits on nearly half of its length. The climate of this region is Mediterranean: mild and humid in winter, and hot and dry in summer; rainfall in the region far exceeds the national average 34.
Materials and methods
Plant material
The genus Mentha comprises 25 to 30 species that grow in temperate regions of Eurasia, Australia and South Africa, in the wetlands of plains and mountains up to 2200 meters above sea level 35. MP, locally called Fliou, is also known as pouliot, royal pouliot, flea or chip hunt, and it belongs to the Lamiaceae family.
MP extraction
MP was collected from the region of Zaër, Morocco, in April. The extraction of its EO was carried out using a Clevenger apparatus: 230 g MP fresh leaves were introduced into a 2 L flask with distilled water (about 2/3 of the flask), and the mixture was boiled for 4 h. The EO extract (volatile part) was kept in the dark, at 4 ºC, for later use.
MP EO analyses by GC and MS
The MP EO volatile part analyses were carried out by GC and MS, at the Centre for Analysis, Expertise, Technology, Transfer and Incubator of the Ibn Tofail University, Kenitra. The analyses conditions were: ionization energy - 70 eV; T - 300 ºC; carrier gas - He; He flow rate - 1.70 mL; injection flow rate - 1 µl; injection volume - 1 mL; injection mode - Std Split/splitless; and total time - 40 min. GC was of the type 456 coupled to a MS type EVOQTQ. The column was Rxi - 5 sil MS (30 x 0.25mm ID X 0.25 µmdf) capillary type, the detector was FID and the software was MS DATA review, with a computerized database (NIST 2014).
WE preparation
The used Cu plate chemical composition (in %) was: 0.019 P, < 0.001 Fe, < 0.001 As, < 0.001 Mn, < 0.002 Sb, < 0.001 Al, 0.009 Sn, 0.003 Ni, 0.015 Pb, < 0.005 Ag, < 0.001 Bi, < 0.001 S, < 0.005 C and Cu (balance). The WE underwent a pre-treatment before each test, which consisted of polishing the electrode surface with different abrasive papers (800, 400, 1200 and 1500 grades), rinsing with distilled water, degreasing in acetone and drying.
Corrosive solution preparation
The corrosive solution was a 0.5 M H2SO4 aqueous solution, and its pH and T were maintained at 2 and 25 °C, respectively. Solutions of 0.5 M H2SO4 with MP EO were freshly prepared before each experiment.
Electrochemical measurements
Electrochemical measurements were performed using a PGZ100 potentiostat/galvanostat controlled by Volta Master 4 analysis software, in a H2SO4 0.5 M aqueous solution. The corrosion cell used was equipped with three electrodes: SC electrode (Hg/HgCl2 in saturated KCl) and Pt wire were used as RE (DHW type) and CE, respectively. All E values given in this work refer to this RE by using a Cu plate as WE (with an exposed surface area of 1 cm2). The experiments were carried out after 30 min immersion of Cu in a 0.5 M H2SO4 solution, without and with MP, at different Ct. The PDP curves were obtained by sweeping the WE E from -1200 to 600 mV, at a SR of 1 mV/s. All electrochemical experiments were performed at a T of 298 K. The Ct range used for MP was from 0.5 to 2 g/L. To evaluate the kinetic corrosion parameters, Stern-Geary equation was used. For this purpose, overall i values were taken as the sum of two contributions, ia and ic, respectively. For the E range not too far from OCP, both processes followed Tafel’s law 36. Thus, it can be derived from equation (1) that:
where icorr is in A cm-2, and (a and (c are in V/dec, at the usual logarithmic scale given by equation (2):
The corrosion parameters were then evaluated by the NLLS method, applying equation (1), using the Origin software.
The corrosion IE(%) was evaluated from icorr values using equation (3):
where i0 corr is icorr value without MP. EIS diagrams were produced under the Nyquist plot. The results were then analyzed in terms of equivalent electrical circuit, using Bouckamp’s program 37. IE(%) was also calculated using the following equation (4):
where R0 ct is Rct value without MP.
Surface morphology analysis
To confirm the formation of a layer on the Cu surface immersed in a 0.5 M H2SO4 solution, for 16 h, with and without MP EO, SEM analysis coupled with EDX microanalysis were carried out at CNRST, Rabat, Morocco.
Results and discussion
EO yield
The extraction with Clevenger aparatus allowed to obtain two fractions: the EO, which is the volatile fraction, and the hydrolate, with a yield of 1.43% from 230 g MP fresh leaves. This content was approximately equal to that obtained by Derwich et al. (1.66%) 38.
Product analysis by GC/MS coupling
Through GC/MS analysis, it was possible to identify a total of 31 compounds for MP (listed in Table 1).
Table 1: MP EO composition.
| N | Retention time (min) | Percentage (%) | Compound name |
|---|---|---|---|
| 1 | 8.060 | 0.61 | E-3-Hexenol |
| 2 | 12.992 | 0.29 | 3-Methylcyclohexanone |
| 3 | 13.787 | 0.11 | (-)-(-Pinene |
| 4 | 14.193 | 0.14 | 3-Octenol |
| 5 | 14.582 | 0.44 | Octan-3-ol |
| 6 | 15.332 | 3.98 | (+)-Limonene |
| 7 | 15.364 | 0.45 | Eucalyptol |
| 8 | 18.114 | 20.54 | Isomenthone |
| 9 | 18.178 | 9.56 | l-Menthone |
| 10 | 18.565 | 5.51 | Isopulegone |
| 11 | 18.826 | 2.24 | Menthol |
| 12 | 18.983 | 1.9 | 3-hydroxy-4,4-dimethyldihydrofuran-2-one |
| 13 | 19.035 | 0.66 | (E)-2, 2, 5,5-tetramethyl-3-hexene |
| 14 | 19.378 | 23.38 | Pulegone |
| 15 | 19.431 | 2.12 | 1-Dodecyne |
| 16 | 19.466 | 3.08 | (4Z)-2-isopropylhexa-1,4-diene |
| 17 | 19.545 | 3.85 | Cyclohexanone, 2-isopropylideno-5-methyl |
| 18 | 19.619 | 1.37 | (1R)-1-methoxymyodesertan |
| 19 | 19.676 | 3.75 | (Z)-6-methyl-5-methylene-2-heptene |
| 20 | 19.704 | 2.59 | Spiro(2.5)octane |
| 21 | 19.766 | 3.01 | 2-Cyclohexyloxirane |
| 22 | 20.146 | 0.14 | Carbonic acid, (1R)-(-)-menthyldecyl ester |
| 23 | 20.163 | 0.15 | (S)-(+)-cis-Isopiperitenone |
| 24 | 20.280 | 0.88 | (7-Hydroxy-3,3-dimethyl-4-oxo-7-vinylbicyclo(3.2.0) hept-1-yl)acetaldehyde |
| 25 | 20.325 | 0.80 | Dihydroedulan |
| 26 | 20.449 | 1.32 | (-)-Neomenthylacetate |
| 27 | 20.474 | 1.02 | 2-Isopropyl-3-methylcyclohexyl acetate |
| 28 | 20.501 | 1.59 | l-Menthol acetate |
| 29 | 20.919 | 3.16 | Piperitenone |
| 30 | 22.334 | 1.19 | Humulene |
| 31 | 24.506 | 0.17 | (-Acoradienol |
MP EO extracted using Clevenger apparatus has pulegone as its main constituent, with a content of 23.38%, and also: (-)-beta-pinene (0.11%), 3-octenol (0.14%), octan-3-ol (0.44%), (+)-limonene (3.98%), eucalyptol (0.45%), isomenthone (20. 54%), l-menthone (9.56%), isopulegone (5.51%), menthol (2.24%), piperitenone (3.16%), l-menthol acetate (1.59%) and humulene (1.19%).
These compounds are considered to be good corrosion inhibitors, due to the presence of pulegone, as found in other work 39. These results are compatible with most of the work already carried out in Morocco, which confirms that Moroccan MP EO is rich in pulegone 40. The same is true for MP collected throughout the world, which shows that it belongs to the pulegonechemo type 41. Several works have studied MP EO inhibition mechanism 42 but, to our knowledge, not against Cu corrosion in H2SO4.
PDP
Ct effect
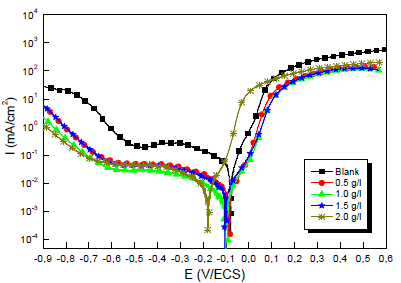
Fig.1 shows a set of polarization curves for the Cu electrode immersed in a 0.5 M H2SO4 solution without and with MP EO, at different Ct. Each polarization curve is formed of two half curves, one representing anodic (Cu dissolution) and another cathodic domains (O reduction). The involved redox reactions are:
Various studies have confirmed that, although MP EO has shown high IE(%) against metals corrosion, it is dependent on the extract Ct 43,44. For this study, by comparing the polarization curves, without and with MP EO, higher inhibitor Ct shifted E value in the negative direction, and caused a slight decrease in ia and ic densities. However, MP EO corrosion IE(%)was significant at a Ct of 1.0 g/ L, reaching the maximum value of 91.0%. Table 2 shows some examples in the literature of MP as a green corrosion inhibitor:
Kinetic parameters such as Ecorr, icorr, βc, βa and IE(%) are listed in Table 3.
In the literature, it has been reported that, if the displacement in Ecorr is > 85 mV, the inhibitor can be considered cathodic or anodic, and if it is < 85 mV, it can be considered of the mixed type 50.
In our study, according to Table 3, we note that MP EO addition reduced icorr from 29 to 2.4 µA/cm-2. Thus, Cu resisted corrosion in the inhibitor presence. This may be due to MP EO adsorption onto the metal/acid interface. Nevertheless, the decrease in MP EO icorr, compared to the blank 0.5 M H2SO4, for the anodic and cathodic sites, may indicate a mixed type of corrosion inhibition. Moreover, the displacement of Ecorr< 85 mV confirms the behavior of a mixed type inhibitor.
Table 3: Electrochemical parameters of the stationary polarization curve of Cu in a H2SO4 0.5 M medium.
| Inhibitor | Ct g/L | Ecorr (mV/ECS) | icorr (µA/cm-2) | Tafel slopes (mV/dec-1) | IE(%) | ||
|---|---|---|---|---|---|---|---|
| -βc | βa | ||||||
| Blank | -- | -79 | 29.0 | 204 | 59 | - | |
| MP | 0.5 | -80 | 5.0 | 189 | 56 | 82.7 | |
| 1.0 | -86 | 2.6 | 183 | 52 | 91.0 | ||
| 1.5 | -89 | 3.7 | 185 | 53 | 87.2 | ||
| 2.0 | -169 | 4.3 | 187 | 54 | 85. 2 | ||
EIS
In order to better understand the phenomenon occurred on the metal/solution interface, we have drawn the impedance diagram shown in Fig. 2.
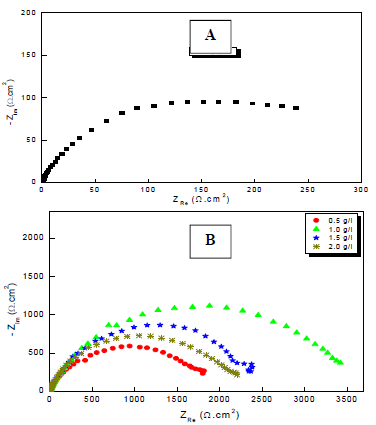
Figure 2: Nyquist plots for Cu in a 0.5 M H2SO4 solution: (A) without; and (B) with MP EO various Ct, at 298 K.
Through comparison of the uninhibited 0.5 M H2SO4 solution with the inhibited one, we notice that the display of the Cu impedance in the medium with MP EO changed considerably in shape and size (Fig. 2). The impedance data are simulated using the equivalent circuit illustrated in Fig. 4, for the electrode immersion in an H2SO4 solution containing MP EO, during only 60 min. The inhibitor caused changes in impedance behavior. The increase in Rct values was due to the development of a protective film at the metal-solution interface 51. Rp diameter obviously increased, from 350/Ωcm2, without MP EO, to over 3636 Ω/cm2, with it (Table 4).
Table 4: Electrochemical parameters of the Cu electrochemical impedance curve.
| Inhibitor | Ct g/L | Rs Ω/cm² | Qf µF/cm² | nf | Rf Ω/cm² | Qct µF/cm2 | nct | Rct Ω/cm² | Rp Ω/cm2 | IE% |
|---|---|---|---|---|---|---|---|---|---|---|
| Blank | -- | 0.7±0.2 | - | - | - | 475±9.1 | 0.72±0.007 | 350±5.1 | 350 | - |
| Inhibitor | 0.5 | 2.3±0.9 | 35.9±4.8 | 0.903±0.007 | 94±7.1 | 150±4.4 | 0.569±0.008 | 1892±7.1 | 1986.0 | 82.4 |
| 1.0 | 2.3±1.0 | 5.7±1.8 | 0.997±0.007 | 12.8±1.6 | 81.6±2.1 | 0.673±0.008 | 3624±14.2 | 3636.8 | 90.4 | |
| 1.5 | 1.8±1.0 | 9.9±1.7 | 0.998±0.007 | 18.7±1.4 | 96.4±3.8 | 0.673±0.008 | 2526±73.8 | 2544.7 | 86.2 | |
| 2.0 | 1.8±1.0 | 17.4±1.9 | 0.952±0.007 | 38.2±5.4 | 106.2±5.6 | 0.669±0.008 | 2264±12.5 | 2302.2 | 84.8 |
From the shape of the capacitive loops, we see that the corrosion process was controlled by a diffusion mechanism. This was confirmed by 52,53. The diameter of these capacitive loops increased progressively with higher MP EO Ct, which indicates a strengthening of the inhibitory film. The electrochemical parameters of these diagrams are shown in Table 4.
In Fig. 3, the condenser was replaced by a CPE, which indicated the presence of a dissimilar frequency response. CPE impedance is defined as follows 54:
where Q is a constant in Ω/cm2 in sn, ω is the angular frequency in rad/s and n is CPE exponent, with -1< n< 1.
CPE can represent an inductance, a Warburg impedance, a pure capacitance, or a resistance, with n = - 1, 0.5, 0 and 1, respectively. The smaller the n value, the higher the surface roughness 55.

Figure 3: Equivalent circuits for Cu EIS used to model Cu/solution interface without (a) and (b) with MP EO.
T effect and thermodynamic parameters
The T of the corrosive environment is one of the factors that can modify the behavior of materials in a given corrosive environment, as well as the IE(%) of a compound. In general, as T increases, changes in the inhibitor action occur.
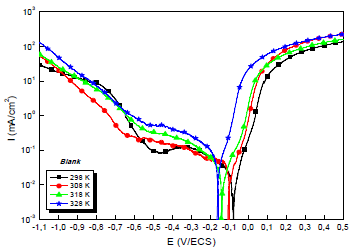
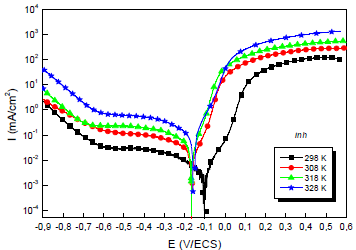
Due to the importance of this factor, trace tests of the polarization curves for the 0.5 M H2SO4/Cu interface with and without MP EO, at different T, were performed. They are shown in Figs. 4 and 5.
The electrochemical parameters from these diagrams are shown in Table 5.
Table 5: Electrochemical parameters from the stationary polarization curves of Cu without and with MP, at different T.
| Compound | T (K) | -Ecorr (mV/ECS) | icorr (µA/cm²) | -βc (mV) | βa (mV) | IE(%) |
|---|---|---|---|---|---|---|
| Blank | 298 | 79 | 29.0 | 204 | 59 | - |
| 308 | 105 | 35.0 | 188 | 64 | - | |
| 318 | 142 | 56.0 | 164 | 77 | - | |
| 328 | 166 | 77.0 | 152 | 52 | - | |
| 1.0 g/L MP | 298 | 86 | 2.6 | 183 | 52 | 91.0 |
| 308 | 164 | 3.8 | 171 | 56 | 89.1 | |
| 318 | 166 | 7.2 | 152 | 66 | 87.2 | |
| 328 | 159 | 11.8 | 143 | 70 | 84.6 |
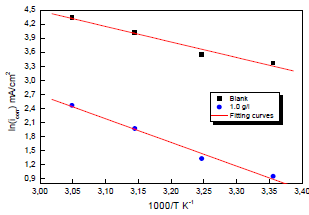
Theoretically, higher T increase PDP curves i value and decrease IE(%) 56. This is illustrated more clearly, in Table 4, by icorr variation with T: i varied from 29.0 to 77.0 μA/cm-2, at 298 and 328 K, respectively. CR dependence on T can be expressed by Arrhenius equation:
where A is the frequency factor and R is universal gas constant (8.314 J/mol-1/K-1). The Arrhenius plot that obtained Ln icorr as a function of 1000/T is shown in Fig. 6, and is compared with that of Cu in a 0.5 M H2SO4 solution without EO. The experimental curve obtained for MP EO corresponded approximately to a straight line, and anodic E value was determined from the slope of this line. In addition, other kinetic parameters, such as ∆Hads and ∆Sads, were obtained from the following transition state equation:
where h is Plank's constant and N is Avogrado’s number.
Ln (icorr/T) variation as a function of 1000/T in 0.5 M H2SO4 gave a straight line, as shown in Fig. 7, with a slope of -ΔHa/R. The intersection with the x-axis is Ln (R/Nh) + (ΔHa/R).
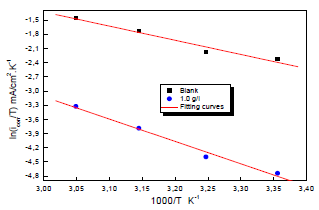
Figure 7: Arrhenius diagrams of Ln (icorr/T) versus 1000/T for Cu in 0.5 M H2SO4 without and with MP EO.
Adjustment of the curve (Fig. 7) with a straight line gave a value of 41.9 kJ/mol-1 for the corrosion process Ea with MP EO. This value is much higher than that for Cu without MP (27.50 kJ mol-1), which explains why the variations in icorr were more pronounced with the inhibitor (Table 6).
Table 6: Values of Ea, ∆Ha and ∆Sa kinetic parameters for Cu in 0.5 M H2SO4 without and with MP EO.
| Compound | Ea (kJ/mol-1) | ΔHa (kJ/mol-1) | ΔSa (J/mol-1/k-1) |
|---|---|---|---|
| Blank | 27.50 | 25.00 | -134.0 |
| 1.0 g/L MP | 41.9 | 39.3 | -105.3 |
The increase in anodic Ecorr, in MP EO presence, associated with a decrease in IE(%), with higher T, is frequently understood as being due to the formation of an adsorption film of a physical nature, i.e. involving electrostatic interactions with the metal surface, according to Popova et al. 57. The results of the present work suggested a predominant physisorption inhibition. However, ΔHa positive signs reflect Cu dissolution process endothermic nature. Indeed, higher ΔHa in MP EO presence corresponds to a decrease in the metal dissolution.
Surface analysis
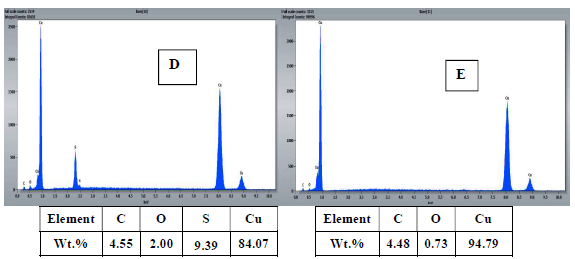
To confirm the results obtained by electrochemical measurements, the surface morphology of Cu samples with and without MP EO, after 16 h of immersion, was studied by SEM (Fig. 8), and the chemical composition was obtained by EDX microanalysis (Fig 9).
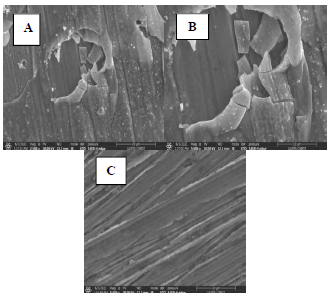
Figure 8: SEM images of the Cu surface immersed in 0.5 M H2SO4 solutions, for 16 h, at 298 K: A and B- without inhibitor; and C with inhibitor.
The results show that: the Cu coupon control sample (Fig. 8 A and B), immersed in 0.5 M H2SO4 without MP EO, was very damaged, since it had a very rough surface, with corrosion products and cracks, due to the attack by the aggressive solution, showing pronounced dissolution; MP EO addition caused a decrease in Cu degree of corrosion, with cracks disappearance and a regular and smoother morphology (Fig. 8 C), which indicates the formation of a protective film on the metal surface; EDX microanalysis (Fig. 9) shows a decrease in O percentage, and the disappearance of S peak after MP EO addition. Since S and O corrode Cu, their decrease explains the metal surface regularity during the treatment with MP EO. This was due to the formation of a film on the Cu surface by the inhibitor molecules, which protected it from the corrosive attack; therefore, SEM images and EDX microanalysis results are consistent with those of PDP and EIS tests.
Conclusion
This work was part of a long and important line of research aimed at valorizing natural plant resources, in particular, the aromatic and medicinal plants of Morocco. In this context, we have chosen to study MP from the Zaër region, based on traditional uses by the Moroccan population. At the end of this study, we can deduce the following conclusions: GC/MS analyses of MP EO allowed to determine its chemical composition, and pulegone was determined as the major compound; MP EO acted as Cu corrosion inhibitor in 0.5 M H2SO4; MP EO IE(%) reached 91.0% at a Ct of 1.0 g/L; MP EO acted as a mixed inhibitor, and its IE(%) increased with higher T.
Conflict of interest
The authors declare that they have no known competing financial interests or personal relationships that could have appeared to influence the work reported in this paper.
Authors’ contributions
S. Rached: wrote the paper. K. Mzioud: collected the data. A. Habsaoui: conceived and designed the analysis. M. Galai: conceived and designed the analysis. K. Dahmani: collected the data. M. Ouakki: performed the analysis. S. EL Fartah: collected the data. N. Dkhireche: wrote the paper. M. Ebn Touhami: inserted data or analysis tools.
Abbreviations
βa: anodic Tafel slope constant
βc: cathodic Tafel slope constant
Ct: concentration
CE: counter electrode
CPE: constant phase element
CR: corrosion rate
E: potential
Ecorr: corrosion potential
EDS: energy dispersive X-ray
EIS: electrochemical impedance spectroscopy
EO: essential oil
GC: gas chromatography
H2C2O4: oxalic acid
H2SO4: sulphuric acid
H3PO4: phosphoric acid
HCl: hydrochloric acid
HGTMDAE: hexaglycidyltrimethylenedianiline of ethylene
i: current density
ia: anodic current
ic: cathodic current
icorr: corrosion current density
IE(%): inhibition efficiency
MP: Mentha pulegium
Na2CO3: sodium carbonate
MS: mass spectrometry
NLLS: non-linear least square
OCP: open-circuit potential
PDP: potentiodyamic polarization
Rct: charge transfer resistance
Redox: reduction-oxidation reactions
RE: reference electrode
Rp: polarization resistance
SC: saturated calomel
SEM: scanning electron microscopy
SR: scan rate
T: temperature
TGETBAE: triglycidyl ether tribisphenol A of ethylene
WE: working electrode


