Introduction
Metals and its alloy are materials of wide application in construction and industry. Generally, acidic solutions are good cleaners, being used for many purposes. However, due to acids corrosive nature, the materials (metals) exposed to them suffer serious degradation that causes high losses and costs. The most challenging challenge faced by researchers and industrialists is metallic corrosion prevention and control. Acidic media destructive effects on the environment are metals dissolution and Ec reactions. Corrosion risks are reduced by several organic inhibitors that have donor sites, with existing heteroatoms such as N, S and O, unsaturated π-bonds and aromatic ring conjugation with planarity, which are considered as effectively adsorption sites, due to their available lone pair of electrons 1-6. Nowadays, CI based on heavy metals have been restricted in numerous countries, due to their hazardous effect upon nature and humans. Dichromates and chromates originated CI are fairly better IE(%). However, due to their toxic nature, they pose a high risk for human health and the eco-system 7. Thus, 8-10 selected organic molecules rather than inorganic ones, since they are nontoxic and environment friendly. Organic compounds IE(%) in acidic solutions depends on their interaction with metal surfaces. Stronger interactions with metals surfaces increase organic CI compounds adsorption properties, enhancing their IE(%). CI are adsorbed onto metal surfaces either chemically, physically or both 11. Schiff base (azo methine) compounds, which contain N and S atoms, were also investigated 12-18. Generally, Schiff bases credit is growing in materials science, since their starting materials are strong, their synthesis route is relatively easy, they have low toxicity, and are very ecofriendly 19-21.
The aim of this study was to produce a CI, through a synthetized Schiff base compound (E)-5-(benzylideneamino)-1,3,4 thiadiazole-2-thiol (green azo methane). BDTT was used as CI on WE (MS) in a 0.5 M H2SO4 solution. Investigations were done with or without BDTT, in various Ct, by Ec techniques (PDP, LPR and EIS) and WL methods. Quantum chemical parameters with optimized molecular structure were calculated via DFT method.
Materials and methods
BDTT synthesis
BDTT was synthesized through the addition reaction method, 22 which consists in having C2H3N3 to react with C₇H₆O. C2H3N3 (6.21 mM) solution was prepared by dissolving it in absolute C₂H₆O (100 mL), in a round bottom flask. C₇H₆O (0.49 mM) was dissolved in dry C₂H₆O, in another 100 mL beaker. Then, C₇H₆O solution was drop wise added to C2H3N3 mixture, in a 250 mL round bottom flask. Further reaction mixtures were constantly refluxed for 10 h, through continuous stirring. The reaction was monitored by TLC, at regular intervals. Finally, the precipitate was obtained by filtration, and thoroughly washed with ether. The resulting compound was a light yellow colored solid, with good yields.
CI studies via gravimetric technique
WE formation
MS cuboidal coupons, with the dimensions of 1 × 1 × 1 cm and 4 × 1 × 1 cm, were used for WL and Ec methods, respectively. MS coupons composition was 98.72 Fe, 1.02 Mn, 0.15 C, 0.08 Si and 0.02 S (%).
Test solution preparation
The employed solvents were distilled water and C₂H₆O. The reactants and solvents (AR grade) were commercially available, and used without any further purification. The electrolytes solutions for testing were prepared by AR grade concentrated H2SO4 dilution with double distilled water. BDTT bulk solutions with various Ct were prepared by dissolving their required amount in H2SO4.
WL studies
WL experiments are a simple process, in which MS was immersed in 0.5 M H2SO4 solutions, for 24 h, with different Ct of BDTT 23. After 24 h, corrosion products on the MS surface were cleaned. Then, the remaining MS sample was weighed 24. CR and IE(%) were calculated through eqs. (1) and (2). All studies were repeated more than twice, to minimize errors. WL values were further used to calculate IE(%) of BDTT against MS corrosion. The terms related to corrosion, i.e., CR and IE(%), were obtained via Eq. (1):
where Wa and Wi are MS coupons WL in 0.5 M H2SO4 solutions without and with BDTT, in various Ct.
SC (θ) by BDTT was evaluated through the following Eqs.:2,3
where ΔW is MS mass change in mg, A is MS coupon area (cm2), t (h) is IT and D is MS density 25.
Ec measurements
The whole Ec experiment was performed with a three electrode Ec cell (250 mL). The employed electrodes were MS, Pt and SCE, as WE, CE and RE, respectively. CE and RE electrodes were fixed to a luggin capillary bent tube, which was filled with Cl- ions solution. The MS surface was prepared by mechanically abrasion with emery paper ranging from 100 to 1000 grade, and washed with acetone. The approximate distance from 1 to 1.5 mm (a constant), between the WE surface and the luggin capillary tip, was maintained to avoid any ohmic loss. All measurements were performed in aerated non-stirred 0.5 M H2SO4 solutions with and without BDTT, in different Ct, at 298 K. A CHI 760c (CH Instruments, Inc., USA) device was used for determining I and E, when redox reaction took place. Tafel polarization was measured through WE (MS) E vs. SCE. I vs. E curves (PDP) measurements were carried out at a SR of 1.0 mV/s-1. LPR parameter was measured while GP study was done. All impedance measurements were performed with steady state OCP, using AC amplitude signals, with a peak to peak of 5 mv, through the steady state E, at a range from 100 kHz to 10 mHz. Nyquist and Bode curves were obtained by using these calculations.
T effect
T effect on CR was calculated through WL studies, at 298, 308, 318 and 328 K. MS corrosion Ea with and without BDTT was calculated via Arrhenius eq.
Theoretical investigations (DFT)
The interaction between the MS surface and BDTT and their reactivity were investigated through FMO and Mulliken charge population. DFT of BDTT molecule was performed via 8.0.6 Hyperchem modeling software 26. To speed up calculations, BDTT was initially optimized via parametrized model 3(PM3). Semi empirical calculations were done with a starting perimeter of 0.01 kcal/mol-1 adjustment, through DFT re-optimization. All observations were completed by selecting 6-311G (d,p) basis set, and exchanging it for B3LYP co-relation function 27-29.
Results and discussion
Ec measurements
PDP and LPR measurements
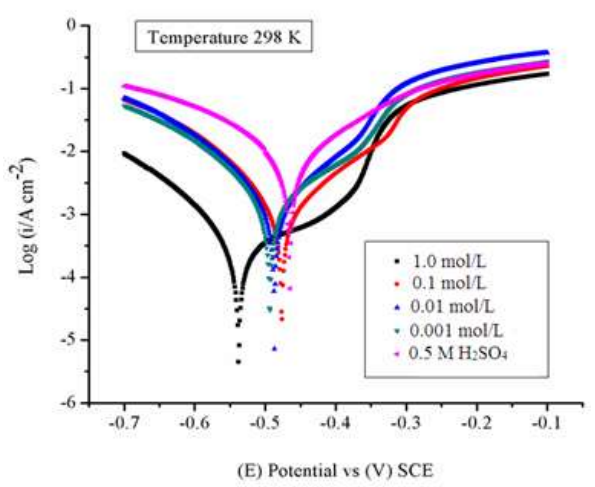
DP curves for the WE (MS) in the 0.5 M H2SO4 solution without and with BDTT, in different Ct, are represented in Fig. 1, at 298 K. Anodic and cathodic reactions, which took place on the MS electrode surface, were inhibited by BDTT molecule. IE(%) values were determined by Eq. (4).
where IAcid and Iinh are Icorr density in the 0.5M H2SO4 solution without and with BDTT.
BDTT effect on anodic reaction was stronger than on the cathodic one. BDTT retarded MS dissolution, which was suggested by the results 30. Ec corrosion parameters, such as Ecorr, (a, (c and Icorr, are given in Table 1.
Table 1: GP and LPR for MS in the 0.5 M H2SO4 solution with and without BDTT, in various Ct, at 298 K.

Ecorr values difference was < 85 mV, which confirms BDTT is a mixed inhibitor type 31. BDTT adsorption at higher Ct was quite successful, and the CI covered the MS surface almost completely, which revealed its strength. Thus, at higher Ct, BDTT multilayer adsorption took place, which means that the SC of MS was complete, and all corrosion active sites were blocked. However, with lower Ct of CI, SC of MS decreased, and the metal was strongly corroded, due to the decreased IE(%) of BDTT 32,33.
At 298 K, BDTT highest and lowest IE(%) values were 95.38% (1.0 mol/L) and 81.82% (0.001 mol/L), respectively. LPR values revealed that BDTT absorption took place on the MS surface through the development of a non-conducting physical barrier 34. Rp values rose with higher Ct of BDTT. The increase in SC and BDTT adsorption onto the MS surface, with higher Ct, was confirmed by Rp data (Table 1). Eq. (5) further calculated IE(%).
where (Rp)inh is Rp value with BDTT.
EIS explanation
EIS gives detailed information about the electrode kinetics and surface characteristics. EIS was performed at 298 K. Nyquist and Bode curves plots for MS in the 0.5 M H2SO4 solution without and with BDTT, in different Ct, are shown in Fig. 2a-b.
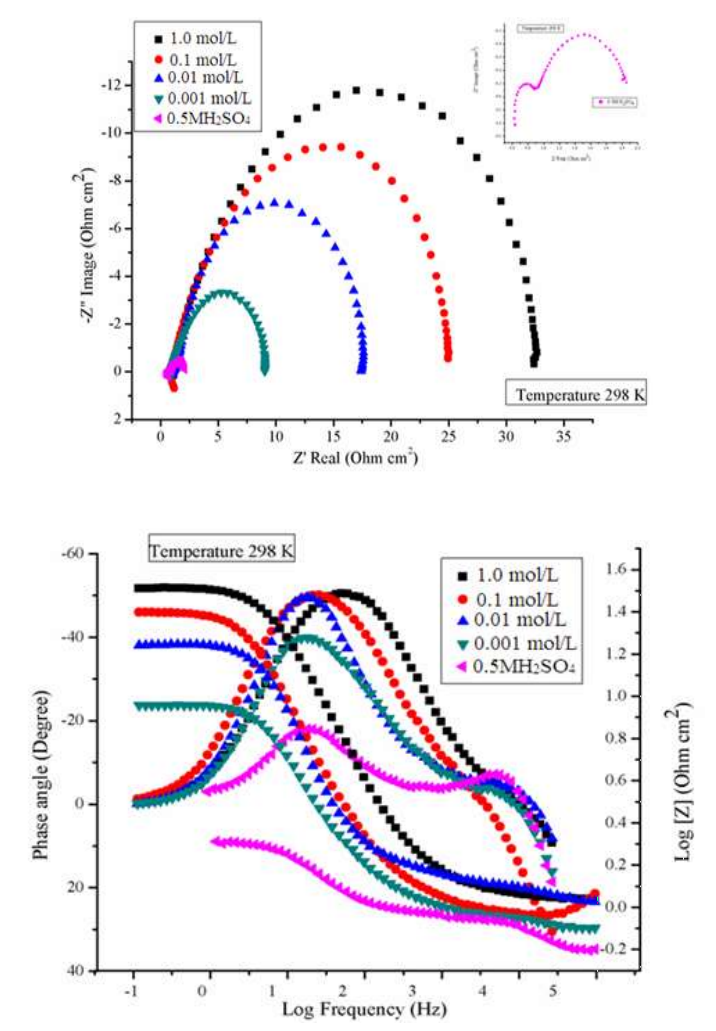
Figure 2 a: Nyquist plots curves for MS in 0.5 M H2SO4 without and with BDTT, in different Ct, at 298 K. b: Bode plots curves for MS in 0.5 M H2SO4 without and with BDTT, in different Ct, at 298 K.
Fig. 2a shows that MS impedance response in H2SO4 with BDTT significantly increased. At high-frequencies, the inhibitor system semicircles diameter was noticeably higher than that of the blank solution. This confirms that MS corrosion in H2SO4 was inhibited by BDTT. Eq (6)
where Rctinh is Rct with inhibitor in the H2SO4 medium.
In H2SO4, the incessantly corroded MS surface became asymmetrical, as reflected on the small phase angle. Thus, BDTT adsorption onto the MS surface decreased, and the phase angle increased, approaching 90° 35. Fig. 2b capacitive behavior in MS with BDTT is depicted by Bode plot.
The MS/solution interface capacity increased due to BDTT adsorption on it 36. Cdl was calculated by using Eq (7). Table 2 shows that Rct decreased and Cdl increased, with higher Ct of BDTT and its larger SC of the MS surface, which improved IE(%) 37.
where Fmax is the maximum frequency through Nyquist plot.
Eq. (8), Cdl values decreased towards a constant local dielectric lower value, and the protective layer thickness increased, which enabled BDTT adsorption at the MS/solution interface 38.
where A is the electrode surface area, Ɛ and Ɛo are the medium dielectric constants and vacuum permittivity, respectively, and d is protective layer thickness. Further, in Table 2, Cdl values decreased with higher Ct of BDTT, confirming the rise in the protective layer thickness, which means that d value in Eq (8) increased.
Surface heterogeneity is related to phase shifts that are known n values from Eq. (9).
where Q is CPE and ω is part of the impedance spectrum imaginary value, with maximum angular frequency.
Herein, n values were close to one, with higher Ct of BDTT molecule, which enabled the interface to achieve capacitance 39. BDTT reached IE(%) of 95.44 and 79.51, at 1.0 and 0.001 mol/L respectively, which revealed that it was an effective inhibitor of MS corrosion in H2SO4.
WL studies
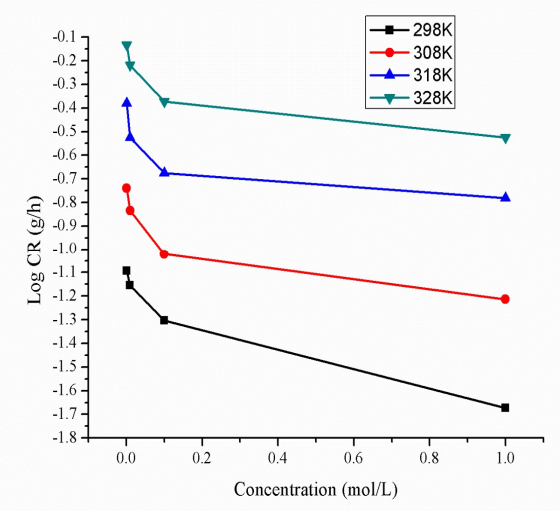
WL technique provides essential information on CR of MS and IE(%) of BDTT 40. WL test was carried out on MS coupons (1 x 1 cm) immersed in 0.5 M H2SO4, at different Ct of BDTT, for 24 h, from 298 to 328 K. The graphs plot between CR of MS and Ct of BDTT are shown in Fig. 3.
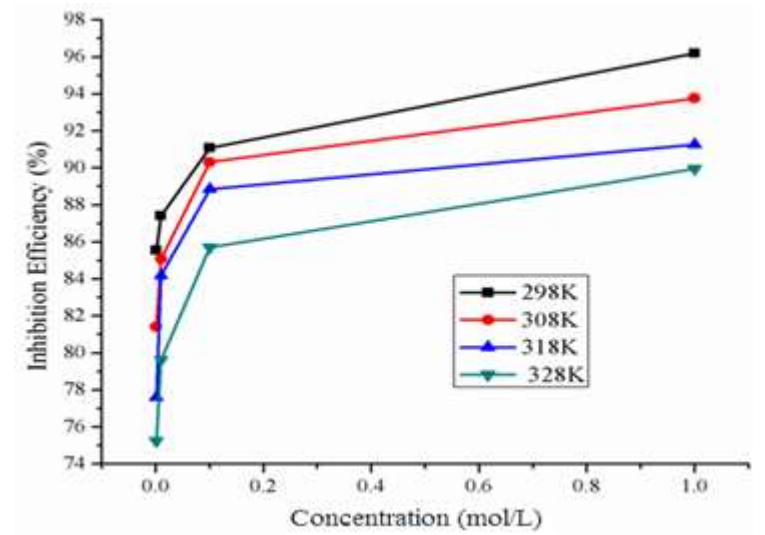
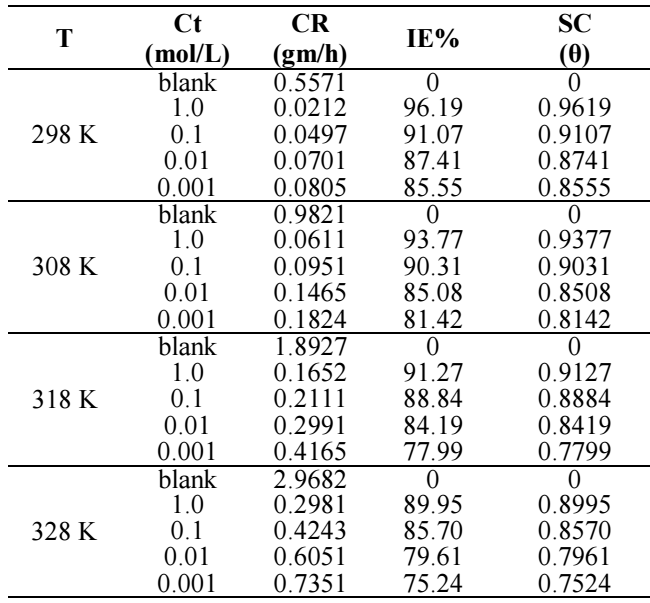
The graphs for IE(%) of BDTT vs. its Ct in the 0.5 M H2SO4 solution are shown in Fig (4). CR decreased and IE(%) increased with a rise in Ct of BDTT (Fig. 3 and Table 3), in aggressive environments (Fig. 4). The better properties of the studied inhibitor may be explained through transfer of charge/donation of electrons, because BDTT was adsorbed by the MS surface, reducing its dissolution in H2SO4.
BDTT adsorption capability is due to its molecules structure, with lone pair heteroatoms, multiple pi bonds and an aromatic system. Herein, the highest and lowest IE(%) of BDTT were 96.19% (1.0 mol/L) and 85.55% (0.001 mol/L), respectively. Fig. 4 and Table 3 show that a rise in T increased CR of MS and decreased IE(%) of BDTT. Therefore, MS dissolution took place, and HER was promoted.
T kinetics (adsorption and activation Td parameters)
Adsorption isotherm
Adsorption isotherms explain the interaction between MS surfaces and BDTT molecules. The water molecules replacement involved the adsorption in the metal/solution interface, via the following process 41,42: Eq. (10)
Temkin’s, Freundlich’s, Frumkin’s, Langmuir’s, Henry’s, Viral’s, Damaskin’s, Volmer’s and Flory-Huggins’s adsorption isotherms 40,41 were tested through the best fit with experimental data. BDTT molecule best adsorption behavior was explained by Langmuir’s isotherm 42. From the determination, R2 values were equal to one. This adsorption isotherm was depicted by Eq. (11).
where θ is SC degree and Cinh is Ct of BDTT. The relationships between Cinh/θ and Cinh were linear (Fig. 5), which suggests that BDTT molecule adsorption onto the MS surface obeyed Langmuir’s isotherm with every studied T.
ΔG°ads for BDTT molecule adsorption onto the MS surface was calculated by Eq. (12).
From Eq. (12), 55.5 is the Ct of water molecule in the solution. ΔG°ads values are negative, which means that BDTT molecule adsorption onto the MS surface was a spontaneous process, at all T 45. Usually, if ΔG°ads values are nearby -20 kJ/mol-1 or less, the adsorption process establishes an electrostatic interaction between the charged metal surface and inhibitor molecules, i.e. “physisorption” 46. If ΔG°ads values are around than -40 kj/mol-1 or more, the adsorption process occurs via charge transfer or sharing between the inhibitor molecules and the metal surface, and formation of a coordinate bond with the metal, i.e. “chemisorption” 47.
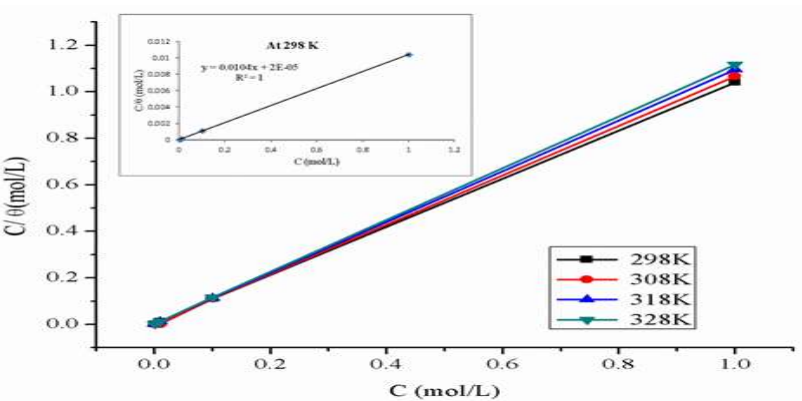
Figure 5: Langmuir’s isotherm for BDTT (with various Ct) adsorption onto the MS surface in 0.5 M H2SO4, at several T.
In this study, ΔG0 ads values were above 40 kj/mol-1 (Table 4), which indicates that BDTT molecule absorption onto the MS surface was chemisorption.
Table 4: Td parameters for BDTT adsorption onto the MS surface in a 0.5 M H2SO4 solution, at various T.

Other Td parameters, such as ΔS°ads and ΔH°ads were calculated by Eqs. (13) and (14).
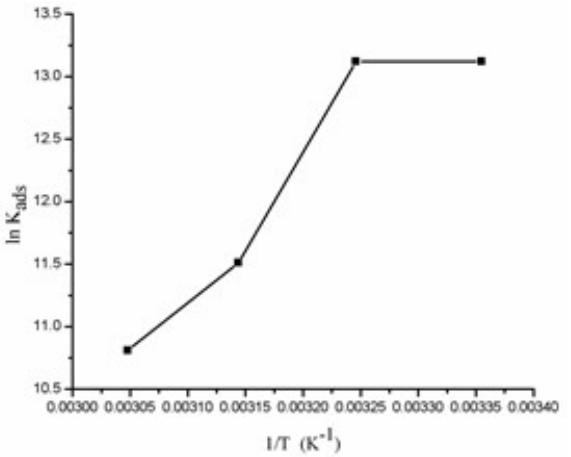
The graph plot between ln Kads versus 1/T for BDTT molecule adsorption is shown in Fig. 6.
From eq. (14), a straight line best fit was obtained for ΔH°ads /R slope and ΔS°ads /R-ln (55.5) intercept 48.
These Td parameters provide helpful information on the inhibitor molecule adsorption via CI mechanism. When ΔH°ads > 0, the adsorption process is endothermic (chemisorption). When ΔH°ads < 0, the adsorption process is exothermic (physisorption, chemisorption or an involution of both) 46. Herein, ΔH°ads and ΔS°ads values were -61.12 kJ/mol-1 and 58.60 J/mol-1/K-1, respectively. Therefore, BDTT adsorption mechanism was a mixture of chemisorption and physisorption 47.
E a parameters
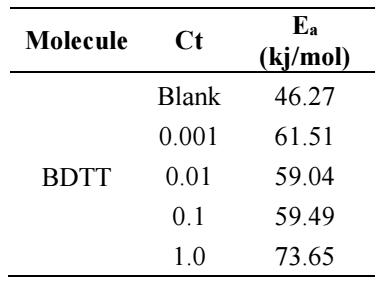
Further, Td parameters for Ea values were calculated by using Arrhenius graph (Fig. 7), which were obtained from Arrhenius Eq. (15), with and without BDTT molecule, using the slopes for log Icorr vs. 1/T (Table 5).
where A is pre-exponential factor and R is universal gas constant.
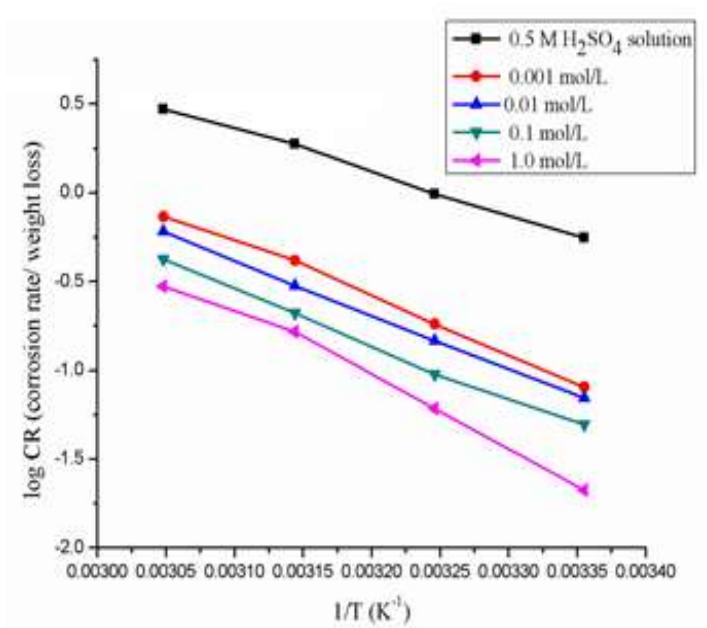
Figure 7: Graph of Arrhenius log (CR of MS) vs. 1/T in a 0.5 M H2SO4 solution with various Ct of BDTT.
MS surface Ea was high, which means that BDTT worked as anti-corrosion catalyst. 48 stated that Ea low values with reduced inhibitor Ct are associated with chemisorption, whereas high Ea values with increased inhibitor Ct correspond to physisorption.
DFT treatment (computational study)
BDTT molecule structures were optimized using DFT hybrid functional as (6-311G B3LYP), which are shown in Figs. 8a to 8c. Quantum chemical parameters are given in Table 6. According to FMO theory, a transition state is developed due to the interaction between HOMO and LUMO 49. HOMO usually has the ability of donating electrons via the inhibitor molecule. EHOMO high value indicates electron donation to a suitable acceptor molecule with unfilled molecular orbitals of low energy. Increased EHOMO values empower the adsorption by influencing the transportation process 50. ELUMO represents the capability to accept electrons of the inhibitor molecules. ELUMO low values exhibit high acceptability of inhibitor molecules electrons. BDDT density distributions in FMO are shown in Fig. (8 b) (HOMO) and Fig. 8 c (LUMO). HOMO electron density in BDTT molecule is regularly dispersed close to N and S atoms, which specifies that the molecule has suitable sites for interaction with the MS surface.
LUMO electron density on BDTT dispersed approxim. over the whole inhibitor molecule. So, BDTT molecule was adsorbed on the MS surface, due to π electrons delocalization within the aromatic system, and also to the lone pair electrons in the hetero atoms. BDTT molecule adsorption was strong, due to the delocalized π electrons availability in the ring, and closeness to the MS surface.
From the DFT analysis of results shown in Table 6, BDTT molecule has high EHOMO and low ELUMO values, and ΔE for the BDTT molecule is given by eq. (16). ΔE value lower than 4.3301 eV means that BDTT molecule has good IE(%). The molecule electronic charge depicts the binding ability of that molecule, via chelating atoms, with the MS surface. The Mulliken charges of BDTT atoms represent the binding ability of that molecule with the MS surface 51. The chelating or binding ability between the metal surface and the inhibitor molecule depends on the electronic charge of the active or chelating atom. This means that, with higher negative charges, the binding ability is stronger. Table 6 shows other parameters that were also calculated via Eqs. 16, 17,18 to 24: ΔN, (, σ, π, ΔEbackdonation, (the energy difference between back-donation and electron transfers through the inhibitor molecule) and µ.
where I and A are IP and EA, respectively.
ΔE is high with a hard molecule and high with a soft molecule 52. BDTT molecular reactivity and stability were evaluated via global ( and σ in Eqs. (19) and (20). Chemical ( is the resistance to distortion or electrons clouds on atoms, molecules or ions, whereby polarization is almost unaffected by chemical reactions. Herein, BDTT value of ( was 2.1650 eV. Generally, global ( low value is likely to support greater IE(%) 50. Normally, adsorption occurs due to electrons transfer through the inhibitor molecule and σ high value 52. BDTT had a σ value of 0.4618 eV-1, which means it had great IE(%).
χ value describes inhibitor molecules attraction ability. When they have high χ values, their attracting power is stronger, and they have a stronger interaction with the metal surface, so as to accept electrons from it, which enables great IE(%). Herein, χ value calculated via Eq. (21) was 3.9891eV.
ΔN was calculated via Eq. (22) , where χFe is 7 eV and (Fe equals 0.
Table 6 shows ΔN significance: if ΔN ˃ 0, the electrons transfer occurs towards the metal surface; if ΔN ˂ 0, the electrons transfer occurs from the MS surface onto the inhibitor molecule 52. As 53 has reported, ΔN ˂ 3.6, which increases IE(%), with the inhibitor molecule rising ability to donate electrons to the metal surface. Herein, ΔN value was 0.6953, which indicates BDTT molecule ability to donate electrons to the MS surface, through the formation of a coordinate bond.
Eq. (23) shows that IE(%) of an inhibitor molecule depends upon π 54. High π values improve the inhibitor molecule ability to release electrons.
Eq. (24) calculates electrons charge transfer for donation or back donation 55. Electronic back-donation occurs through the interaction between the MS surface and the inhibitor molecule. The change in energy is straightly associated with ( of BDTT, as shown in Eq. (24), which implies that, when ( > 0 or ΔEBack Donation < 0, charge transfer is followed by back-donation via the inhibitor molecule.
Herein, ΔEbackdonation and ( were 0.5412eV and 2.1650Ev, respectively. These values confirm the molecule ability to act as CI. μ is an additional parameter for the electronic charge distribution throughout a molecule, revealing its structure 54. No substantial relation between IE(%) and μ values was discovered.
Corrosion mechanism
In this study, BDTT molecule formed a protective layer onto the MS surface in 0.5 M H2SO4, during Ec analyses and WL test. BDTT performed successfully as CI for MS in the aggressive medium, at low T, and higher Ct, for a longer IT. BDTT molecule was adsorbed on the MS surface, due to interactions between hetero atoms (N and S) electron pairs, electrons clouds over imine bond and π-electrons clouds delocalized over aromatic rings with the Fe atoms containing empty d-orbitals. BDTT gained protons in the corrosion process, due to its basic character, and reached equilibrium, as Eq. (25) shows, being equivalent to neutral.
In 0.5 M H2SO4, due to negative charge, sulfate ions developed an additional charge density on the positively charged MS surface. This means BDTTH+ species had stronger adsorption abilities.
HER follows reactions 56 , as depicted in eqs. (26), (27), (28).
H reduction at the cathode into H2 gas ceased, and BDTTH+ species was competitively adsorbed onto the MS surface.
Conclusions
In the present study, synthesized BDTT behaved as anti-corrosion catalyst for MS substrate in 0.5 M H2SO4. The highest observed IE(%) of BDTT (1.0 mol/L) was 95.38%, at 298 K. BDTT adsorption onto the MS surface obeyed Langmuir’s monolayer isotherm. Ec techniques (EIS) associated Rct improvement with higher Ct of BDTT and decreased Cdl values. PDP and LPR measurements showed better IE(%) of BDTT with its higher Ct. DFT calculation also supplemented preceding outcomes.
Authors’ contributions
Ompal S. Yadav: made the original plan of the research and wrote the manuscript; performed experiments; analyzed and interpreted the results. Reshu Chaudhary: performed experiments; validated results; prepared the manuscript. Ashu Gupta: validated results; prepared the manuscript.
Acknowledment
This study was supported by principal Rabi Narayan Kar, Shyamlal College, University of Delhi. All the authors acknowledge the financial support provided from DBT-Star College Scheme. They also thank for the research facilities provided by the Department of Chemistry Shyamlal College and the University Science Instrumentation Centre (USIC), University of Delhi.
Abbreviations
AC: alternating current
AR: analytical research
B3LYP: Becke-3-LeeYang-Parr
BDTT: (E)-5- (benzylideneamino)-1,3,4 thiadiazole-2-thiol (green azo methane)
C2H3N3S: 5 amino-1,3,4 thiadiazole- 2- thiol
C₂H₆O: ethanol
C₇H₆O: benzaldehyde
Cdl: double layer capacitance
CI: corrosion inhibition/inhibitor
Cinh: inhibitor concentration
CPE: constant phase element
CR: corrosion rate
Ct: concentration
DFT: density functional theory
E: potential
Ea: activation energy
Ec: electrochemical
Ecorr: corrosion potential
EHOMO: energy of the highest occupied molecular orbital
EIS: electrochemical impedance spectroscopy
ELUMO: energy of the lowest occupied molecular orbital
FMO: frontier molecular orbital
GP: galvanostatic polarization
H2SO4: sulfuric acid
HER: hydrogen evolution reaction
HOMO: highest occupied molecular orbital
I: current
Icorr: corrosion current
IE(%): inhibition efficiency
IP: ionization potential
IT: immersion time
Kads: constant of adsorptive equilibrium
LPR: linear polarization resistance
LUMO: lowest unoccupied molecular orbital
MS: mild steel
OCP: open circuit potential
PDP: potentiodynamic polarization
R2: regression coefficient
Rct: charge transfer resistance
Rp: polarization resistance
SC: surface coverage (θ)
SR: scan rate
T: temperature
Td: thermodynamic
TLC: thin-layer chromatography
WL: weight loss
Symbols definition
(a: anodic Tafel slope
(c: cathodic Tafel slope
ΔE: energy gap
ΔG°ads: standard free energy of adsorption
ΔH°ads: standard enthalpy
ΔN: fraction of transferred electrons
ΔS°ads: standard entropy
η: absolute hardness
μ: dipole moment
σ: softness index
χ: absolute electronegativity
π: chemical potential


