




 Inglês (pdf)
 Artigo em XML
 Referências do artigo
 Tradução automática
 Enviar este artigo por email
 Citado por SciELO
  Similares em
SciELO
Similares em
SciELO 
 Permalink
Introduction
SS is a metallic material usually employed in many different fields, including architecture, building and chemical engineering, metals extraction, desalination and wastewater treatment facilities, oil and gas industry, transportation, aerospace, food and beverage sectors, due to its great corrosion resistance 1. Cr in SS produces a passive film layer of Cr-rich oxide at lower T, in O presence, which is what gives the material its high resistance 1-2. During SS maintenance procedures employed in most manufacturing industries, saline media is used to clean steel parts and remove rust and calcification, sometimes in acid and alkali presence 3. The disadvantage of this essential procedure is alkali corrosive attack on the metal surface, which results in failings, or even long-term damage to machine parts.
CI are chemicals substances added to alkaline solutions to minimize corrosion. CI primary mechanism occurs through their molecule’s adsorption onto the metal surface. Due to this process, water molecules are displaced, and a barrier that shields the metal surface from aggressive media is created. Thus, it is important to consider the variables that influence the adsorption level. The presence of heteroatoms and specific functional groups, and the availability of conjugated electrons are all factors that provide adsorption centres for inhibitor molecules to bind with the metal surface via physisorption and/or chemisorption processes. Organic compounds must meet these structural requirements to be effective CI. The solution T and the inhibitors Ct are other variables that significantly impact adsorption.
It is known that the substructures of several regularly used dyes are organic inhibitors and share significant similarities with most heterocyclic organic compounds like pyridines, furans, imidazoles, thiophenes and isoxazoles 3-7.
This characteristic has inspired scientists throughout the world to investigate the use of dyes as CI. Dyes have started to replace harmful CI that were previously used, because they are non-toxic and have a negative influence on the environment.
Azo dyes are amino based aromatic compounds. Literature has reported studies on the extensive use of amine-based aromatic compounds as CI for several metals and alloys in various electrolytes. Generally, the amino group (-NH2) of such compounds serves as a site for interaction with the metallic surface, and the remaining molecules behave as water repellent 8.
9 synthesized and characterized a novel coumarin azo dye as CI for MS in an acidic environment, applying both experimental and theoretical approaches. Their findings show that the dye inhibited the corrosion process and protected the MS surface. Table 1 lists other research on similar dyes.
Table 1: Works related to the present research on different metals and corrosive media.
| Metals | Inhibitors | Corrosive media | IE(%) | Ref. |
|---|---|---|---|---|
| MS | Azo dye compound | HCl | 96% | 18 |
| MS | N-substituted p-amina azo benzene | H2SO4 | 82.48% | 19 |
| Al | Mono azo dyes | NaOH | 73% | 20 |
| MS | Mordant green 17 | HCl | 83.1% | 21 |
| CS | Benzonitrile azo dye | HCl | 99.5% | 22 |
| CS | Azo chromoto tropic acid dye | H2SO4 | 82.3% | 23 |
| CS | Alizarin yellow dye | HCl | 97.3% | 24 |
| MS | Allura red, sunset yellow and amaranth | H2SO4 | 90, 80 and 78% | 25 |
| MS | Chromotropic acid dye and chromotrope dye | H2SO4 | 83 and 87% | 26 |
| SS | DAD | NaCl | 90-98% | This study |
In the present study, DAD was investigated as CI for SS immersed in NaCl. Fig. 1 depicts DAD molecular structure. In addition to its eco-friendliness and availability, the molecule is relatively bulky and rich in N heteroatoms, making it a promising adsorbate and, hence, a viable candidate for CI 10.
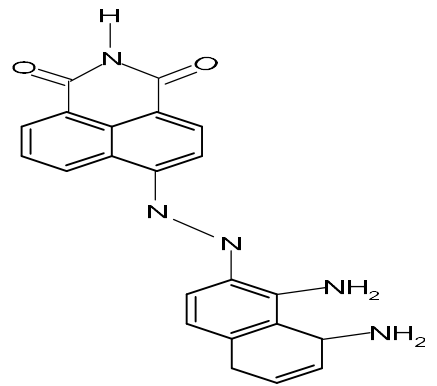
DAD molecular structure qualifies it as a suitable CI for two reasons: there are numerous N and O heteroatoms in its chemical structure, which have been widely discovered and proved in literature as excellent sites for adsorption onto the metal surface 11. DAD has also a very high molecular weight. Literature has widely reported that IE(%) is higher as the molecular species mass increases. This phenomenon is often due to the inhibitor bulkiness, which increases the metal SC 11.
Corrosion and inhibiting processes have been investigated by several authors who have employed thermometric and RSM methods, which are vital in estimating and predicting the service life span of metals in real-world settings and are less time consuming 12-17. However, DAD effects on SS corrosion behaviour are not yet well understood, and the use of RSM for predicting the inhibitor effect on SS in Cl media has not yet been reported until now.
Therefore, herein, experimental validation was done with the projected ideal process parameters, and the related IE(%) was examined using WL and thermometric methods, which are less expensive and quicker 10.
Experimental
Sample material and inhibitor preparation
In this study, a grade SS-410 SS sample with a thickness of 0.5 cm was employed, and it was cut into coupons of 5 x 1.5 cm. A 0.35 cm hole was drilled on each coupon. A twine was passed through this hole to aid suspension and total immersion in the media during WL measurements. SS-410 SS specimen chemical composition was: Cr (11.14%), Mn (0.82%), Cu (0.43%), C (0.134%), P (0.02%), Si (0.005%) and the remain Fe 2. DAD was purchased from Sigma Aldrich chemicals and used without further purification. 3.5% NaCl was prepared and used for making the test solution with DAD. To prepare 5.0 g/L Ct of the inhibitor stock solution, 5.0 g/L DAD were dissolved in 1000 mL 3.5% NaCl solution. Then, the resulting solution was allowed to stand for 24 h, to enhance DAD solubility. Different Ct of DAD were calculated from the stock solution, using the dilution formula C1V1 ═ C2V2, and subsequently used in experimental measurements.
WL test
WL approach is the one that is most frequently used to evaluate CI, since it is quite easy and dependable. Many corrosion monitoring methods use WL as a foundational method. Herein, the SS surface was polished to a mirror shine using 1200 and 800 grit emery paper, then washed with distilled water, rinsed with acetone, and finally dried in a desiccator, before being submerged in the test solution (250 mL). WL experiment was carried out by SS total immersion in a 3.5% NaCl solution with and without DAD. The specimens were removed from the solution after 24 h, washed with a bristle brush under running tap water, for removing the corrosion product, dried in a desiccator, and reweighed precisely. WL of SS was determined by the difference between initial and final weights. For each solution, experiments were conducted thrice. The mean value was then recorded and used to calculate CR and SC 18-27.
Thermometric test
A calorimeter was used to perform thermometric test. The principle behind this technique is to monitor the change in T per min. This experiment was carried out at 30 and 60 ºC. IE(%) was evaluated from RN obtained in Eq. 1.
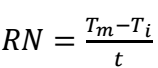 (1)
(1)where Tm and Ti are maximum and initial T in ºC, and t is the time taken in min to reach maximum T.Eq. 2
 (2)
(2)where RNblank and RNinhi are RN for SS corrosion in an aqueous solution without and with inhibitor, respectively.
RSM
For the data modelling and experimental runs, Design-Expert 13 software was employed. According to Table 2, the variables investigated were IT (A), T (B) and inhibitor Ct (C) (multiple input).
Table 2: CCD factor levels of independent variables.
| Independent variable | Low factor level | Medium factor level | High factor level |
| A: IT (h) | 24.0 | 72.0 | 120.0 |
| B: T (ºC) | 25.0 | 28.0 | 30.0 |
| C: Ct of DAD (g/L) | 0.1 | 2.6 | 5.0 |
Three levels of analysis were done on these 3 variables. To decide where the experimental run would take place, CCD was used in the trial design. 16 experimental runs were produced using CCD. The studies were conducted in random order, to prevent systematic errors. RSM results were assessed. The experimental evaluation of the various effects on CI at the design locations was carried out. A mathematical model was developed, for representing the relationship between process factors and IE(%). Using RSM, one may predict the optimum value for the highest possible IE(%).
ANOVA and graphical analysis of IE(%) and CR were obtained from RSM, after responses evaluation (Table 3).
Table 3: ANOVA for CI of SS in 3. 5% NaCl with DAD.
| ANOVA for RSM quadratic model | ||||||
|---|---|---|---|---|---|---|
| partial sum of squares - Type III | ||||||
| Source | Sum of squares | Df | Mean square | F-value | P-value, Prob > F | |
| Model | 9814.19 | 9 | 1090.47 | 41.48 | 0.0001 | Significant* |
| A-IT | 3120 | 1 | 3120 | 15.1 | 1.0000 | |
| B-T | 8011.32 | 1 | 8011.32 | 304.71 | <0.0001 | |
| C- DAD Ct. | 232 | 1 | 232 | 45.3 | 1.0000 | |
| AB | 18 | 1 | 18 | 2.7 | 1.0000 | |
| AC | 7 | 1 | 7 | 0.52 | 1.0000 | |
| BC | 4.3 | 1 | 4.3 | 0.38 | 1.0000 | |
| A² | 15.26 | 1 | 15.26 | 0.5804 | 0.4750 | |
| B² | 1511.65 | 1 | 1511.65 | 57.50 | 0.0003 | |
| C² | 15.26 | 1 | 15.26 | 0.5804 | 0.4750 | |
| Residual | 157.75 | 6 | 26.29 | |||
| Lack of fit | 157.75 | 5 | 31.55 | |||
| Pure error | 0.0000 | 1 | 0.0000 | |||
| Cor total | 9971.94 | 15 | ||||
| STD | R2 | 0.9842 | ||||
| Mean | Adj. R2 | 0.9605 | ||||
| CV% | Pred. R2 | 0.8802 | ||||
| Press | Adeq. precision | 1194.58 | ||||
It was also possible to derive mathematical models in terms of coded factors, which enabled to predict responses for a given level of each factor 28-30.
Results and discussion
WL measurement
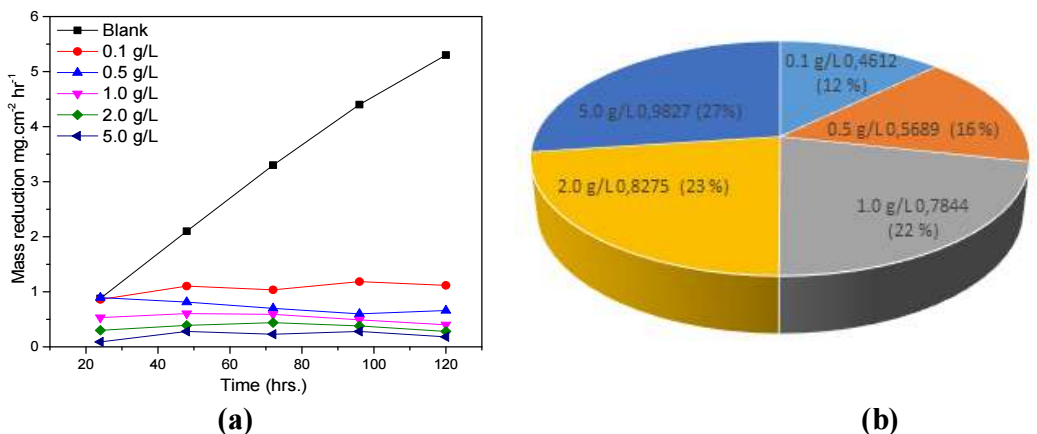
Fig. 2a displays calculated WL plots of SS in a 3.5% NaCl solution with and without various Ct of DAD, at 30 ºC. WL of SS decreased with higher Ct of DAD. This means that DAD inhibited SS corrosion in a NaCl solution. WL of SS was calculated by eq. 3).
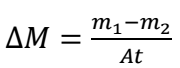 (3)
(3)where m1 and m2 are WL of SS specimens before and after their immersion in NaCl. Eq. 4 was used to calculate SC on SS.
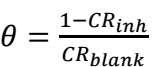 (4)
(4)where θ is SC of SS by DAD, and CRInh and CRblank are CR values of SS without and with DAD, respectively. They were obtained from the slopes plotted in Figs. 2a and b. SC on SS by DAD in an aqueous medium depends on the inhibitor Ct, due to its adsorption onto the metal 31-32.
Thermometric measurement
Thermometric analysis has proven to be quite useful in the understanding of metal corrosion. The method can also be used to assess IE(%) of a variety of chemical substances. Figs. 3a and 3b depict T variation with IT, for SS corrosion in a 3.5% NaCl solution, without and with DAD, at various Ct. The system T rose progressively, due to the exothermic corrosion reaction. The blank solution RN, at 30 and 60 ºC, was recorded as 0.8 and 1.40 °C/min-1, respectively. Table 4 also shows that RN values decreased with a higher Ct of DAD. This was due to DAD adsorption onto the SS surface, which prevented its corrosion in Cl solutions 27,33.
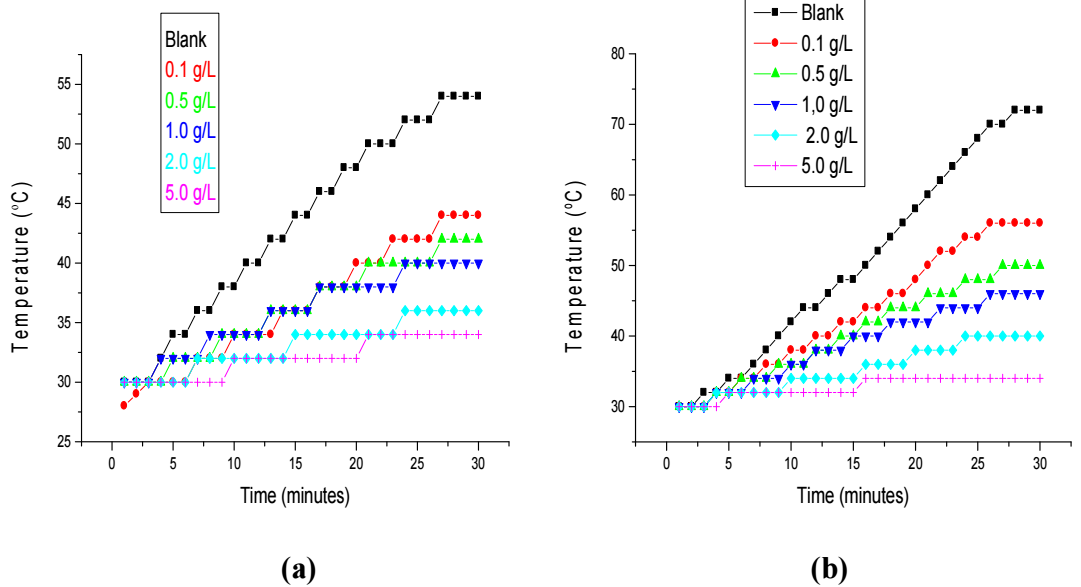
Table 4: RN thermometric calculated values for SS corrosion in 3.5% NaCl with DAD.
| Ct | T | RN | SC | IE(%) | ||||
|---|---|---|---|---|---|---|---|---|
| blank | 0.80 | |||||||
| 0.1 g/L | 0.53 | 0.337 | 33.7 | |||||
| 0.5 g/L | 30 ºC | 0.40 | 0.500 | 50.0 | ||||
| 1.0 g/L | 0.33 | 0.587 | 58.7 | |||||
| 2.0 g/L | 0.20 | 0.750 | 75.0 | |||||
| 5.0 g/L | 0.13 | 0.837 | 83.7 | |||||
| blank | 1.40 | |||||||
| 0.1 g/L | 0.93 | 0.385 | 38.5 | |||||
| 0.5 g/L | 60 ºC | 0.66 | 0.528 | 52.8 | ||||
| 1.0 g/L | 0.53 | 0.621 | 62.1 | |||||
| 2.0 g/L | 0.40 | 0.764 | 76.4 | |||||
| 5.0 g/L | 0.20 | 0.907 | 90.7 |
Results of RSM analysis
Table 5 demonstrates how Ct, T and IT affected WL, CR and IE(%). An ideal IE(%) of 98% was attained.
Table 5: RSM results of SS corrosion in a 3.5% NaCl solution with DAD.
| Std. | Run | Factor 1 (A) IT (h) | Factor 2 (B)T (oC) | Factor 3 (C) Ct of DAD (g/L) | Response 1 WL (mg) | Response 2 CR (mg/cm2/h) | Response 3 IE% |
|---|---|---|---|---|---|---|---|
| 14 | 1 | 72 | 28 | 5 | 0.4 | 0.511 | 98 |
| 15 | 2 | 72 | 28 | 2.6 | 0.4 | 0.511 | 72 |
| 2 | 3 | 120 | 26 | 0.1 | 0.215 | 3.256 | 24 |
| 11 | 4 | 72 | 25 | 2.6 | 0.03 | 3.256 | 72 |
| 7 | 5 | 24 | 30 | 5 | 0.215 | 6 | 98 |
| 4 | 6 | 120 | 30 | 0.1 | 0.4 | 0.511 | 24 |
| 8 | 7 | 120 | 30 | 5 | 0.03 | 7.87 | 98 |
| 1 | 8 | 24 | 26 | 0.1 | 0.4 | 6 | 24 |
| 6 | 9 | 120 | 26 | 5 | 0.03 | 0.5 | 98 |
| 16 | 10 | 72 | 28 | 2.6 | 0.03 | 3.256 | 72 |
| 12 | 11 | 72 | 30 | 2.6 | 0.215 | 3.256 | 72 |
| 3 | 12 | 24 | 30 | 0.1 | 0.03 | 0.511 | 24 |
| 10 | 13 | 72 | 28 | 2.6 | 0.215 | 6 | 72 |
| 9 | 14 | 24 | 28 | 2.6 | 0.215 | 6 | 72 |
| 13 | 15 | 72 | 28 | 5 | 0.215 | 3.256 | 98 |
| 5 | 16 | 24 | 26 | 5 | 0.53 | 3.256 | 98 |
Predicted and actual IE(%) values are shown in Fig. 4a, which indicates a strong correlation between experimental and theoretical studies. Eq. 5 is the general quadratic model with significant and insignificant variables, such as IT (A), T (B) and inhibitor Ct (C), which links them to IE(%). The model was reduced to Eq. 6, when only significant terms were taken into consideration. According to the statistical study, there was only a 0.01% chance that F-value could occur due to noise, and Ct of O and flow rates of DAD functional groups would be uncontrollable sources of noise. The models are important and useful for navigating the design environment 34.
 (5)
(5)
 (6)
(6)
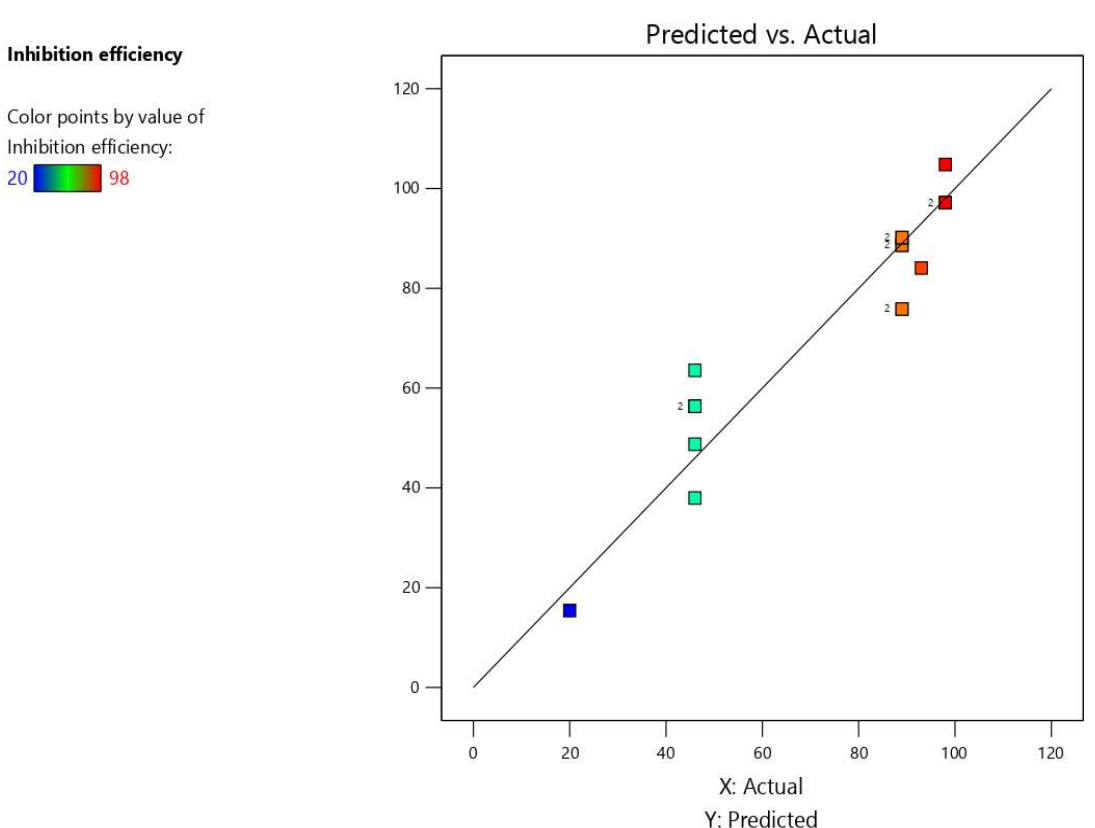
Figure 4: Plot comparing DAD predicted and experimental IE(%) values on SS corrosion in a 3.5% NaCl solution.
RSM plots
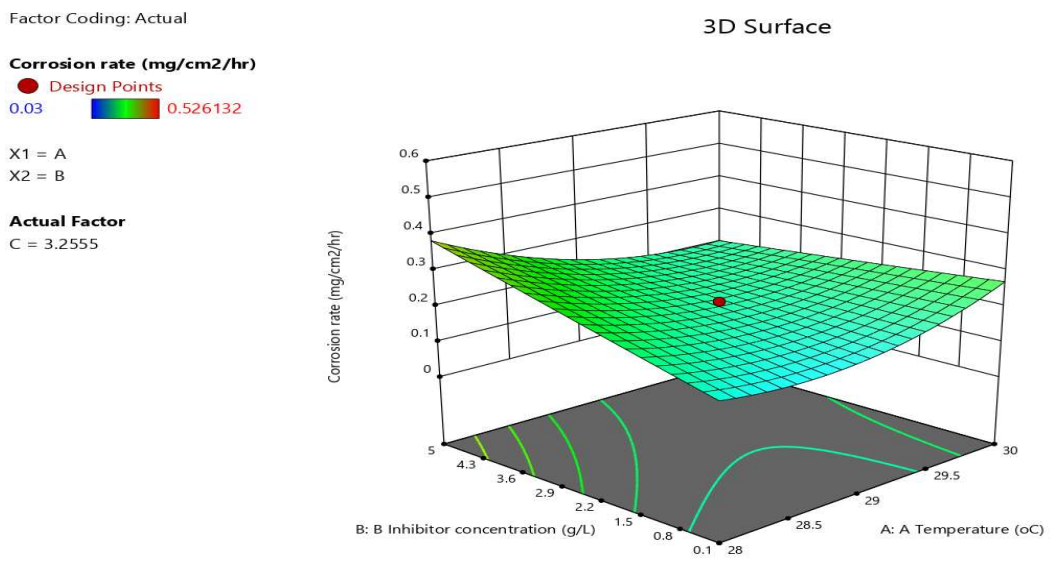
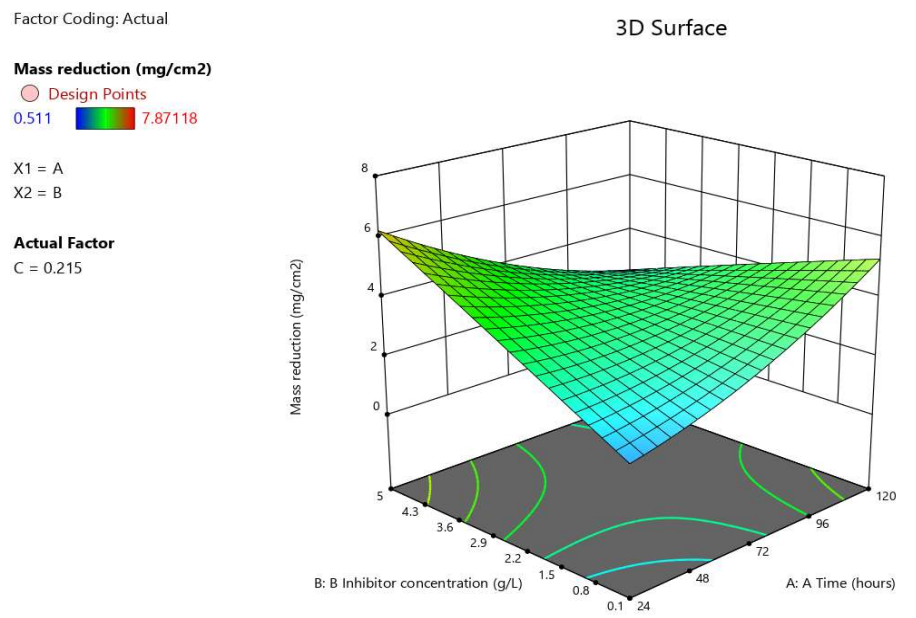
Researchers were able to examine the interactive impact of process variables on the percentage IE(%), by plotting a three-dimensional surface curve against any two independent variables, while holding the other one constant. Fig. 4 describes predicted vs. experimental plots, demonstrating that they were properly distributed near the straight line. This indicates a strong relationship between experimental and predicted response values. It also confirms that the selected quadratic model could accurately predict response variables for experimental data. A linear graph showing the link between factors and DAD corrosion IE(%) response in the planned experiment was produced by predicted vs. experimental plots (Fig. 4). Figs. 5, 6,7 illustrate the 3D surface plot.
Fig. 5 shows that, with a given Ct of CI, IE(%) increases with IT, but decreases with higher T.
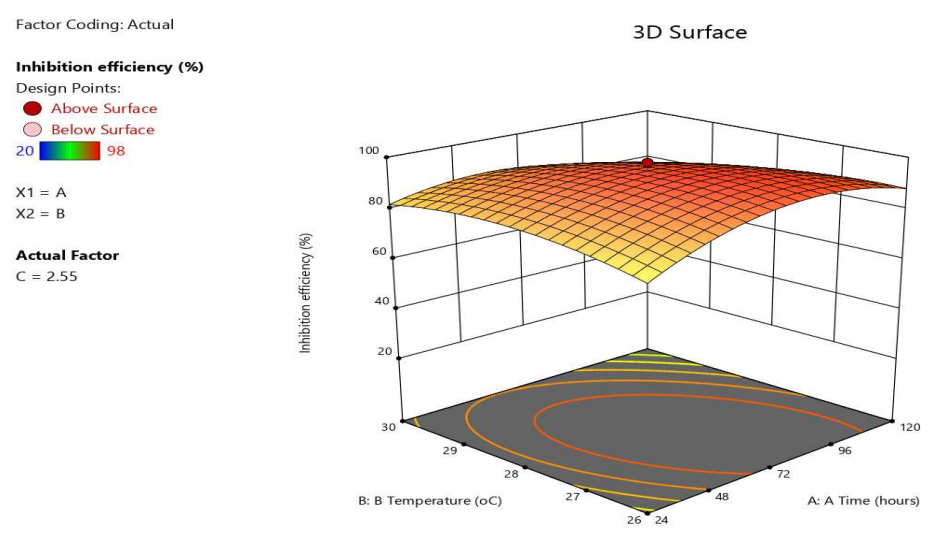
Fig. 6 reveals that CR decreased as Ct of DAD increased. However, CR increased with higher T. This confirms that the adsorption mechanism was physical, although Fig. 7 shows that WL decreased with higher Ct of DAD, and increased with prolonged IT 28-29,34-35.
Adsorption isotherm
Langmuir’s isotherm, which is defined by Eq. 7), is one of the most common methods for determining the adsorption nature of a CI.
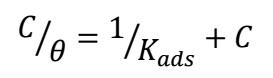 (7)
(7)The plot of C/θ vs. C gave a linear plot with R2 equal to 0.998 (Fig. 8).
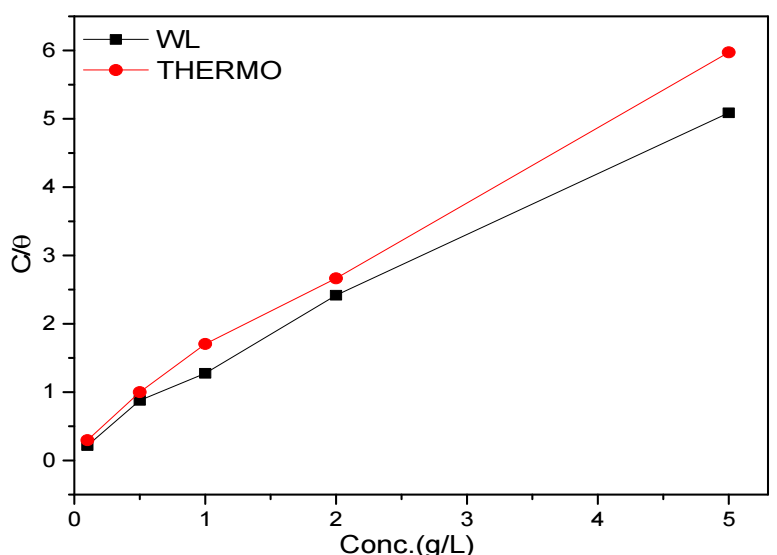
The plot suggests that DAD molecules were adsorbed onto the SS surface through a monolayer process, which is one of Langmuir’s isotherm assumptions. ∆G ads ∗ was calculated using Eq. 8.
 (8)
(8)where R is the ideal gas constant, T is 303 K, and K is the inverse of the intercept of the linear plot on the y axis.
∆𝐺 𝑎𝑑𝑠 ∗ calculated for WL and thermometric methods was -13.1 and -12.5 kJ/mol, respectively. The calculated values are negative and lower than the threshold values of 40 kJ/mol. This indicates that DAD adsorption mechanism was spontaneous and physical36-42.
Surface characterization
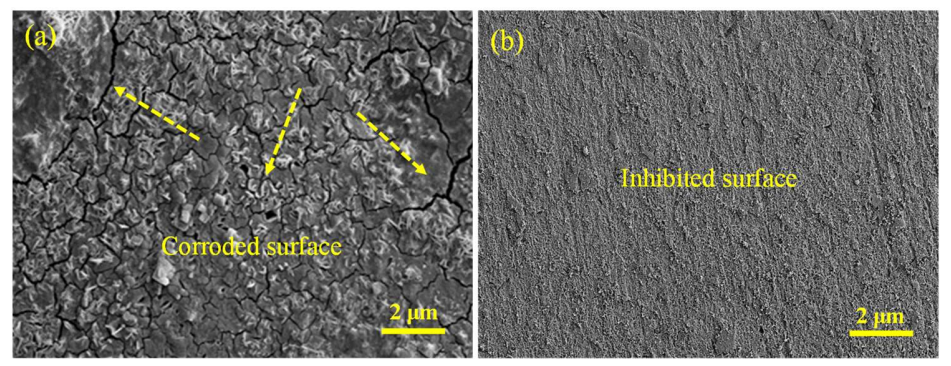
After 24 h of IT, the SS surface was assessed without and with DAD (5.0 g/L) using SEM technique. It is clearly seen on SEM images (Fig. 9a) that the SS surface was seriously affected in NaCl without DAD. However, with the CI, it was only slightly damaged (Fig. 9b). This revealed the formation of a film on the SS surface (via DAD molecules adsorption) 43-56.
Conclusions
In this study, DAD was tested as CI of SS in a 3.5% NaCl solution. From the obtained results, the following conclusions were taken: experimental analyses indicated that DAD acted as efficient CI for SS in a 3.5% NaCl solution; thermometric measurements revealed that IE(%) increased with DAD higher Ct, at raised T; DAD adsorption onto the SS surface obeyed Langmuir’s isotherm, and the mechanism was partly physical and chemical; RSM predicted CI of SS by DAD in a 3.5% NaCl solution. Error analysis revealed RSM technique superiority in modeling the CI of SS. Results from the significance test for model coefficients indicated that Ct of Cl was the most important factor in SS corrosion process; and SEM analysis showed that DAD, in the optimum Ct of 5.0 g/L, at 30 ºC, caused a significant reduction in the surface damage caused by the Cl solution attack.
Acknowledgments
The author acknowledges the Department of Chemistry, University of Cross River State, Calabar, for using their Physical chemistry laboratory for this research work. The author also appreciates the assistance of his students for assisting him in performing experimental measurements.
Author’s tasks
Fidelis Ebunta Abeng: conceived and designed the research work; performed experimental work; wrote the draft; conducted the review before submission.
Abbreviations
ANOVA: analysis of variance
CCD: central composite design
CI: corrosion inhibition/inhibitor
Cl: chloride
CR: corrosion rate
CS: carbon steel
CV: coefficient of variation
MS: mild steel
Ct: concentration
DAD: Diaminonaphthalene azo dye
HCl: hydrochloric acid
H2SO4: sulfuric acid
IE(%): inhibition efficiency
IT: immersion time
MS: mild steel
NaCl: sodium chloride
NaOH: sodium hydroxide
R2: correlation coefficient
RN: reaction number
RSM: response surface methodology
SC: surface coverage (θ)
SEM: scanning electron microscopy
SS: stainless steel
STD: standard deviation
T: temperature
WL: weight loss
Symbols definition
ΔGads: adsorption free energy

