


 Inglês (pdf)
 Artigo em XML
 Referências do artigo
 Enviar este artigo por email
 Citado por SciELO
  Similares em
SciELO
Similares em
SciELO 
 Permalink
Introduction
GW is a valuable and essential natural resource, flowing in underground geological aquifers or onto the surface. Thus, its chemical composition is linked to the existing environment 1,2. Understanding HG is important to establish the source of GW chemical composition and its interaction with rocks 3. It is also known that water quality is a significant factor influencing both human and animal health 4. Likewise, natural processes and human activity affect water quality 5,6. Therefore, the knowledge of GW characteristics is vital for its management in the studied area 7. Indeed, different ionic ratios can be employed to describe water chemical composition, like some researchers have done, to point out GW chemistry evolution 8-10.
Various investigations have discovered that several geochemical procedures, such as ion exchange, evaporation, rock weathering and mineral dissolution influence GW chemistry proprieties 11. Then, whether water is for drinking or agriculture purposes depends on MW chemical composition; numerous investigators have examined surface water and GW hydrochemistry to assess if they are potable 12,13.
However, GW in deep aquifers generally retains its stable isotopic signature (δ18O, δ2H) without being mixed with waters of different isotopic composition. Thus, stable isotopic configuration is used to distinguish fresh GW of isotopically separated bases from meteoric waters 14, such as vaporized water, during perpendicular transfer to unconfined or surface aquifers 15. However, it is known that fresh water δ2H/δ18O fraction differs, due to latitudinal and chronological climatic systems, which allow for precipitation waters dispersion throughout geographic areas 16. In addition, this fraction strongly depends on T, altitude, latitude, precipitation (which affects tropical and equatorial areas), and it is a function of climatic hazards 17-19.
In this study, to determine geochemical processes contributing to water mineralization, major constituents and stable isotopes of GW from SS Moroccan L-D region were evaluated using chemical technics and AAS.
Experimental
Investigated zone
The investigated zone is L-D (Fig. 1), in SS Morocco (17°E - 11°E. 20°40'N - 28°48'N).
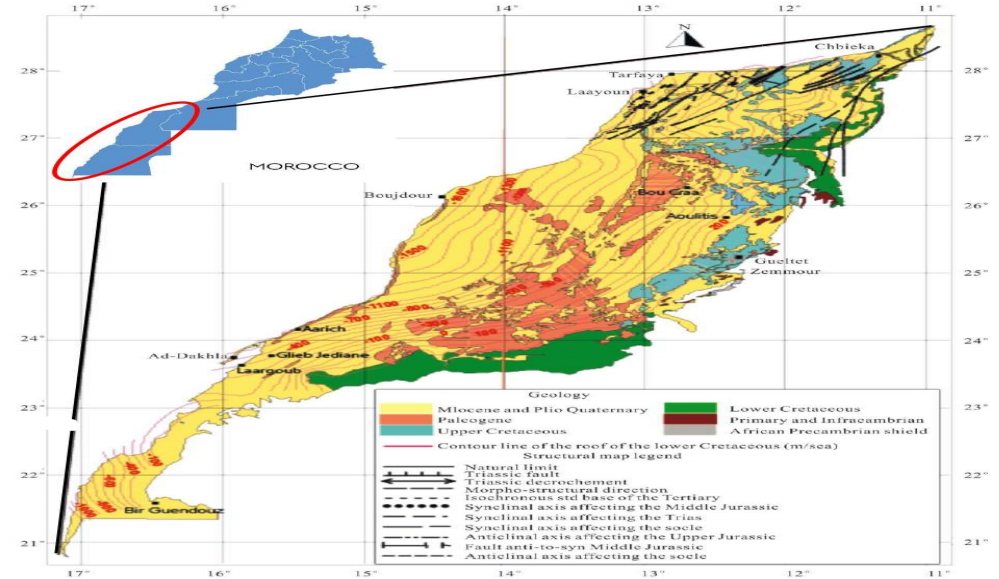
Figure 1: Geographical location of L-D, presenting the lower cretaceous rock roof and the structural basin 13,23.
It is a sedimentary basin with an area of about 326.810 km2, made up of tabular plains extending on the west by the Atlantic Ocean and on the southeast by the Zemmour fault, with widths ranging from 400 km to 400 m and heights from 0 to 400 m. These formations separate older African massifs such as Anti-Atlas and Mauritania series, and Tindouf basin. Thus, they have considerable GW resources that flow into a complex aquifer made up of deep waters. So, there are three different aquifers in this basin: Plio-Quaternary formations with alluvial aquifers (such as the water layer from Laayoune and Foum El Oued); Paleogene aquifer with Marly sands (they generally come across in depths ranging from 150 to 300 m); and Lower Cretaceous aquifer which is in sandstone. This is the largest Saharan basin, due to its area and lithology, which allow for a massive supply of GW.
Geological study
Tarfaya-Aaiun (Laâyoune) basin extends from Tarfaya to Ifni, along Moroccan Sahara 20. Several authors have studied its geology, concluding that it consists of folded Precambrian and Paleozoic rocks covered by Mesozoic sediments of which thickness locally surpasses 12 km 21,22. The Plio-Quaternary aquifer is composed of marls from Upper Cretaceous and Miocene, and inferior sands, sandstone, dolomitic limestone, high sands and alluvia from Plio-Quaternary.
Along the Atlantic coast, Tarfaya-Dakhla washbasin resembles to Cretaceous and Neogene sediments dropped on Triassic-Jurassic syn-Atlantic bonds. Thus, Cretaceous marginal platforms rocks resemble to marine lagoon sediments with black shales rich in organic matter from Cenomanian-Turonian boundary. Paleocene-Eocene tinny sandy-marl sediments overlie Upper Cretaceous strata which, in turn, are covered by Miocene sequence, that thickens abruptly to the west 23.
Claystone, marl, siltstone and dolomitic limestone constitute Upper Albian to Lower Cenomanian sequence 24. Deeper-water shale and limestone are found in Upper Cenomanian-Turonian and Coniacian layers, charted by the shallow water oyster shell couches from Santonian. Altogether, Palaeocene, Upper Cretaceous and Lower Cretaceous sediments are condensed by an erosional unconformity 20. This erosion was produced between Santonian and Paleocene eras. Thin Eocene and Oligocene units are overlaid by a thicker Miocene layer that can reach a width of over 1 km 20.
Used materials and technics
All GW samples were taken from 30 wells (shallow and deep) in the year 2019. They were recovered and stored in polyethylene bottles, at 4 ºC. The analytical techniques employed are those previously made available by water analysis 25.
Physicochemical parameters (T, pH, EC and TDS) were obtained in situ, using a conductivity meter instrument (pH-meter PCE-PHD 1). Cationic ions (Ca2+, Mg2+, Na+ and K+) Ct were determined by AAS (iCE-3000 AAS; Thermo Scientific), while anionic ions (HCO3 - and Cl-) Ct were determined by chemical dosage, employing HCl and silver nitrate (0.1 N). Additionally, NO3 - and SO4 2- ions were obtained using colorimetric methods, with a UV-vis spectrophotometer Cecil CE-7500 instrument. δ18O and δ2H were obtained by MS. Employing techniques suggested by 26 and 27, every example was analyzed thrice, to obtain exact measures. Stable isotope analyses (18O and 2H) were performed using IRMS. With AQUAPREP automaton and CO2 equilibration, 18O analysis was performed using dual inlet method (0.05) error. 2H analysis was made employing continuous flow method, with a Eurovector PYROH Elemental analyzer, by pyrolyzing water in Cr presence, under He flow (0.8 error). The obtained values are given in δ(‰), relative to V-SMOW international standard.
Moreover, statistics were carried out by Aqua Chem 2014.2, which may exhibit qualified amounts of numerous ions in every studied GW sample.
Results and discussion
Table 1 presents results obtained from the analysis of physicochemical parameters for L-D area studied water. It is noteworthy that pH values of GW from the studied region ranged from 6.88 to 7.75, with an average of 7.34. This suggests a neutral nature of the investigated GW. EC and TDS values are significantly high, 3341.53 µs/cm and 2505.66 mg/L, respectively.
Table 1: Various physicochemical parameters results of L-D region water.
| Wells | X m | Y m | T °C | pH | EC µs/cm | TDS mg/L | HCO3 - mg/L | Cl- mg/L | SO4 2 mg/L - | NO3 mg/L | Ca2 mg/L + | Mg2+ mg/L | Na+ mg/L | K+ mg/L |
|---|---|---|---|---|---|---|---|---|---|---|---|---|---|---|
| W1 | 757879 | 3036372 | 36 | 7.48 | 4700 | 3210 | 201.37 | 1303.14 | 1190.79 | 0 | 422.44 | 129.28 | 913.85 | 30.11 |
| W2 | 738000 | 2963000 | 34.6 | 7.55 | 2880 | 2540 | 225.77 | 1175.00 | 1510.70 | 0 | 402.00 | 124.42 | 765.65 | 24.24 |
| W3 | 701599 | 2947370 | 54.5 | 7.32 | 6390 | 4740 | 152.55 | 684.19 | 1908.43 | 0 | 724.65 | 69.98 | 487.18 | 17.20 |
| W4 | 732675 | 2981680 | 40 | 7.33 | 3620 | 2470 | 189.16 | 959.63 | 744.24 | 0 | 349.50 | 61.24 | 618.44 | 20.72 |
| W5 | 764800 | 2935500 | 30 | 6.88 | 3030 | 2070 | 360.02 | 787.70 | 371.31 | 0 | 301.43 | 100.12 | 465.78 | 18.77 |
| W6 | 762450 | 2936500 | 30 | 7.00 | 2795 | 2120 | 360.02 | 816.41 | 381.40 | 0 | 333.47 | 40.34 | 448.76 | 19.94 |
| W7 | 762200 | 2934400 | 30 | 7.00 | 2584 | 1960 | 317.30 | 744.80 | 353.06 | 0 | 209.76 | 87.84 | 459.80 | 17.99 |
| W8 | 753597.7 | 2855142.5 | 29 | 6.90 | 6895 | 5230 | 353.92 | 2164.07 | 699.39 | 9.30 | 423.44 | 188.69 | 1310.43 | 17.20 |
| W9 | 715200 | 2916800 | 27 | 7.40 | 6750 | 5900 | 976.30 | 1074.14 | 2200.48 | 2.48 | 942.48 | 269.73 | 665.78 | 72.34 |
| W10 | 735165.3 | 2829710.6 | 29 | 6.93 | 1700 | 1400 | 475.96 | 400.94 | 165.55 | 0 | 134.07 | 59.29 | 307.84 | 10.17 |
| W11 | 723200 | 2904034 | 40 | 7.34 | 5600 | 4820 | 353.92 | 2327.29 | 239.21 | 6.82 | 322.24 | 128.18 | 1460.32 | 51.22 |
| W12 | 570380 | 2770285 | 22.1 | 7.22 | 4070 | 2780 | 139.74 | 709.71 | 1418.95 | 0 | 619.09 | 122.47 | 396.81 | 52.00 |
| W13 | 562000 | 2767735 | 49 | 7.45 | 3550 | 2420 | 128.14 | 808.97 | 600.44 | 0.62 | 221.24 | 39.85 | 637.97 | 13.69 |
| W14 | 596099.8 | 2833063.9 | 44 | 7.34 | 5010 | 4110 | 268.49 | 888.02 | 2378.69 | 0 | 733.56 | 48.60 | 691.46 | 19.16 |
| W15 | 405433 | 2622099 | 36 | 7.34 | 2630 | 1790 | 207.47 | 744.80 | 254.11 | 0 | 227.65 | 35.72 | 489.89 | 17.60 |
| W16 | 406340 | 2628134 | 33.5 | 7.75 | 2740 | 1870 | 164.75 | 798.33 | 249.30 | 0 | 157.11 | 30.25 | 574.75 | 19.16 |
| W17 | 427599 | 2643318 | 38.4 | 7.55 | 2307 | 1750 | 201.37 | 758.98 | 198.38 | 0 | 134.27 | 25.03 | 580.73 | 13.69 |
| W18 | 414890 | 2614006 | 28.3 | 7.21 | 2200 | 1500 | 256.28 | 572.87 | 266.11 | 0 | 224.45 | 47.63 | 359.79 | 8.99 |
| W19 | 411263 | 2611042 | 32 | 7.35 | 2210 | 1910 | 274.59 | 544.16 | 260.35 | 0 | 218.04 | 44.35 | 339.79 | 12.90 |
| W20 | 426224 | 2611569 | 36 | 7.42 | 2690 | 1830 | 183.06 | 629.59 | 717.29 | 0 | 343.08 | 52.49 | 439.80 | 18.11 |
| W21 | 442014 | 2661785 | 35 | 7.73 | 2175 | 1650 | 176.96 | 687.38 | 95.11 | 0 | 105.21 | 36.94 | 370.83 | 17.20 |
| W22 | 465000 | 2653100 | 35.5 | 7.29 | 2920 | 1990 | 170.86 | 758.98 | 220.00 | 0 | 150.30 | 37.91 | 505.67 | 12.90 |
| W23 | 406426 | 2628734 | 36.5 | 7.74 | 2780 | 1900 | 164.75 | 716.09 | 227.21 | 0.62 | 87.37 | 14.58 | 486.70 | 12.90 |
| W24 | 390220 | 2570860 | 32 | 7.75 | 5590 | 4820 | 109.84 | 1059.60 | 397.29 | 3.72 | 237.27 | 40.82 | 735.47 | 19.94 |
| W25 | 341668 | 2429916 | 36 | 7.14 | 2690 | 1840 | 231.88 | 687.38 | 199.35 | 14.88 | 142.48 | 36.94 | 465.55 | 9.78 |
| W26 | 547250 | 2641900 | 26 | 7.37 | 3320 | 2270 | 231.88 | 798.33 | 275.72 | 56.43 | 181.02 | 46.66 | 569.00 | 5.87 |
| W27 | 671150 | 2670650 | 24 | 7.38 | 2170 | 1480 | 183.06 | 487.08 | 180.13 | 54.57 | 129.08 | 30.13 | 296.80 | 5.08 |
| W28 | 648761 | 2654854 | 27.9 | 7.33 | 1610 | 1030 | 262.39 | 329.33 | 179.17 | 27.28 | 104.45 | 23.33 | 220.93 | 5.08 |
| W29 | 644465 | 2642845 | 26 | 7.44 | 1290 | 850 | 231.88 | 200.65 | 147.95 | 24.80 | 90.94 | 18.47 | 134.03 | 3.91 |
| W30 | 644598 | 2642784 | 26 | 7.33 | 1350 | 920 | 231.88 | 229.01 | 176.29 | 26.66 | 82.76 | 49.57 | 123.92 | 5.08 |
Ct of Ca2+ and Mg2+ varied from 82.76 to 942.48 mg/L and from 14.58 mg/L to 269.73 mg/L, with an average of 291.83 and 68.03 mg/L, respectively. In addition, Ct of Na+ and K+ varied from 123.92 to 1460.32 mg/L and from 3.91 to 72.34 mg/L, with an average of 290.47 and 15.033 mg/L, respectively. Table 1 shows that main anions in the studied zone alternated from 200.65 to 2327.29 mg/L, 95.11 to 2378.69 mg/L, 109.84 to 976.30 mg/L and 0 to 56.43 mg/L, for Cl-, SO4 2-, HCO3 - and NO3 - ions, respectively. In fact, NO3 - levels in most wells were low, under the boundary value defined by Moroccan standard (50 mg/L), apart from wells W26 and W27, of which maxima values were 56.43 mg/L. NO3 - presence in this GW is due to the activities performed there, such as fertilizers application on the farms, plants break down, discharge of human wastewater and domestic effluents 28. On the other hand, it is seen that the main cations mean molar has the following order: Na+ > Ca2+ > Mg2+ > K+. Anions trend as follows: Cl- > SO4 2- > HCO3 - > NO3 -.
HG facies of the investigated water
To determine HG facies of the GW samples, Piper diagram was used, and Fig. 2 represents the obtained results.
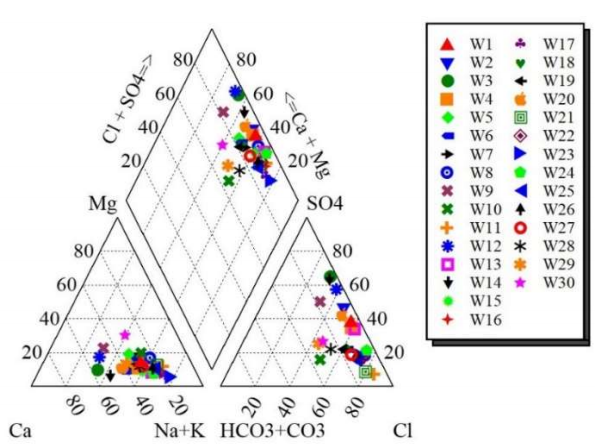
GW samples have a dominant percentage of 86.66% Na-Cl, probably due to evaporates deposits, and a main value of 13.33% Ca-SO4. In addition, the slight trend near facies of Ca-SO4 is perhaps due to gypsum lens dissolution situated in marly formations of Miocene, or by schist in the south of the studied zone. This indicates and confirms that GW quality is affected by several parameters, such as chemistry, reservoir rocks geology and anthropogenic factors 29,30.
HG procedures determination
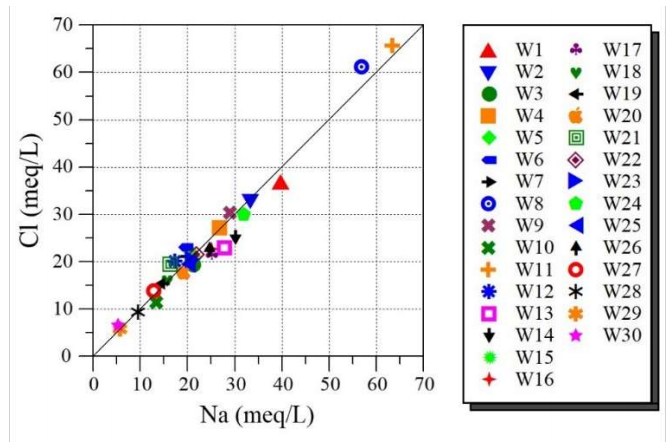
It is known that water-rock interfaces play a significant role in GW quality modification. They are also beneficial for identifying GW sources. To explain various HG intricate actions for developing water chemistry, the relationship between presented ionic elements was studied using dispersion plots 31. When the relationship is very adjacent to the right 1:1, the dependency grade is rectilinear between variables 32. This investigation may tell the source of diverse waters, and the procedures that created their chemical composition 10,33. In addition, to determine occurred HG procedures, numerous graphical standards are often employed. Fig. 3 represents Ct of Cl vs. Ct of Na diagram for the studied waters.
This diagram is often employed to determine the procedure responsible for water salinity 34. It is found that most samples are situated alongside NaCl halite solubility line (i.e., where the Na/Cl molar quotient = 1), which is related to the marine spray dissolved by rainwater (sea salt), or to evaporites modification 35.
In addition, the correlation factor between chemical constituents (Na+ and Cl) in the investigated GW was very high (R = 0.98). This finding indicates that their correlations are quite robust, since they have an identical source. Indeed, it is noticed that the source has a dry location, with high-speed evapotranspiration, which causes the formation of salt deposits that are splashed into GW 36.
This diagram is often employed to determine the procedure responsible for water salinity 34. It is found that most samples are situated alongside NaCl halite solubility line (i.e., where the Na/Cl molar quotient = 1), which is related to the marine spray dissolved by rainwater (sea salt), or to evaporites modification 35.
In addition, the correlation factor between chemical constituents (Na+ and Cl) in the investigated GW was very high (R = 0.98). This finding indicates that their correlations are quite robust, since they have an identical source. Indeed, it is noticed that the source has a dry location, with high-speed evapotranspiration, which causes the formation of salt deposits that are splashed into the GW 36.
Source of Ca 2+ , Mg 2+ , HCO 3 - and SO 4 2- ions
Fig. 4 represents the plot of SO4 2- + HCO3 - vs. Ca2+ + Mg2+ ions.
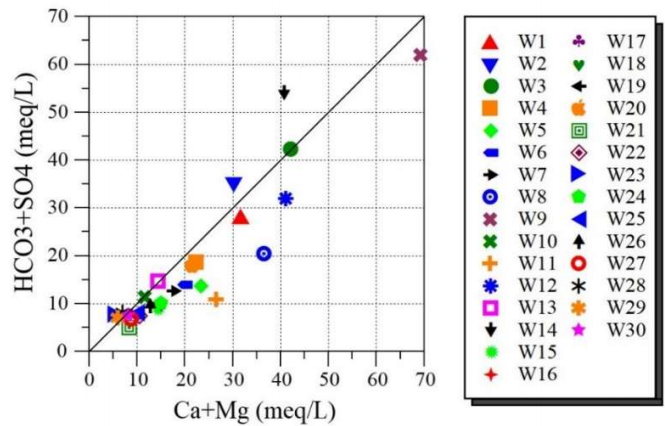
It is seen that GW samples are dispersed on line 1:1 (least mineralized) and beyond. In addition, samples adjacent to 1:1 display that calcite, dolomite and gypsum dissolution is the main mechanism in the system 37.
However, in CO₃²⁻ media, simultaneous Ca2+ ions enhancement and Mg2+ ions diminution are principally due to interaction phenomena between rocks and water, such as dolomitization, dissolution and precipitation 38.
On the other hand, Fig. 5 is the graphic representation of Ca2+ vs. Mg2+ ions.
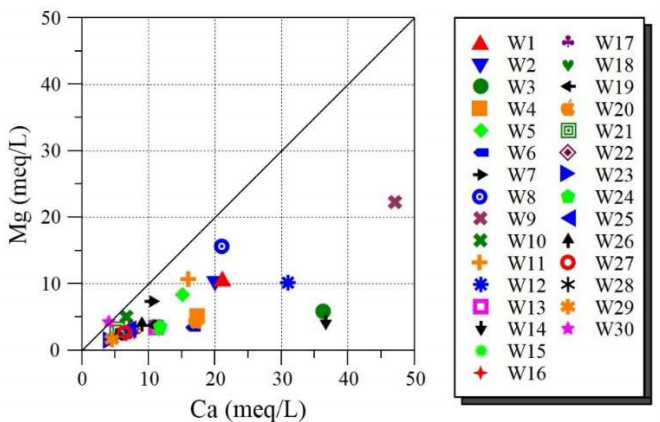
It is seen that some of the studied GW points have a Mg2+/Ca2+ ratio different from 1:1 line. This finding means that Ct of Ca2+ is higher than that of Mg2+ ions. Ca2+ source mainly comes from gypsum dissolution. It is known that dolomite dissolution results in a 1:1 relationship between alkalinity and Ca2+ + Mg2+ ions. Indeed, Fig. 6 represents the variation in Ca2+ + Mg2+ vs. HCO3- ions and Ca2+ vs. HCO3- ions.
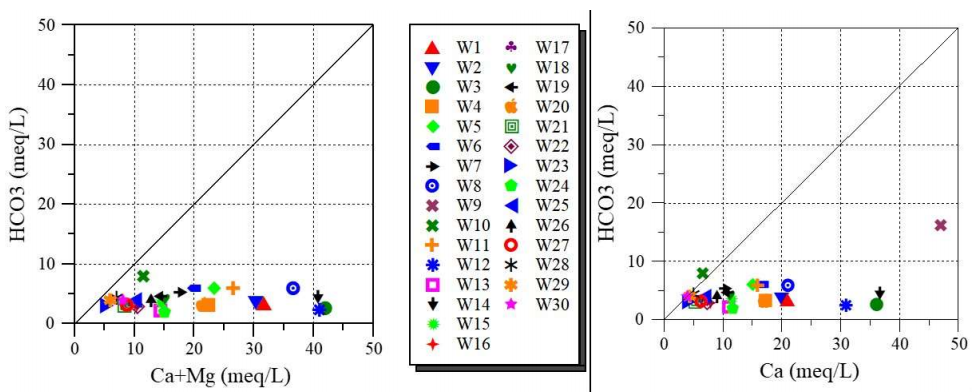
It was noticed that the relationship between alkalinity and Ca2+ + Mg2+ ions is weak. This finding shows that dolomite dissolution was not the principal source of Ca2+ and Mg2+ ions in the studied GW area. Moreover, the relationship between alkalinity and Ca2+ ions is quite weak, indicating HCO3- ion reduction.
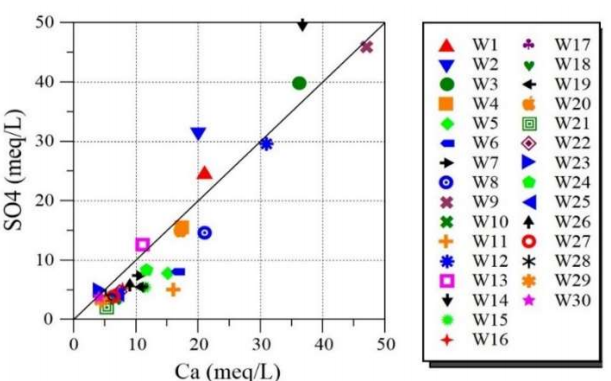
Nevertheless, Fig. 7 represents the plot of Ca2+ vs. SO4 2- ions. It is seen that the bulk of investigated GW is dispersed nearby the gypsum dissolution line. This confirms the source of Ca and SO4 ions dissolution (gypsum). Additionally, the obtained association between Ca and SO4 ions proposes the discharge of gypsum and anhydrite, when water runs underground.
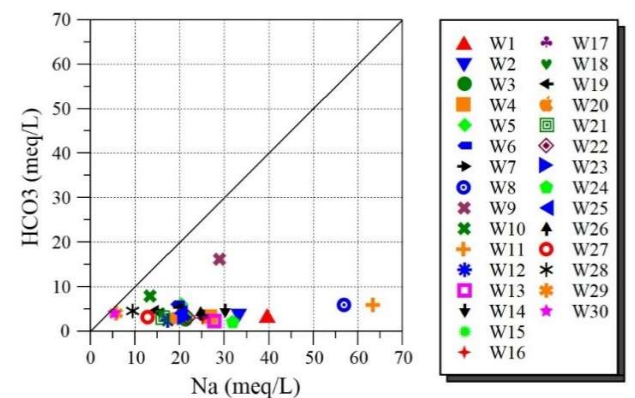
For more details, Fig. 8 shows the representation plot of Na+ ions vs. HCO3 - ions. A poor correlation between alkalinity and Na+ ions was obtained. This result suggests that Na₂CO₃ dissolution is not significant in the investigated area.
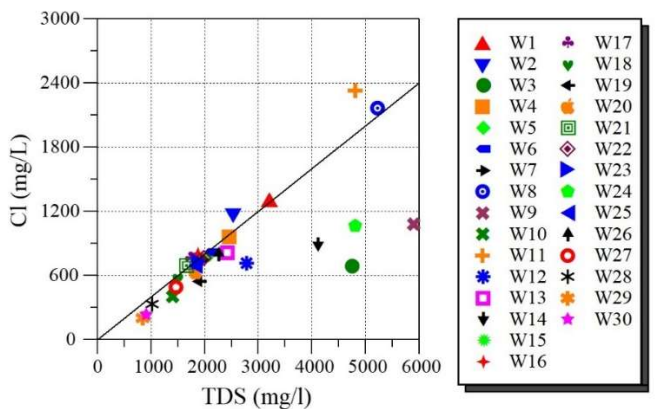
In fact, the studied SS zone is in the arid region, which offers an advantageous circumstance for evaporation and condensation. Due to evaporation, Cl- ions in GW from arid zones is high, which reflects its mineralization degree. Additionally, Fig. 9 shows the plot of TDS vs. Cl- ions. It is seen that Ct of Cl- rises with TDS growth, indicating that the investigated GW was affected by the evaporation phenomenon.
Mineral dissolution/precipitation: Gibbs diagram
It is known that the interaction between GW and aquifer minerals has an essential role in water quality, which is also suitable for determining its source 39. Gibbs 40 proposed a diagram where cations (Fig. 10a)) (Na + K)/(Na + K + Ca) and anions Cl/(Cl + HCO3) proportion (Fig. 10b)) is expressed in the relationship with TDS.
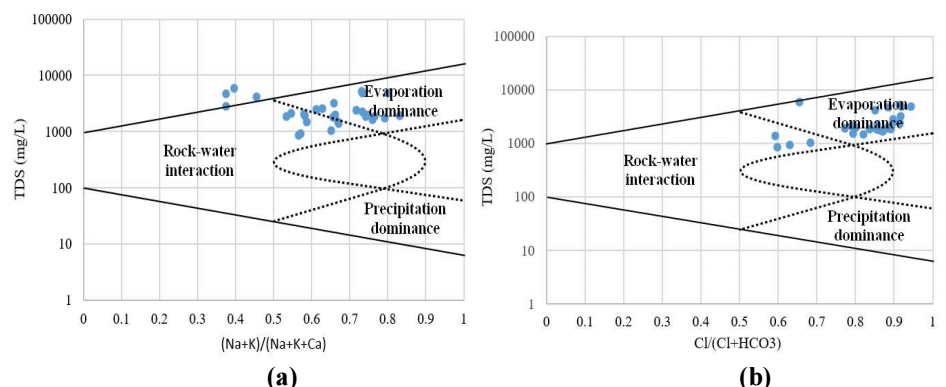
Fig. 10a and b represent obtained Gibbs plot for investigated GW from Moroccan L-D zone. It is seen that most of the studied samples were found at the evaporation area, where its effect foremost occurs in the investigated GW region. Therefore, it is concluded that the evaporative dissolution procedure governs GW chemistry in this area. In addition, it is noticed that most tester walls are in the evaporation area, which may be due to climatic circumstances (arid weather).
SI at chemical stability
According to literature, fresh-water quality and exchanges of water with soil and rocks through percolation and packing in aquifers play a very important role in the determination of GW chemistry 40. Indeed, SI are generally employed to define the trend of water towards precipitation or salt dissolution. Fig. 11 represents SI evolution of the investigated GW.
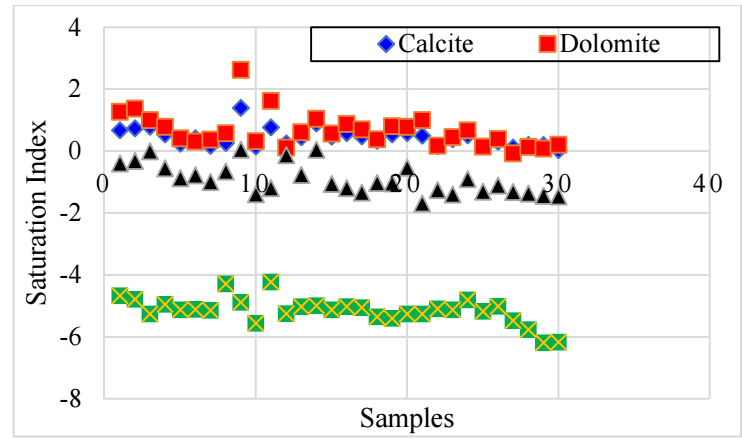
According to geochemical modeling results on GW development, there is an important relation between SO4 2- ions and SI of carefully chosen minerals. These findings reveal that CO₃²⁻ precipitation is intensely influenced by evaporative mineral dissolution.
Isotope results
The investigation of stable isotopes from water molecules was widely employed for studying GW. They offer more data on the water source and on how the GW is renewed. They also define small and durable climatic changes, and allow the quantitative valuation of mixing and other procedures, such as those reported by 42,43. Indeed, GW salinity origin can be found by stable isotopes configurations 44. They are equivalent to that of GMWL: δ2H (‰) = 8*δ18O (‰) + 10 45. 46 revealed that this relation is caused by isotopic water particles fraction through evaporation and condensation phenomena in hydrological cycle. Table 2 shows isotopic analyses of waters from the studied L-D region.
It is seen that O and δ2H values of the thirty studied GW testers changed from -6.96 to -8.93‰, and from -51.5 to -65.56‰, for δ18O and δ2H isotopes, respectively. These ranges describe an Atlantic source of precipitation. In addition, their findings are almost like those determined by other researchers 23.
Indeed, evaporation usually occurs through the surface runoff in lakes and reservoirs 47. Thus, the effect of isotopic conversion procedure can modify GW isotopic structure, which must also be taken into account 43. Moreover, atmospheric T is a main factor that controls isotopic composition and δD/δ18O relation of water 48.
Table 2: Isotopic analysis results of investigated samples.
| Wells | T °C | pH | EC µs/cm | TDS mg/L | Depth m | 18 O‰ | 2 H‰ |
|---|---|---|---|---|---|---|---|
| W1 | 36 | 7.48 | 4700 | 3210 | 450 | -8.78 | -64.1 |
| W2 | 34.6 | 7.55 | 2880 | 2540 | 629 | -8.63 | -62.55 |
| W3 | 54.5 | 7.32 | 6390 | 4740 | 920 | -8.93 | -63.55 |
| W4 | 40 | 7.33 | 3620 | 2470 | 650 | -8.55 | -63.05 |
| W5 | 30 | 6.88 | 3030 | 2070 | 552 | -8.78 | -63.9 |
| W6 | 30 | 7 | 2795 | 2120 | 452 | -8.77 | -65 |
| W7 | 30 | 7 | 2584 | 1960 | 497 | -8.76 | -65.56 |
| W8 | 29 | 6.9 | 6895 | 5230 | 450 | -7.31 | -57.64 |
| W9 | 27 | 7.4 | 6750 | 5900 | 390 | -8.82 | -60.1 |
| W10 | 29 | 6.93 | 1700 | 1400 | 260 | -8.23 | -58.13 |
| W11 | 40 | 7.34 | 5600 | 4820 | - | - | - |
| W12 | 22.1 | 7.22 | 4070 | 2780 | 145 | -8.57 | -63.6 |
| W13 | 49 | 7.45 | 3550 | 2420 | 900 | -8.32 | -60.9 |
| W14 | 44 | 7.34 | 5010 | 4110 | 881 | -8.7 | -63.25 |
| W15 | 36 | 7.34 | 2630 | 1790 | 510 | -8.32 | -63.22 |
| W16 | 33.5 | 7.75 | 2740 | 1870 | 470 | -8.26 | -63.31 |
| W17 | 38.4 | 7.55 | 2307 | 1750 | 543 | -8.37 | -62.23 |
| W18 | 28.3 | 7.21 | 2200 | 1500 | 315 | -8.39 | -62.67 |
| W19 | 32 | 7.35 | 2210 | 1910 | 415 | -8.42 | -63.13 |
| W20 | 36 | 7.42 | 2690 | 1830 | 490 | -8.48 | -62.36 |
| W21 | 35 | 7.73 | 2175 | 1650 | 720 | -8.65 | -60.65 |
| W22 | 35.5 | 7.29 | 2920 | 1990 | 525 | -8.27 | -63 |
| W23 | 36.5 | 7.74 | 2780 | 1900 | 530 | -8.43 | -62.25 |
| W24 | 32 | 7.75 | 5590 | 4820 | 350 | -8.59 | -62.65 |
| W25 | 36 | 7.14 | 2690 | 1840 | 450 | -6.96 | -51.5 |
| W26 | 26 | 7.37 | 3320 | 2270 | 180 | -7.73 | -58.25 |
| W27 | 24 | 7.38 | 2170 | 1480 | 140 | -8.4 | -62.55 |
| W28 | 27.9 | 7.33 | 1610 | 1030 | 175 | -8.63 | -62.75 |
| W29 | 26 | 7.44 | 1290 | 850 | 156 | -8.66 | -62.85 |
| W30 | 26 | 7.33 | 1350 | 920 | 165 | -8.62 | -63.45 |
Fig. 12 represents the diagram of isotopic composition (δ2H, δ18O) vs. LMWL and GMWL.
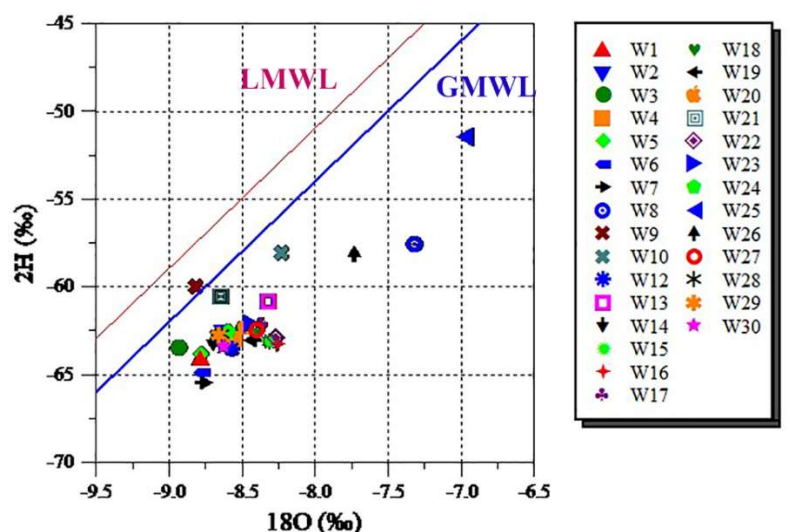
Thus, to assess the determined values for both meteoric water lines, it is seen that the complete points of tested GW are strategized to the right, describing a trend with an inclination of 5.35, and reproducing an evaporation incline between 4 and 6 in arid and semi-arid zones 43,50,51. These results suggest either evaporation of raindrops before hitting the ground 52, or overdue infiltration of precipitation, and a mixture of meteoric water with evaporated rain, in some limited samples 23.
In its turn, determining altitudes and recharge zones in the origin is very important for estimating GW assets. Thus, the stable isotope rank is employed to define fresh-water elevations. In addition, wastewater isotopic sign is frequently used vs. soil T, where the seepage follows 53. For this, the probable relation between δ18O isotopic quotient and water infiltration altitude was defined. Fig. 13 represents δ18O values and elevations of various investigated GW. Herein, a line drawn to give local altitude isotopic slope was obtained at -0.52‰ per 100 m.
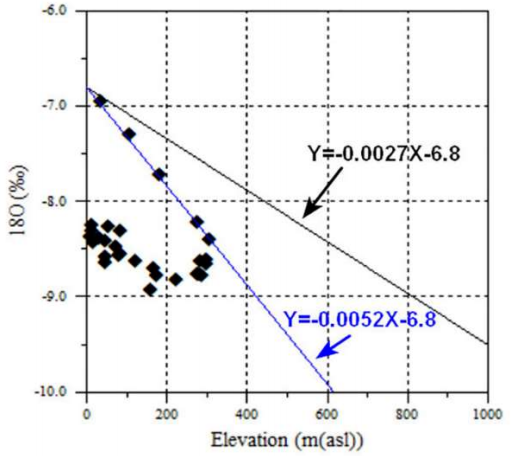
Thus, the obtained values are dissimilar from those presented in literature. In fact, on Morocco rule, the local altitude isotopic slope was about -0.27‰ per 100 m altitude 54. So, water should be recharged at altitudes that do not exceed 300 m above sea level. However, variations in isotopic structures between the aquifer and precipitation (which have been employed to define the slope) cannot be assigned to altitude, and may have been caused by soil T.
Conclusion
Combined HG and stable isotopes (δ18O, δ2H) practical approach in this investigation led to a good comprehension of the function of GW system in the studied L-D area, where mineralization procedure caused a significant modification in composition. Obtained HG parameters showed that abundant cations and anions followed the trend: Na+ > Ca2+ > Mg2+ > K+ and Cl- > SO4 2- > HCO3 - > NO3 -, respectively. In addition, two dominant HG facies were founded for GW of the studied zone: Na-Cl and Ca-SO4, with 86.66% of the former. It was also revealed that the main procedures in water mineralization are evaporation and minerals dissolution phenomena. Moreover, stable isotope data indicated an important origin of meteoric water recharge linked to a predominance of evaporation in the increase in salt Ct. Finally, it was found that waters are recharged at altitudes not higher than 300 m.
Authors’ contributions
K. Mizeb: collected data; conceived and designed analyses; performed analyses. M. Ghalit: collected data; contributed with data or analyses tools. M. Doubi: conceived and designed analyses; collected data; conceived and designed analyses; wrote the paper. M. El Kanti: conceived and designed analyses; collected data; contributed with data or analyses tools. H. Erramli: conceived and designed analyses; contributed with analyses tools; conceived and designed analyses. R. Touir: conceived and designed analyses; collected data; contributed with data or analyses tools; conceived and designed analyses; wrote the paper.
Abbreviations
AAS: atomic absorption spectroscopy
Ca-SO4: calcium sulfate
CO₃²⁻: carbonate
Ct: concentration
EC: electrical conductivity
GMWL: global meteoric water line
GW: groundwater
HCO3 -: hydrogencarbonate
HG: hydrogeochemical
IRMS: isoprime precision isotope ratio mass spectrometer
L-D: Laayoune-Dakhla
LMWL: local meteoric water line
MS: mass spectrometry
MW: makeup water (water added to compensate for losses, especially those caused by evaporation)
Na₂CO₃: sodium carbonate
Na-Cl: sodium chloride
NO3 -: nitrate
SI: saturation index
SO4 2- : sulphate
SS: southern Sahara
T: temperature
TDS: total dissolved solids
UV-vis: visible ultra-violet
V-SMOW: Vienna-standard mean ocean water
Symbols definition
‰: per mile
δ2H: deuterium
δ18O: oxygen-18

