




 Inglês (pdf)
 Artigo em XML
 Referências do artigo
 Tradução automática
 Enviar este artigo por email
 Citado por SciELO
  Similares em
SciELO
Similares em
SciELO 
 Permalink
Introduction
Dopamine was classified as the most abundant catecholamine and special neurotransmitter, and plays a critical role in human health related to the central nervous, cardiovascular, renal and hormonal systems 1. In addition, dopamine extends its role to control stress responses, consciousness, information flow and attention span, learning, sleep-wake cycle, motivation, motions and memory formation, i.e., it rules brain-body integration 2-4. A deficiency or rise in dopamine concentration leads to many mental diseases 5. For these reasons, it is necessary to develop a sufficiently sensitive method for dopamine detection in real samples. Since the 1950s, much effort has been made on developing new methods for dopamine determination. Several electrochemical biosensors were tested for dopamine detection using NP and conducting polymers, as recognition elements 6,7.
During recent years, a wide range of metal NP has been widely used for the fabrication of sensors. They have many superb properties like large surface-to-volume ratio, good electrical features, strong adsorption ability, high surface reaction activity, smaller size and good surface characteristics 8. These wonderful properties are helpful for biomolecules immobilization. TiO2 has been used as a model transition metal, due to its simple electronic configuration, with empty conduction and filled valance band 9. Additional application of these molecules as a surface modifier, in electrochemistry 10-12 and sensor technology, 13-16 has increased due to their suitable and useful surface properties for electrodes surface modification. The successful use of NP in sensor technology area is stimulated by the addition of conductor polymers. Among existent conducting polymers, PPY and its derivatives play a leading role, because of their versatile applicability and wide variety of molecular species that are covalently linked to PY groups 17.
As biocompatible polymer, CTS has many properties such as excellent film-forming ability, remarkable biocompatibility, nontoxicity and high mechanical strength 18,19. Besides, since it has many amino and hydroxyl groups, it has been widely used as a modifier.
Recently, due to obvious advantages such as low cost, physical robustness, thermal stability and easy preparation over biological receptors and other functionalized materials, MIP have become a competitive tool in the field of molecular recognition. The mechanism of molecular recognition between target molecule and MIP material comes from the field of immunology, and it was inspired by the recognition between antigen and antibody. The idea originated with Breinl and Haurowitz, and dates back to 1930 20.
The first successful work using imprinted polymeric material was performed in 1973, employing silica particles imprinted with D-glyceric acid and D-mannitol 21.
The principle of this imprinted technique consists in creating a pre-polymerization complex between the monomer function and the target molecule, through Van der Waals or H bonds. A cross linker is used early in the polymerization stage, to form a three-dimensional cross-linked network, in which the target molecule is trapped by interfacial interactions established during the pre-polymerization complex step. After this process, the target molecule is extracted from the matrix, leaving a cavity with spatially oriented functionalities in the cross-linked polymer network 22.
In fact, electrochemistry has often received attention as a means of preparing MIP for developing high performance electrochemical sensors 23-26.
The present study aimed to complete the benefits given by biomolecules immobilization strategy used for biosensors elaboration. In addition, a major advantage was established by analytical and electroanalytical methods applied to the determination of biological and environmental analyses 27. Adopted electrochemical sensitive methods included voltammetric and impedimetric measurements to evaluate the biosensor electrochemical response 25. Additionally, this work endeavored to incorporate the benefits of MIP technique and electrochemical sensors technology. A new MIP electrochemical sensor was developed based on GCE modified with NP from TiO2 and PPY-CTS composite for dopamine detection. The electrodeposition parameters optimization and the MIP sensor characterization were investigated.
Experimental
Chemicals
Commercial nanopowder of TiO2 was obtained from Fluka. PY was purchased from Merck. CTS, H2SO4, CH3COOH, Glu, dopamine, AA and UA were supplied by Sigma Aldrich, and used as-received. PBS with various pH values was prepared using K2HPO4 and KH2PO4 obtained from Merck. K4(Fe(CN)6 and K3(Fe(CN)6) were purchased from Fluka chemika. Ultra-pure water was used for the solutions preparation and modified electrode rinsing.
Apparatus and instruments
Electrochemical experiments were carried out with a three-electrode system consisting of: GCE (3 mm diameter), Pt wire and Ag/AgCl (3 M KCl) as working, auxiliary and reference electrodes, respectively. CV and DPV were carried out using an Autolab PGSTAT 320 N potentiostat equipped by Nova version 1.5 software. All electrochemistry experiments were performed at room temperature. The solutions pH were measured with a pH meter (3505 JENWAY).
The morphology of the different matrices deposited on the carbon screen printed electrode surface was characterized using JEOL JSM 7100F SEM. Spectrum data were collected with FTIR spectroscopy, using a Perkin Elmer 1600 FTIR spectrometer. UV-vis measurements were recorded by 67 spectrophotometer models 6705 UV-vis JENWAY, after the deposited layers redissolution in a DMF/water mixture.
Preparation of the modified working electrode
Prior to use, GCE was polished with 0.30 and 0.05 mm alumina powder, employing a polishing cloth, rinsed with water, and then ultrasonicated in ethanol and distilled water, for five min, to remove adsorbed alumina particles on its surface. Afterwards, the polished GCE was electrochemically cleaned by cycling the potential scan from -0.2 to 1 V, in 0.5 mol/L-1 H2SO4, until a stable CV was obtained.
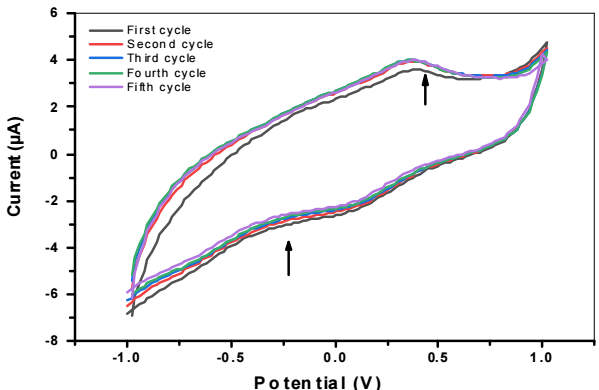
Finally, the GCE surface was dried under a stream of high purity nitrogen, for further use. The modification process consisted in the electrodeposition of a fresh TiO2 aqueous solution (5.10-3 mol/L-1) on the GCE, using CV from -1 V to 1 V, for 5 cycles, at a scan rate of 50 mV/s. Then, the electrode was rinsed with distilled water and dried in air.
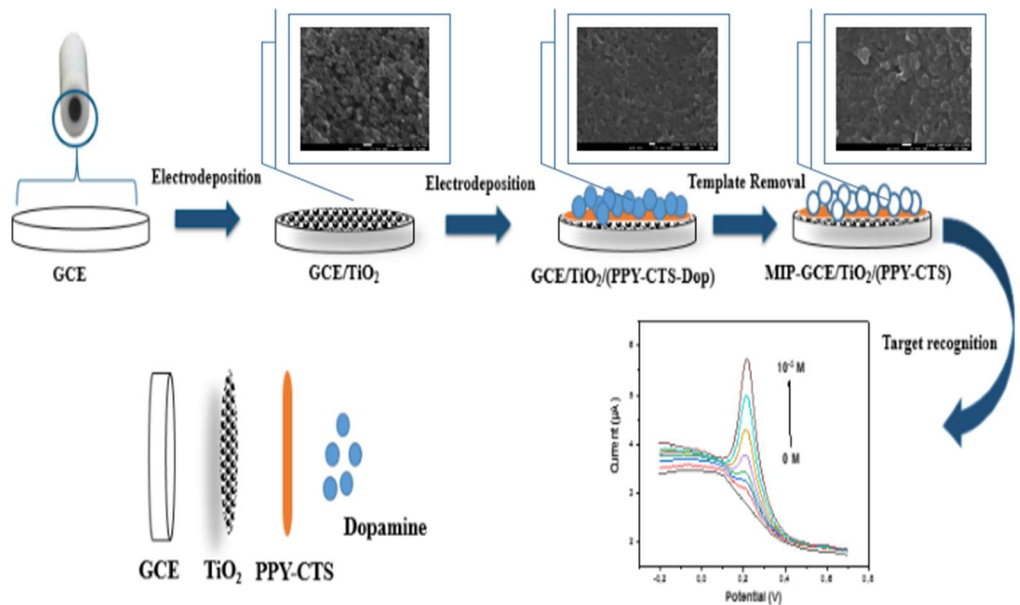
After the solution was deoxygenated by bubbling nitrogen gas, for 20 min, the MIP was built by electropolymerization of 5.10-3 mol/L-1 PY and 1 mg/mL CTS in 0.1 mol/L-1 CH3COOH as SE, with 10-3 mol/L-1 dopamine as template on the modified GCE/TiO2 electrode, using CV, in the potential range from -1 to 1 V, for 10 cycles, at a scan rate of 50 mV/s.
The recognition sites in the MIP film were formed after the template removal from the membrane. Dopamine extraction was conducted by CV in 0.1 mol/L-1 PBS (pH 7). The NIP-modified electrode was also prepared under the same protocol, but without adding dopamine. Every imprinting and elution procedure are illustrated in Fig. 1.
Results and discussion
Preparation of the GCE/TiO 2 modified electrode
Fig. 2 illustrates electrodeposition of the TiO2 layer on the GCE surface by CV, in the potential range from -1 to 1 V, for 5 cycles, at a scan rate of 50 mV/s. As a result, the initial oxidation-reduction cycle shows a large and irreversible anode wave with a potential peak at 0.35 V, revealing the onset of TiO2 oxidation on the GCE surface. This peak increased until stabilization, which explains the fixation of the TiO2 deposit layer on the working electrode surface.
Electrodeposition of MIP PPY-CTS
During the polymerization process, it was seen that the oxidation peak of PPY-CTS was at 0.5 V. Hence, the reduction peak was at -0.1 V. The decrease in the oxidation peak was due to the deposition of the conducting PPY-CTS layer on the GCE/TiO2 surface. The reduction peak is assigned to the polymer degradation 28. For the MIP structure, dopamine template molecules had a major effect on the electroactivity of the deposit sensitive layer. The absence of an oxidation peak corresponding to the dopamine template during the formation of the MIP from PPY-CTS demonstrates the efficient blocking of dopamine electrooxidation by this barrier film. The polymer film development and growth is shown in Fig. 3.
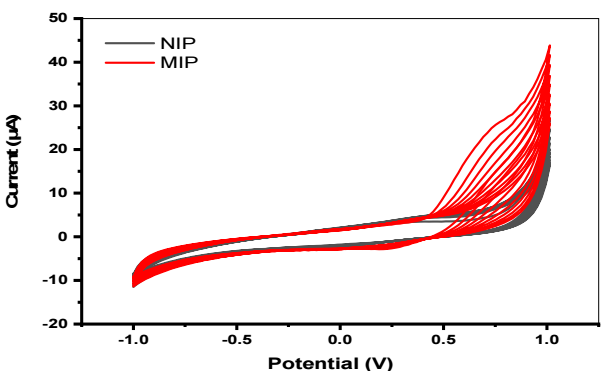
Figure 3: Electrodeposition of PPY-CTS at GCE/TiO2 by CV, at scan rate of 50 mV/s, using CH3COOH as SE, containing: (black) 5.10-3 M PY + 1 mg/mL CTS; and (red) 5.10-3 M PY + 1 mg/mL CTS + 10-3 M dopamine.
The film oxidation revealed that dopamine was hosted by the polymer 29. Dopamine molecules, which are in the vicinity of the electrode surface, get trapped in the polymer matrix, during the electropolymerization process, due to their ability to interact favorably with the PPY units. This behaviour was confirmed by the increase in oxidation and reduction peaks intensity, when adding dopamine, which made the PPY-CTS film with dopamine grow faster than the one without it.
Factors influencing MIP electrode performance
Different influencing factors, such as monomer, SE and template concentrations, pH medium, scan cycles of electropolymerization process and incubation time were optimized to make up an efficient sensor. The effect of the cited factors on the MIP dopamine sensor electrochemical performance was investigated by DPV.
Influence of monomer concentration
The influence of monomer concentration during electropolymerization is very important to sensors properties for dopamine detection. To determine the influence of PY concentration on the response of MIP modified electrodes, the films were prepared using a constant dopamine concentration (1 mM), and various PY amounts in the range from 1 to 100 mM.
As illustrated in Fig. 4A, the sensor responses increased with higher PY concentrations up to 5 mM in the solution mixture, and subsequently decreased. High monomer concentrations may result in a rapid polymerization process, improving the sensor sensitivity. However, too elevated monomer concentrations might lead to the formation of a thick membrane that makes some of the recognition sites not to be easily accessible 30. So, the present work chose 5 mM as optimum monomer concentration.
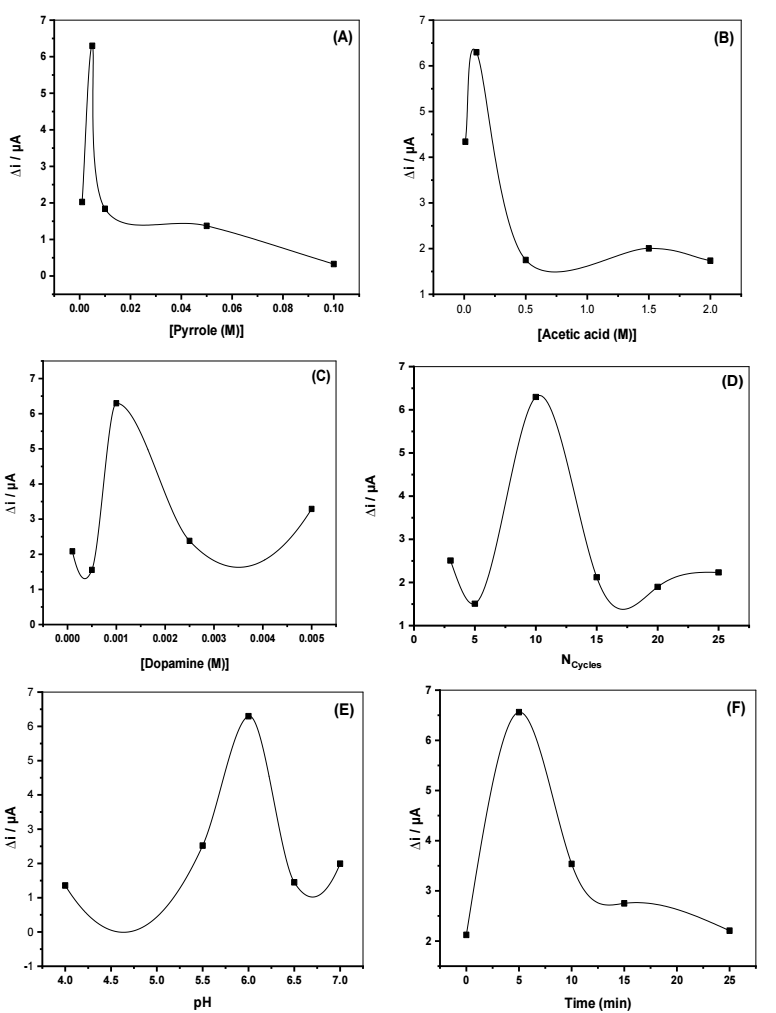
Figure 4: Influence of different parameters on the electrocatalytic oxidation of dopamine in 0.1 mol/L PBS (pH = 6) solution. (A) PY concentration, (B) CH3COOH concentration, (C) dopamine concentration, (D) electropolymerization cycle, (E) pH value, (F) incubation time.
Influence of the SE concentration
One of the important factors that affect MIP efficiency is SE concentration. This was studied under constant concentrations of CTS (1 mg/mL), dopamine (1 mM), PY (5 mM), and various CH3COOH amounts, via CV measurements. The MIP sensor response increased with SE concentrations up to 100 Mm, and then decreased (Fig. 4B). According to this result, 0.1 M was chosen as optimum SE concentration during all measurements.
Influence of template concentration
The quantity and ability of MIP recognition sites depend primarily on the mechanism and degree of interactions between monomer concentration and template amount in prepolymerization mixture 31. Fig. 4C displays the influence of template concentration on electrodeposition of MIP layer. It is clearly seen that maximum peak current was observed when template concentration was about 1 mM. Therefore, this template concentration was selected to achieve polymerization step.
Influence of scan cycles during electropolymerization process
Electropolymerization scan cycles are one of the important factors for the formation of a successful MIP layer 32,33, which can influence the thickness and compactness of the film. Fig. 4D shows the optimum number of scan cycles required to deposit a MIP onto the GCE, which possessed maximum current response during polymerization process. The modified electrode performances were evaluated in a 1 mM dopamine solution in PBS (pH = 6), at several MIP modified electrodes prepared by applying different numbers of voltammetric cycles in the pre-polymerization. The suitable number of electropolymeriztion cycles was estimated to be 10.
Influence of pH detection solution
The pH of the working solution can influence electrochemical performances of MIP-GCE/TiO2/(PPY-CTS) sensor towards dopamine molecules detection. MIP response was tested in pH range from 4 to 7 (Fig. 4E). DPV responses of the sensor in contact with 1 mM dopamine, after 5 min, in PBS, revealed that the highest electrode response was at pH 6.
Influence of incubation time
After removing the template in the PBS solution (pH 7), MIP electrode was immersed in 1 mM of dopamine dissolved in 1 mM PBS (pH 6), for different incubation times. After each immersion, current response was measured by DPV method. As a result, 5 min was estimated as the optimum incubation time that led to maximum current. In fact, during this optimum time, the highest number of binding interactions can be established between MIP sites and dopamine molecules (Fig. 4F).
Effect of scan rate
Scan rate effect on voltammetric response current was studied for 1 mM dopamine in 0.1 mol/L-1 PBS (pH 6). Fig. 5A presents the background subtracted voltammograms recorded under different scan rate values from 10 to 250 mV/s. Fig. 5B shows the linear relation between Ip and v1/2.
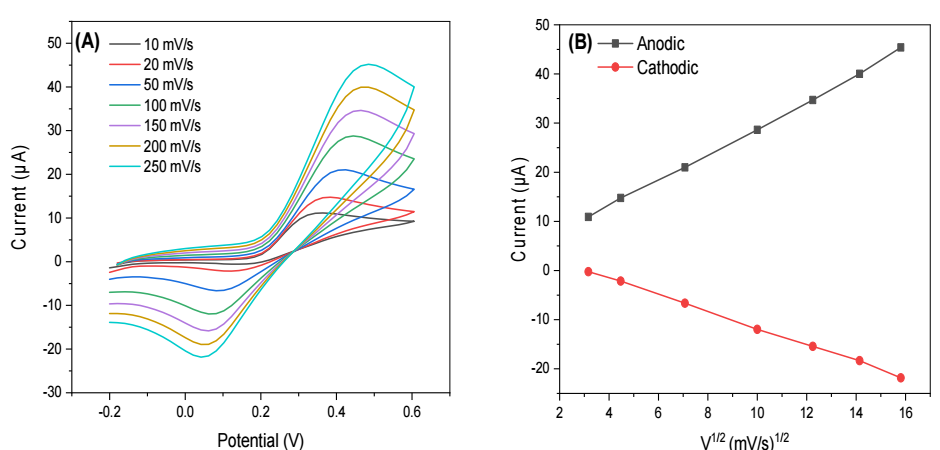
Figure 5: (A) CV obtained for MIP at different scan rates from 10 to 250 mV/s, in 1 mM dopamine; (B) Plot of peak current versus square root of scan rate, in 1 mM dopamine.
Peak response increased linearly with an increase in square root of scan rate (v1/2), in the range from 10 to 250 mV/s, according to the equation 1:
 (1)
(1)where it occurs a diffusion controlled process 34. D diffusion coefficient was calculated using Randles-Sevcik equation 2.
 (2)
(2)where Ip is peak current, n is electron transfer number (2), D (cm2/s-1) is diffusion coefficient, C is dopamine bulk concentration (10−6 mol/cm3), A is electrochemical active electrode area (A = 0.070 cm2) and v is scan rate (mV/s-1). With the slope and other required values, 2.10-8 cm2/s-1 D was obtained, in good agreement with literature data 35.
Surface morphology of the prepared materials
The morphology of the modified electrodes was examined by SEM, after verifying the homogeneity and adhesion of the deposit membrane. Fig. 6A shows the surface morphology of the TiO2 deposit layer, characterized by spherical spongy module shaped particles, homogeneously distributed with aggregation 36.
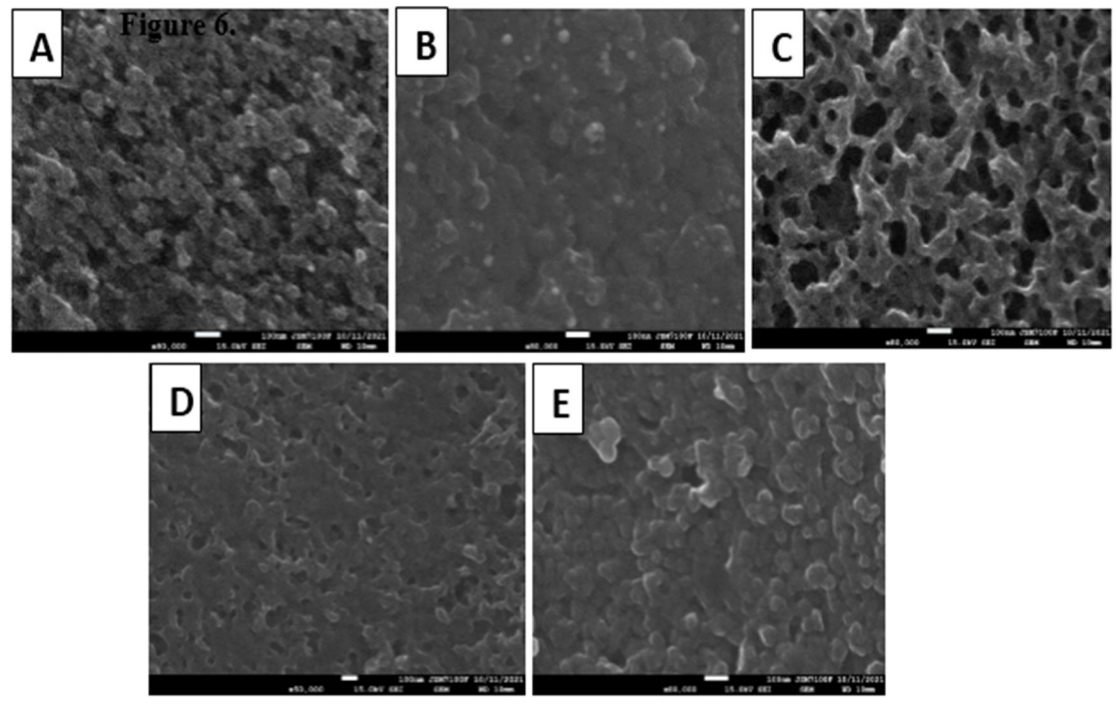
Figure 6: SEM images of: (A) GCE/TiO2; (B) GCE/TiO2/PPY-CTS; (C) NIP-GCE/TiO2/PPY-CTS; (D) GCE/TiO2/PPY-CTS/dopamine; (E) MIP-GCE/TiO2/PPY-CTS. Resolution of 100 nM, magnification of 80.000 and accelerating potential of 15.0 kV were used.
After modification of the GCE/TiO2 surface with PPY-CTS nanocomposite, a compact, uniform and homogeneous structure was observed (Fig. 6B). With SEM, it is hard to see the difference in morphology between GCE/TiO2/PPY-CTS (B) and GCE/TiO2/PPY-CTS/dopamine (Fig. 6D) sensors, because the surface of the film formed is in the order of few nanometers.
Compared with NIP-GCE/TiO2/PPY-CTS (Fig. 6C) sensor, MIP-GCE/TiO2/PPY-CTS (Fig. 6E) one has a rougher surface, with several large pores. This behavior may be due to the template removal process, which only the MIP surface went through, resulting in considerable recognition sites for target dopamine interaction. In addition, the rough surface structure supports mass transfer and the formation of three-dimensional recognition sites.
FTIR and UV-visible studies
Fig. 7A presents FTIR spectra of dopamine powder, NIP-GCE/TiO2/(PPY-CTS) and MIP-GCE/TiO2/(PPY-CTS) deposit layers. The bands observed in FTIR spectra of dopamine powder were at 3342 cm-1 (amine N−H stretching), 3207 cm-1 (phenol O−H stretching), 2972 cm-1 (aromatic C−H stretching), 2895 cm-1 (alkyl C−H stretching), 1610 cm-1 (amine N−H bending), 1496 cm-1 (aromatic C=C stretching), 1248 cm-1 (amine C−N stretching) and 1177 cm−1 (phenol C−O stretching) 37-39.
FTIR spectra of the NIP-GCE/TiO2/PPY-CTS and MIP-GCE/TiO2/PPY-CTS modified surfaces were similar to each other in terms of patterns, and they both had some new peaks when compared with dopamine only. The main difference between the FTIR spectra from MIP and NIP sensors is the increase in bands, which can be attributed to the template extraction.
FTIR results for NIP-GCE/TiO2/PPY-CTS and MIP-GCE/TiO2/PPY-CTS sensors showed peaks at 3396 cm-1, which may be due to N-H stretching of PPY and CTS. The peak at 2961 cm-1 may correspond to C-H stretching of PPY and CTS. The small peak at 2120 cm-1 stretching of PPY-CTS may be assigned to O-H vibration stretching of CTS.
Furthermore, CTS incorporation into PPY backbone is evident by the new band formed at 1655 cm-1. This band could be due to C=O stretching vibrations of CTS. This band was clearly absent in dopamine FTIR spectrum. Also, the band at 1438 cm-1 in both spectra may be attributed to C=C vibration stretching of PPY and CTS. The band at 1385 cm-1 is due to N-H angular deformation couplings, while bands at 1249 cm-1 and 1100 cm-1 were ascribed to stretching vibrations of glycosidic bond C-O-C linkage 40-43. The band centered at 656 cm-1 is assigned to metal-O bonds Ti-O of TiO2 44, 45. FTIR spectra of the deposit showed characteristic matrix bands that indicated the formation of a composite material.
UV-vis spectra of TiO2, TiO2/(PPY-CTS), NIP/TiO2/(PPY-CTS), MIP/TiO2/(PPY-CTS) and TiO2/(PPY-CTS-dopamine) were displayed in Fig. 7B. A mixture of DMF and ultrapure water was used as reference solution. UV-visible absorption spectra of GCE/TiO2/(PPY-CTS) show three absorption bands at 472, 513 and 704 nm. The first absorption band was assigned to п-п* transition, and the second band to the formation of composite PPY-CTS. The third band was attributed to the film oxidation. After dopamine addition to the composite matrix, the second band intensity, at 513 nm, decreased, which was due to the template adsorption on the electrode surface. After dopamine extraction, the band at 472 nm disappeared, and the absorption peak of the composite PPY-CTS has moved, which confirmed the formation of artificial cavities to recognize dopamine molecules.
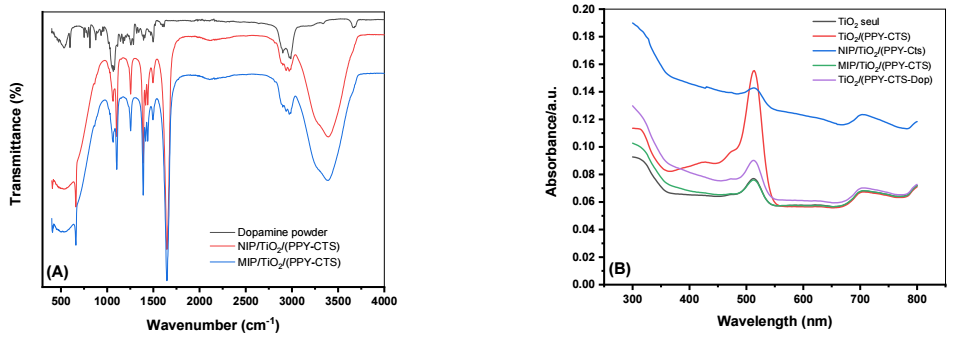
Figure 7: (A) FTIR spectra of dopamine powder, NIP-GCE/TiO2/(PPY-CTS) and MIP-GCE/TiO2/(PPY-CTS); (B) UV-vis absorption spectra of TiO2, TiO2/(PPY-CTS), NIP/TiO2/(PPY-CTS), MIP/TiO2/(PPY-CTS) and TiO2/(PPY-CTS-dopamine).
Electrochemical characterization by using CV measurements
CV is a suitable and effective way for visualizing the current peak of the analytes in electrochemical detection 46. In this work, it was also used to characterize electrodes modification process. CV results of the electrochemical sensor were recorded in a 1 mmol/L-1/K3Fe(CN)6 aqueous solution containing 0.1 mol/L-1 KCl, as shown in Fig. 8.
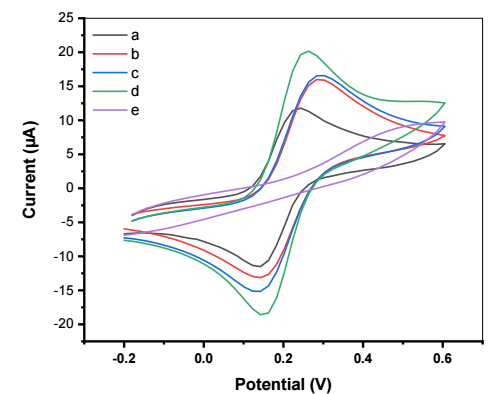
Figure 8: CV obtained for: (a) bare GCE; (b) GCE/TiO2; (c) GCE/TiO2/(PPY-CTS); (d) GCE/TiO2/(PPY-CTS-dopamine); and (e) MIP-GCE/TiO2/(PPY-CTS), in 1 mM K3Fe(CN)6/K4Fe(CN)6 containing 0.1 M KCl, at a SR of 50 mV/s.
Fe(CN)6 3−/Fe(CN)6 4− redox couple was chosen as an electro-active probe to investigate its rate of electron mobility 47,48. From the CV, Fig. 8 shows that bare GCE gave well-resolved redox peaks, at 0.234 and 0.141 V, respectively, which are typical of a quasi-reversible CV. As seen in curve b, the current signal increased greatly. This result was due to the NP, which increased the active surface area and improved current response of the modified electrode.
After the electrodeposition of PPY-CTS-dopamine, anodic peak and cathodic peak currents were higher (Curve c) than those of the bare GCE and GCE/TiO2, which implies that the composite can greatly enhance the effective electrode surface area. This increase in current may be due to the affinity of positively charged CTS with the negative charge of Fe(CN)6 3−/Fe(CN)6 4−49.
ΔEp of GCE/TiO2/(PPY-CTS-dopamine) modified electrode was 0.110 V, as against 0.148 V, for bare GCE/TiO2. This low ΔEp indicates a faster and better electron transfer process in PPY-CTS-dopamine modified GCE 50.
However, after dopamine template extraction, electroactive probe redox peaks at the MIP-GCE/TiO2/PPY-CTS surface were absent. This phenomenon shows that dopamine MIP film was successfully prepared.
Electrochemical sensing of dopamine at the MIP modified electrode
Electrochemical responses of bare GCE, GCE/TiO2, NIP-GCE/TiO2/(PPY-CTS), and MIP-GCE/TiO2/(PPY-CTS) modified electrodes towards dopamine recognition were investigated using CV in 0.1 M PBS with pH 6, after 5min incubation time (Fig. 9).
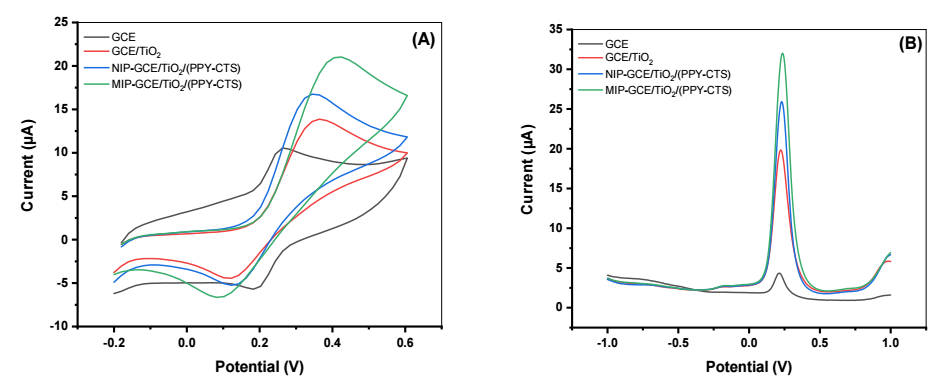
Figure 9: (A) CV and (B) DPV spectra performed on GCE electrodes modified with 1 mM dopamine in a PBS (0.1 mol/L, pH 6) solution.
The bare GCE shows a significantly low oxidation peak at 0.25 V, compared to NIP-GCE/TiO2/PPY-CTS and MIP-GCE/TiO2/PPY-CTS, which gave a well-resolved oxidation peak, at 0.33 and 0.41 V, respectively, in PBS containing dopamine. DPV responses also showed clearly that MIP-GCE/TiO2/PPY-CTS modified electrode presents a high recognition performance in dopamine presence.
The high affinity of MIP-GCE/TiO2/PPY-CTS film with dopamine was due to: hydrophobic interaction between MIP-GCE/TiO2/PPY-CTS film and dopamine (the aromatic part of dopamine molecules is hydrophobic in nature) 51; acceleration of dopamine diffusion through the porous structure of MIP-GCE/TiO2/PPY-CTS film; and MIP mechanism operating within the film 52.
The imprinted cavities in the film and the functional groups on the cavities produced by dopamine molecule template on the modified electrode displayed much higher binding properties with dopamine than with the NIP electrode.
Extraction of dopamine molecules
In this work, the extraction of dopamine from the composite matrix was obtained by CV from -0.2 to 1 V, in 0.1 mol/L PBS, at pH 7. This process was repeated for several cycles, until all dopamine molecules were extracted from MIP material 53. Recorded CV are shown in Fig. 10, indicating that peak current decreased with more scans, and then it gradually tended nearly zero, which demonstrated the template molecules complete removal.
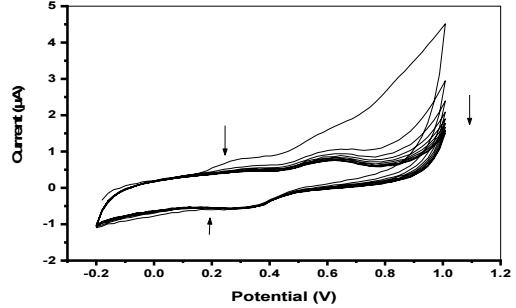
Figure 10: Extraction of dopamine template (10 scans) in 0.1 mol/L PBS (pH 7) solution, at a scan rate of 20 mV/s.
Performance of the modified electrode for dopamine detection
Typical DPV was employed to detect dopamine. Fig. 11A shows DPV curves of dopamine at MIP modified electrode recorded for various dopamine concentrations in a PBS (pH 6), with an incubation time of 5 min.
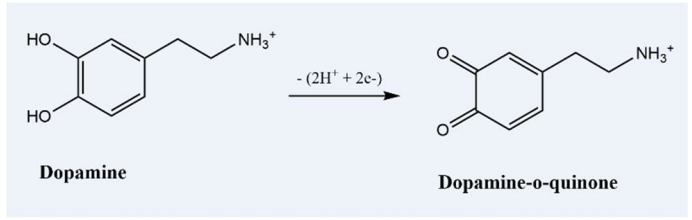
As it can be seen, dopamine anodic current increased with its higher concentrations. A well-resolved peak at 0.21 V was assigned to dopamine oxidation. When an adequate potential is applied to MIP electrode, it appears that dopamine electroanalytical behavior follows by exchanging two electrons and two protons, leading to dopamine-o-quinone.
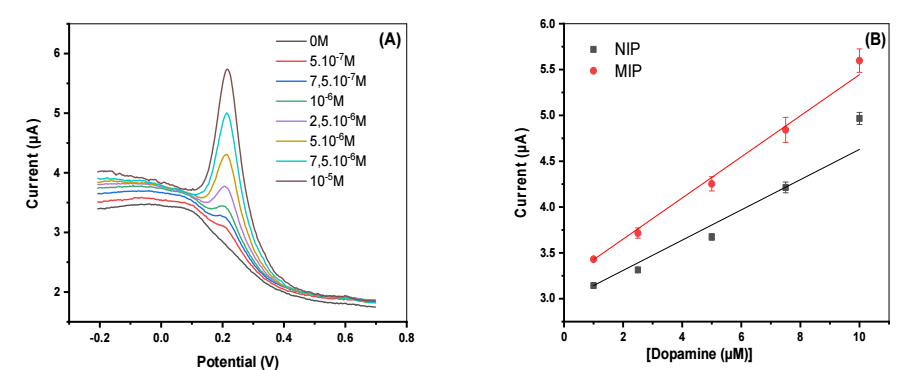
Figure 11: (A) DPV obtained for MIP film with dopamine various concentrations in a PBS (pH 6). DPV parameters were: step E: 0.004V; modulation amplitude: 0.05 V; modulation time: 0.05 s; interval time: 0.2 s. (B) Plot of peak oxidation current vs. dopamine concentration of MIP and NIP. Average of three measurements (mean ± SD).
Dopamine electrochemical oxidation mechanism on the modified MIP electrode is given by the following reaction (Scheme 2):
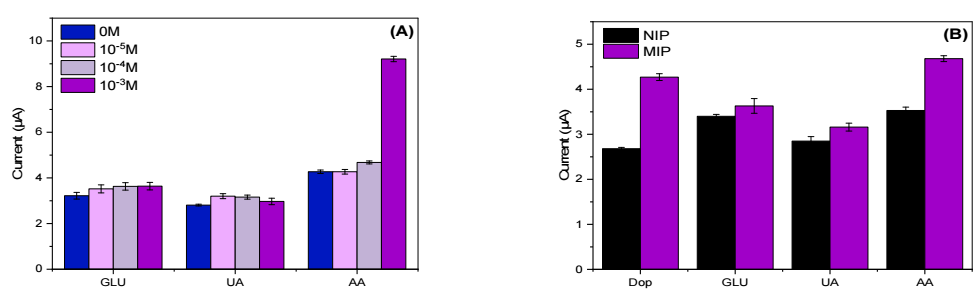
Fig. 11B illustrates that calibration curve has a linear relation between Ip and dopamine concentration in the range from 10-6 to 10-5 M, with a correlation coefficient of 0.991. Additionally, the electrode sensitivity for dopamine detection is 3.202.10-6 μA/μM-1/cm-2.
Based on IUPAC definition 54, LOD was calculated as eq 3:
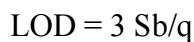 (3)
(3)where Sb is standard deviation of the blank analyte and q is the slope of calibration plot. Hence, LOD of GCE modified in the optimum fabrication condition was estimated to be 0.281 μM.
Analytical parameters, such as linear response range, sensitivity and LOD, were compared with literature data, and are given in Table 1. Thus, results showed higher sensitivity and lower LOD than those from other electrochemical sensors used for dopamine determination.
Table 1: Comparison of various modified electrodes for dopamine detection.
| References | LOD (mol/L-1) | Linearity (mo/L-1) | Method | Modified electrode |
|---|---|---|---|---|
| 57 | 9×10⁻⁷ | 2×10⁻⁶ -2.3×10⁻⁴ | DPV | 3DOM-MIPs/GCE |
| 58 | 1.04×10⁻⁶ | 5×10⁻⁶ -5×10⁻⁵ | SWV | Au/OPPy-DA |
| 59 | 7.97×10⁻⁶ | 1×10⁻⁵ -1×10⁻⁴ | DPV | PPy/DA-MIP |
| 60 | 5×10⁻⁷ | 2×10⁻⁶ -1.6×10⁻⁴ | DPV | OPPy/ERGO/GCE |
| 61 | 1.5×10⁻⁶ | 1.0×10⁻² - 2.0×10⁻² | VC | Nanostructured conducting polymer |
| This work | 2.81×10⁻⁷ | 1×10⁻⁶ - 1×10⁻⁵ | DPV | MIP-GCE/TiO2/(PPY-CTS) |
Selectivity study of MIP-dopamine sensor
MIP-GCE/TiO2/(PPY-CTS) and NIP-GCE/TiO2/PPY-CTS modified electrodes DPV responses were recorded in PBS solutions with 10-5 mol L-1 dopamine and 10-4 mol L-1 of each interferent, separately. Fig. 12B shows electrochemical results of MIP and NIP electrodes given as a histogram graph. It can be clearly seen that MIP electrode interacted with dopamine more selectively than other analogue interferent species. This further confirmed the outstanding specificity of MIP towards dopamine template molecule, which was mainly due to the specific binding between it and the tailor made imprinted cavities.
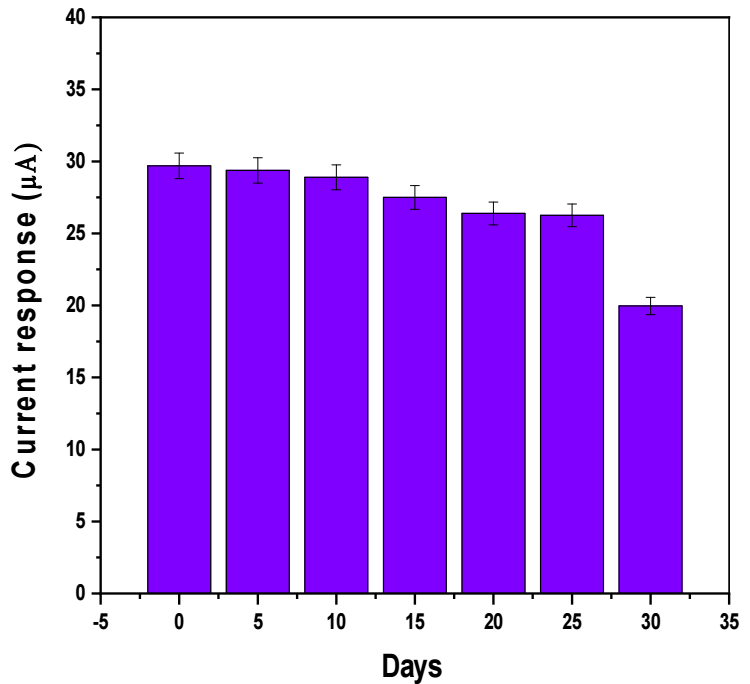
Figure 12: (A) Effect of interfering species Glu, UA and AA on the current response of MIP sensor in presence of 10-5 M dopamine. (B) Anodic current peak value offered by MIP sensor in purple and NIP sensor in black for the detection of dopamine 10−5 M with different interfering substances in 10−4 M prepared in a PBS (0.1 M, pH 6) solution. Error bars indicate SD from three measurements.
Repeatability, reproducibility and stability of MIP-dopamine sensor
The fabricated MIP dopamine sensor was assessed for stability, in terms of repeatability, reproducibility and response time. To study the repeatability, 1 mM dopamine solution was analyzed for four times using MIP-GCE/TiO2/PPY-CTS sensor under optimized conditions, employing DPV technique. RSD of the peak current intensities was about 2.4%, which indicates good repeatability.
To study reproducibility, four MIP-GCE/TiO2/PPY-CTS sensors were fabricated under identical conditions, and their peak current intensity showed a RSD of 4%, indicating excellent reproducibility of the fabrication method.
MIP-GCE/TiO2/PPY-CTS sensors were stored at room temperature, and the storage stability was evaluated for 1 month. During the first week, the sensor response to dopamine remained stable without any significant disruption. After 30 days, the sensor maintained about 89% of its initial current response, indicating that the prepared electrode had excellent long-term stability (Fig. 13).
Dopamine detection in real urine sample
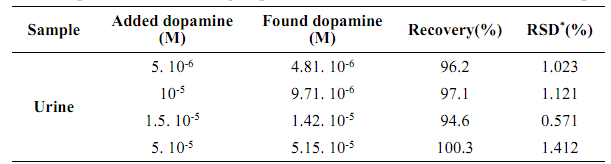
In order to evaluate the applicability and feasibility of the prepared electrochemical sensor, a standard addition method was used to determine dopamine concentration in real urine samples from healthy individuals. The urine samples were diluted by 100-folds with a 0.1 M PBS (Ph 6), to overcome the effect of urine matrix interferences 56. Initially, no dopamine was detected. Thereafter, successive dopamine additions were performed, and recovery percentages were calculated based on its determined concentrations. Table 2 shows very good recovery (between 93.3 and 116%) and reasonable RSD (less than 2%), indicating a hopeful applicability, with a good reliability of the prepared sensor for the measurements of trace dopamine in real samples analyses.
Conclusion
The developed MIP-GCE/TiO2/PPY-CTS sensor was successfully applied for detecting dopamine. The electrochemical MIP electrode was elaborated by electropolymerization of PPY-CTS composite onto the GCE/TiO2 matrix, in the presence of dopamine as template molecule. Under optimum conditions, this sensor showed a rapid current response, wide linear range from 1×10⁻⁶ to 1×10⁻⁵ mol L-1, low LOD of 2.81×10⁻⁷ mol/L-1, high sensitivity and selectivity, good reproducibility and excellent stability for dopamine determination. It was shown that incorporating NP from TiO2 in the sensitive matrix enhanced electroactivity and sensitivity for dopamine detection. As a result, this modified electrode was successful applied for monitoring dopamine in a real medium. The MIP sensor showed good dopamine recovery in urine samples. Hence, the simple and efficient strategy reported in this research can be further employed to fabricate MIP based electrochemical sensors for other target neurotransmitters recognition.
Acknowledgements
Authors would like to acknowledge the PRF-2017-D4P1/Tunisia project (No. 12Mag088) and the Ministry of Higher Education and Scientific Research of Tunisia (LR11ES55). The authors thank Dr. Florence GENESTE for his assistance for the SEM measurements.
Authors’ contributions
Houcine Barhoumi: conceptualization and validation, review and editing. Nicole Jaffrezic Renault: conceptualization and validation; review and editing. Chama Mabrouk: writing. All authors have read and agreed to the published version of the manuscript.
Abbreviations
AA: ascorbic acid
CH3COOH: acetic acid
CTS: chitosan
CV: cyclic voltammetry
DMF: N,N-dimethylformamide
DPV: differential pulse voltammetry
FTIR: Fourier transform infrared spectroscopy
GCE: glassy carbon electrode
Glu: glucose
H2SO4: sulfuric acid
IUPAC: International Union of Pure and Applied Chemistry
K2HPO4: dipotassium hydrogen phosphate
K3(Fe(CN)6: ferrocyanide
K4(Fe(CN)6: ferricyanide
KH2PO4: potassium dihydrogen phosphate
LOD: limit of detection
MIP: molecular imprinted
NIP: non-imprinted polymer
NP: nanoparticle
PBS: phosphat buffer solution
PPY: polypyrrole
PY: pyrrole
Redox: reduction/oxidation reactions
RSD: relative standard deviation
SD: standard deviation
SE: supporting electrolyte
SEM: scanning electron microscopy
UA: uric acid
UV-vis: visible ultraviolet
Symbols definition
ΔEp: peak-to-peak separation potential

