


 Inglês (pdf)
 Artigo em XML
 Referências do artigo
 Enviar este artigo por email
 Citado por SciELO
  Similares em
SciELO
Similares em
SciELO 
 Permalink
Introduction
Iron is a transition metal with the symbol Fe and atomic number 26. It is the most common element on Earth. Fe is a necessary component involved in various metabolic processes, including O transport, DNA synthesis, and energy production for electrons transport 1. An insufficient supply of Fe to cells caused by a lack of its reserves is the most common nutritional deficiency worldwide, particularly affecting children, childbearing age and pregnant women 2. Fe deficiency may cause the development of anemia, and result in functional impairments affecting cognitive development and immunity mechanisms, as well as infant or maternal mortality, if it occurs during pregnancy 1. The main therapeutic preparation of Fe is FeSO4, and Fe-sucrose may also be given intravenously 3. Fe exists in two oxidation states: Fe (II) and Fe (III). NHFe in food is mainly in Fe (III) state, which is its insoluble form and must be reduced to Fe (II) for absorption 3. When Fe (III) is converted to soluble Fe (II), it primarily exists in the circulation in complex forms bound to proteins (hemoprotein) as heme compounds (hemoglobin or myoglobin), heme enzymes, or NH compounds (flavin-Fe enzymes, transferring and ferritin) 1. Once converted, Fe (II) serves to support various biological functions. Fe promotes the synthesis of O transport proteins, such as myoglobin and hemoglobin, and the formation of heme enzymes and other Fe-containing enzymes involved in electron transfer and redox reactions 1. It also acts as a cofactor in many NH enzymes, including hydroxylases and ribonucleotide reductase 2. Fe-containing proteins are responsible for mediating antioxidant actions, energy metabolism, O sensing actions and DNA replication and repair 2. Saturation of transferrin from high concentrations of unstable Fe preparations may elevate the levels of weakly transferrin-bound Fe (III), which can induce oxidative stress by catalyzing lipid peroxidation and reactive O species formation 4,5. Fe is incorporated into various proteins to serve biological functions as a structural component or cofactor. Once Fe (III) or Fe (II) cations from intestinal enterocytes or reticuloendothelial macrophages are bound to circulating transferrin, Fe-transferrin complex binds to the cell-surface transferrin receptor (TfR) 1, resulting in endocytosis and uptake of metal cargo. Internalized Fe is transported to the mitochondria for the synthesis of heme or Fe-S clusters, which are integral parts of several metalloproteins. Excess Fe is stored and detoxified in cytosolic ferritin 1. Internalized Fe (II) is exported across the basolateral membrane into the bloodstream via Fe (II) ferroportin transporter, which is coupled by reoxidation to Fe (III) through membrane-bound ferroxidase hephaestin or ceruloplasmin activity 1. Fe (III) is again scavenged by transferrin, which maintains Fe (III) in a redox-inert state and delivers it into tissues 1. Fe (III) participates in the autoxidation reaction, where it can be chelated by DNA. It mainly binds to the backbone phosphate group, whereas at higher metal ions contents, the cation also binds to guanine N-7 atom 6. Fe absorption and systemic Fe homeostasis are regulated by hepcidin, which is a peptide hormone that also regulates ferroportin-1 activity, which is the sole Fe-efflux protein 7. Fe is mostly absorbed in the duodenum and upper jejunum 8,9. Fe (III) displays low solubility at the intestine neutral pH, and is mainly converted to Fe (II) by Fe (III) reductases 10, as Fe (III) salts are only half as well adsorbed as Fe (II) salts 11.
It has been proposed that there may be separate cellular uptake pathways for Fe (II) and Fe (III) Fe. While Fe (II) is primarily carried by divalent metal transporter-1 (DMAT-1), cellular uptake of Fe (III) is predominantly mediated by beta-3 integrin and mobilferrin, which is also referred to in some sources as a calreticulin homologue 4. However, the most dominant pathway in humans is unclear 4.
CvV and DV are commonly applied methods to observe Eo behavior, by measuring the current generated from electrons transfer between an electrode and an electrolyte solution, as a function of changes in potential. The experiment employed a cell equipped with reference, working and auxiliary electrodes 12-17. CvV is frequently used in applied electrochemistry, analytical electrochemistry and surface coating 12,13), (16-18. In contrast, there is a lack of information regarding its application in food and health fields. Previous work examined Fe (II) and Fe (III) ions redox properties upon nicotine addition, and its correlation with neurodegenerative disease 16. Nicotine ability to form a complex reaction with free Fe was proved by the change from reversible to quasi-reversible performances, as well as by the reduced rate of electrons transfer and apparent ks; thus, Fe reactivity was successfully reduced 16. Another study investigated flavonoids structure antioxidant activity towards different free radicals by FRAP, with a slight modification using 96-well microplates 17. Their oxidation potentials were analyzed by CV, and found to be in good agreement with FRAP results 17. Semi integral electroanalysis, which is considered a good tool for elucidating the nature of electrodes reaction, was used to investigate the electrochemical behavior of some electroactive species and determine their kinetic parameters 19-21.
The aim of the present study was to investigate the likelihood of Fe (III) reduction by CV and DV electrochemical methods combined with numerical simulation.
Experimental
Chemical compounds
From Aldrich Chemical Co., FeCl3 and KNO3 were purchased and used as bought. All chemicals were of spectral purity.
Instrumentation
CV and DV experiments were carried out utilizing the Computerized Potentiostat Model 283 and PAR Model 175 Universal System Programmer (from EG and G). Experiments were performed via an ordinary three-electrode electrochemical cell adjustment. The active Au working electrode area was 6.75 × 10⁻³/cm2. Pt wire and Ag/AgCl were used as counter and standard electrodes, respectively. Voltage was determined vs. Ag/AgCl electrode, at 25 ºC, with 1 mol/L HCl as supporting electrolyte. CV data were achieved at SR values ranging from 0.01 to 2 V/s-1, at 25±0.5 ºC.
Numerical simulation
Computer-generation of theoretical CV is a good way to elucidate simple and complex electrode pathways, confirm and verify the nature of electrochemical reactions, and also to inspect i-E curves for many types of electrode reactions with different electrons transfer rates 22-23. EG and G Condesim software package were used to generate theoretical CV via virtual simulation on a PC computer. The simulation process was done employing finite difference techniques.
Results and discussion
CV of a Pt electrode in 1.0 M HCl + 0.01 M FeCl3, at a SR of 0.05 V/s-1 and 25 ºC (Fig. 1), shows a cathodic peak (Epc), at 0.38 V, which is coupled with an anodic peak (Epa), at 0.51 V.
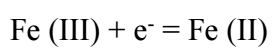
The cathodic peak corresponds to Fe (III) cation reduction on the Au electrode:
Fe (III) + e- = Fe (II)
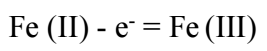
The anodic coupled peak corresponds to formed Fe(II) cations oxidation:
Fe (II) - e- = Fe (III)
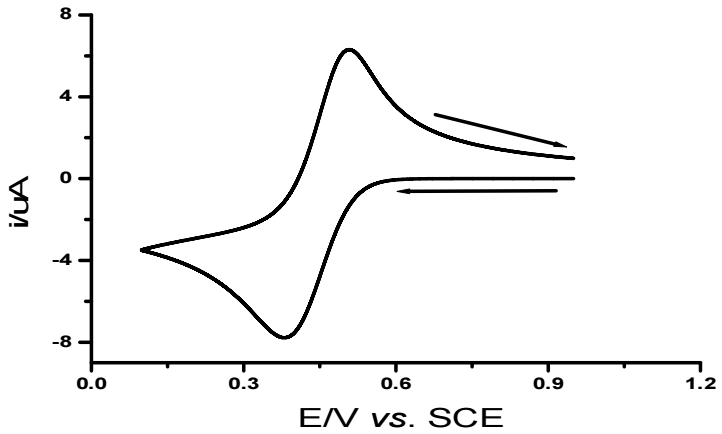
Fig. 2 indicates CV of the investigated system at various Au electrodes.
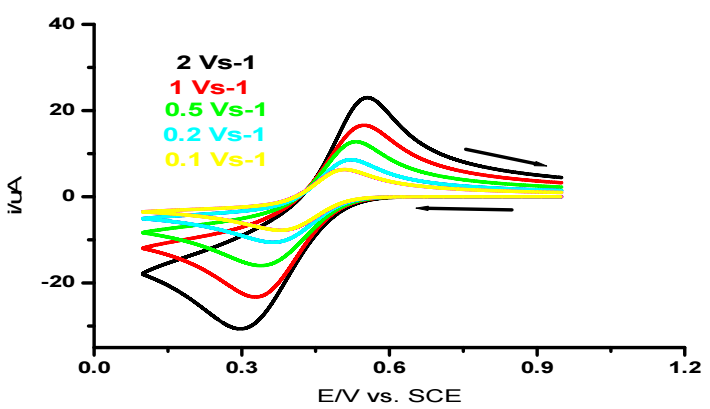
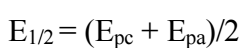
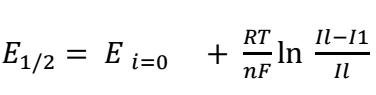
It is seen that Ipc and Ipa increased with increasing v, and ipa/ipc ratio of 1. As noticed, the system under study is quasi-reversible, since the criterion for fast systems was not herein satisfied (Epa - Epc > 0.057 V), but both peaks are present on the CV 24. The half-wave potential is:
 (1)
(1)
Often interpreted as redox potential of a system, it does not depend on v within the measurement accuracy limits. E1/2 determined value for Fe (III)/Fe (II) system was found to be equal 0.443 ± 0.002 V. The variation of the values of wave parameters with ν were cited in Table 1.
Table 1: CV data of 0.01 M Fe (III)/Fe (II) system at Au electrode in 1.0 M HCl with various ν for Au, at 25 ºC.
| SR/υ (V/s-1) | Epa (V) | ipa (µA) | Epc (V) | *∆Ep (V) |
|---|---|---|---|---|
| 0.05 | 0.39 | 5.7 | 0.500 | 0.108 |
| 0.1 | 0.377 | 7.70 | 0.505 | 0.128 |
| 0.2 | 0.357 | 10.18 | 0.519 | 0.162 |
| 0.5 | 0.357 | 15.60 | 0.532 | 0.188 |
| 1.0 | 0.234 | 23.12 | 0.549 | 0.225 |
| 2.0 | 0.291 | 29.38 | 0.553 | 0.259 |
*peak potential separation
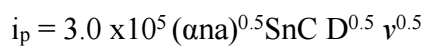
The ip values on i-E curves were determined by Randles-Sevcik eq.:
 (2)
(2)
where 3.0 x 10⁵ is the eq. constant at 25 ºC; n is the number of electrons involved in the redox process of Fe (III)/Fe(II) couple, which is 1; na is the number of electrons involved in the rate determining step; S is the electrode surface area (cm2); and C is the concentration of the electrochemically active substance (mmol/cm-3). This eq. describes redox processes that occur in equilibrium systems. However, it can also be used to describe quasi-reversible and even irreversible systems 24. Its applicability criterion for describing the cathode process in this system is that ipc vs. v 0.5 should be linear. Fig. 3 exhibits the linear presentation of ipc vs. v 0.5, which confirms Fe (III)/Fe (II) system diffusion character.
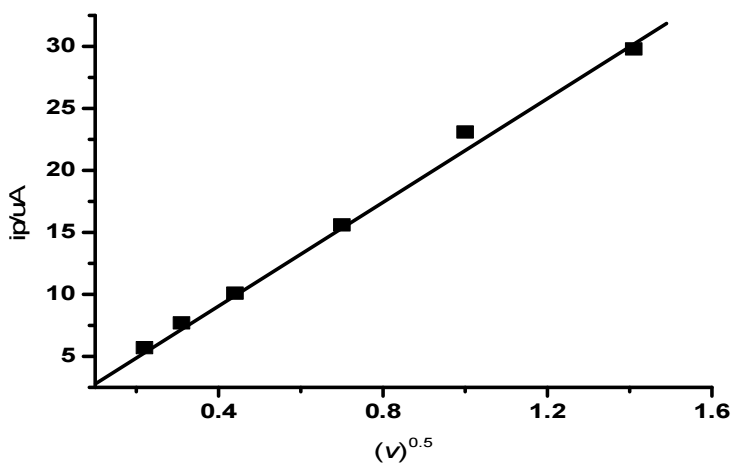
CV study indicated that Fe (III)/Fe (II) electrode reaction in aqueous media involved a quasi-reversible electrons transfer without any coupled chemical reactions. D values of Fe (III) /Fe (II) system were determined from the slope of the plot shown in Fig. 3, and found to be 4.8 x 10⁻¹⁰ m2/s-1. Peak characteristics determined from CV, at Au various C, are listed in Table 1.
CvV
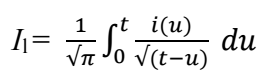
The convolution transformation (Il) of experimental i(t) data is expressed as:
 (3)
(3)
where Il is convolutive current, i(u) is the current at time (u) and t is the total time of the experiment.
As indicated, I1 convolution contains diffusional and current parts i(u) from t = 0, and reduces contributions to I1, by scaling each current segment by a factor dependent on the time interval (t-u). It also follows that, under pure diffusion-controlled conditions [i.e., C (0, t) = 0], I 1(t) exhibits its limiting value.
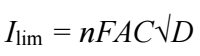
 (4)
(4)
where Ilim is the limiting convolution current, n is the number of electrons transferred and the remaining terms have their usual meaning.
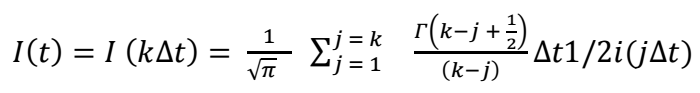
As a result, the convolution converts CV i-E shape to an S-shaped I(t)-E curve, which has a steady-state plot and is more adjustable for data analysis, in some cases 25-28. In addition, the sluggishness of heterogeneous kinetics or the uncompensated resistance “Ru’’ does not affect I lim plateau magnitude of a steady-state CV. The convolution integral I 1(t) evaluation was carried out via the following algorithm 29-32:
 (5)
(5)
where k is a variable between 0 and N, Δt = t f/N, N representing t = 0 and t = t f indexed by j, at Δt equally spaced time intervals, I(jΔt) is current, and Γ(x) is x Gamma function.
Fig. 4 indicates a moderate separation between forward and backward scans.
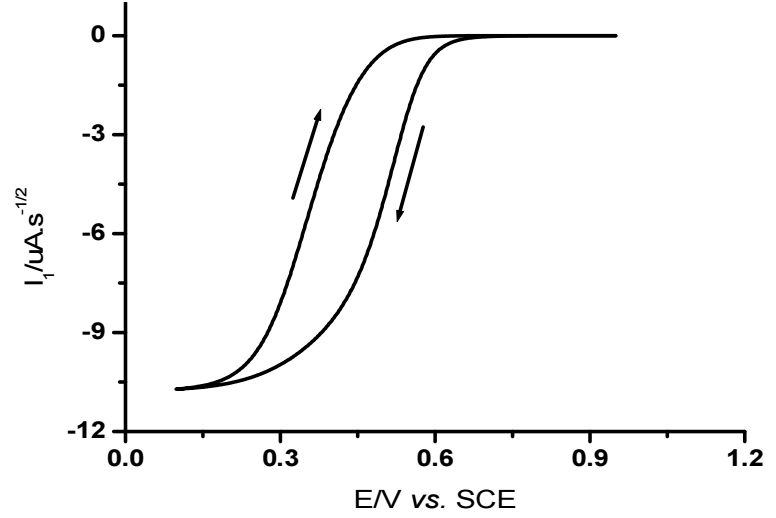
This confirms quasi-reversibility of electrons transfer rate, and verifying the ability of CvV to determine and elucidate charge transfer rate without calculating heterogeneous rate constant.
Herein, a novel method for extracting Eo value for a quasi-reversible system from a CV and Il(t) convolution is described. As shown in Fig. 5, on the reverse sweep, current passes through zero potential (E(I = 0)). At this potential, convoluted current is given by Il = 0. Regardless of electrons transfer kinetics, the convolution relationship is reduced to its simple polarographic form at this zero current point.
Eo value determined via this method was found to be 0.435 V. This value agrees with the one determined from CV which is mentioned in Table 2.
 (6)
(6)
on rearranging:
 (7)
(7)
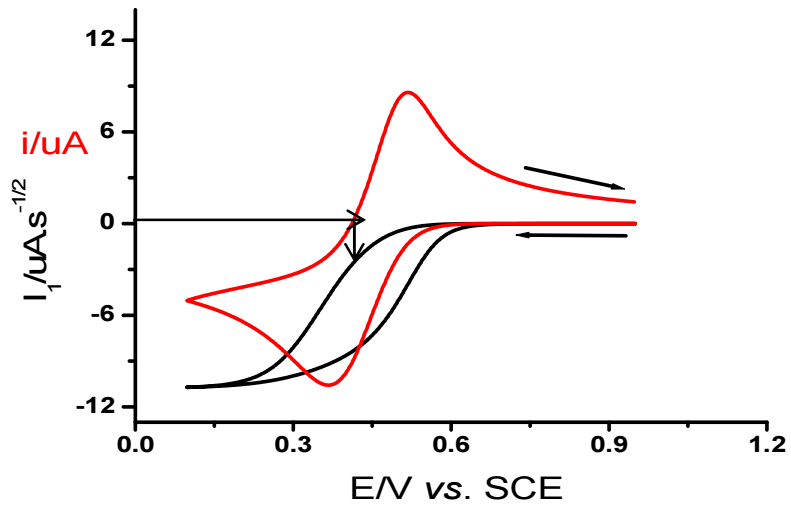
DV
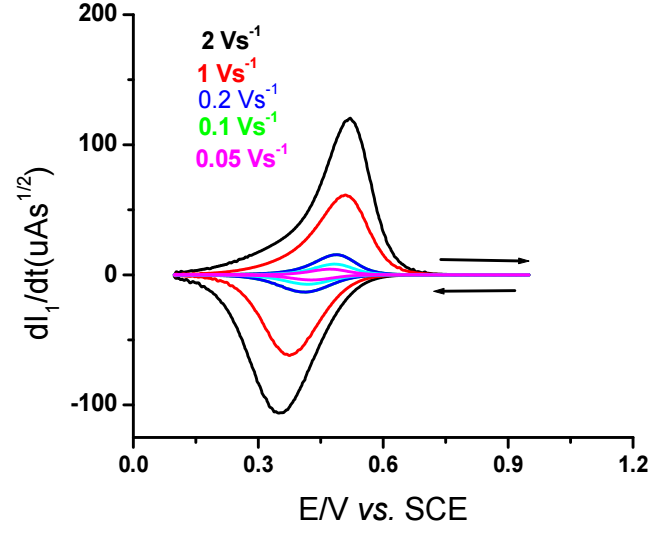
As described by 33-35, dI1/dt was established as the E feature for a fast electron system.
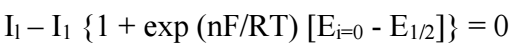 (8)
(8)
where the symbol a = nυF/RT and ζ = exp [nF/RT (E - E0)].
Fig. 6 illustrates this eq., for the way Fe (III) undergoes reduction at Au electrode.
The wp magnitude at half height was found to be in the range from 120 to 185 mV, which demonstrates the charge transfer slow speed. Also, lack of symmetry of onward and reversed peaks indicates electrons transfer quasi-reversibility. From the above, it is obvious that I1 vs. E and dI1/dt vs. E curves were easier to use, in order to offer proper information on the character of the electrode response, than i vs. E curve. D factor was further determined from eq. (6) 33), (34), (36.
D value magnitude obtained from Eq. (6) is listed in Table 2.
Table 2: Values of kinetic parameters of 0.01 M Fe (III) ions determined from different techniques at Au electrode.
| Technique | D x 1010 (m2/s-1) | Eo (V) | α | ks x 105 m/s-1 |
|---|---|---|---|---|
| CV | 4.9 | 0.440 | 0.39 | 2.3 |
| CvV | 5.1 | 0.435 | --- | --- |
| DV | 5.0 | 0.437 | 0.39 | --- |
| *Sim. | 4.8 | 0.430 | 0.40 | 2.4 |
* Numerical simulation
Also, the arrangement between convolution and deconvolution transformations yields the following relationship:
 (9)
(9)
where n is the number of charges consumed in the electrode pathway, with alternative parameters ordinary definitions. From eq. (7), total involved n was found to be 1.02 ca. 1.
Numerical simulation
A numerical simulation of simple electrons transfer was performed to determine the precise type of electrode reaction and confirm electrochemical parameters values. Fig. 7 displays the numerical reductive CV of simple electrons transfer (E) via the following electrochemical parameters: ks = 2.40 × 10⁻⁵ m/s-1; Eo = 0.43 V; α = 0.40; D = 4.8 × 10⁻¹⁰ m2/s-1; and n = 1.
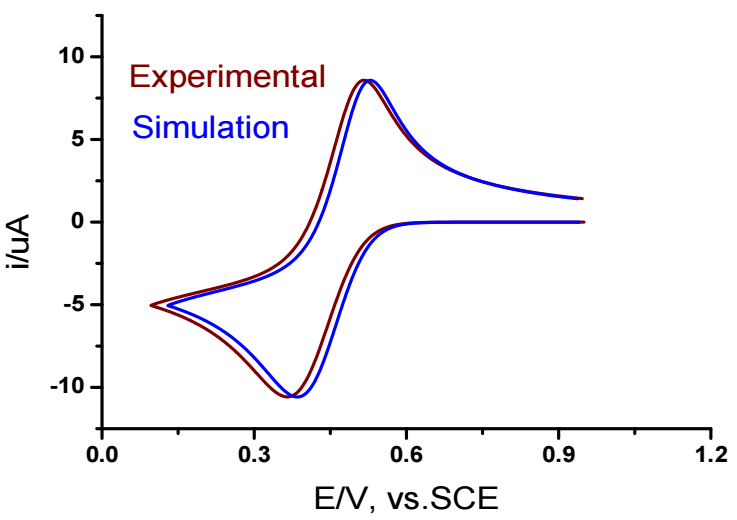
Figure 7: Comparison of numerical and experimental CV of 0.01 M Fe (III) ions at a SR of 0.2 V/s-1 and T of 25 ºC.
As shown in Fig. 7, good agreement between simulated and experimental CV confirmed the accuracy of the determined electrochemical parameters for Fe (III) ion.
Conclusion
In this report, the chemistry of Fe (III) /Fe (II) systems was explained at a working Au electrode in a 1 M HCl aqueous solution using CV, CvV and DV experiments. The proper parameters of the investigated system were experientially computed and theoretically validated via the numerical simulation method.
Authors’ contributions
I. S. El-Hallag: suggested the idea of the present article; illustrated obtained results; wrote the manuscript. A. A. Al-Owais: performed experimental work and numerical simulation.
Abbreviations
A: surface electrode area (cm2)
Ag/AgCl: silver/silver chloride
Au: gold
C: bulk concentration of electroactive species (mol/L)
CV: cyclic voltammetry
CvV: convolution voltammetry
D: diffusion coefficient (cm2)
dI1/dt = d 1/2 i/dt 1/2: semi-differentiation of current
DNA: deoxyribonucleic acid
DV: deconvolution voltammetry
Eo: standard redox potential (V)
E1/2: half-wave potential (V)
e p : (dI 1 /dt): height of deconvoluted peak current
Epa: anodic peak potential (V)
Epa - Epc: peak potential separation (V)
Epc: cathodic peak potential (V)
F: Faraday’s constant (96500 C.mol-1)
Fe (II): ferrous ion
Fe (III): Ferric ion
FeCl3: ferric chloride
FeSO4: ferrous sulfate
FRAP: Fe (III) reducing antioxidant power
HCl: hydrochloric acid
Iconv: convolution current
ideconv: deconvolution current
i-E curve: current-potential curve
Ilim: limiting convoluted current (µA/s-1/2)
ip: peak current
ipa: height of anodic peak current (µA)
ipc: height of cathodic peak current (µA)
K3[Fe(CN)6]: potassium ferricyanide
KNO3: potassium nitrate
ks: heterogeneous rate constant (cm/s-1)
n: number of electrons involved in the electrode reaction
NHFe: non-heme Fe
R: universal gas constant, (8.314 J/mol-1/K-1)
Redox: reduction-oxidation reaction
Sim: digital simulation
SR: scan rate
T: absolute temperature (K)
wp: peak width of the deconvolution peak height (V)

