


 Inglês (pdf)
 Artigo em XML
 Referências do artigo
 Enviar este artigo por email
 Citado por SciELO
  Similares em
SciELO
Similares em
SciELO 
 Permalink
Introduction
It is well recognized that composite coatings of a single metal and alloys protect steel against corrosion, by improving its mechanical, physical and/or electrochemical properties. As such, Zn-based alloys have attracted a lot of interest in the last decade 1-9. Zn-Ni alloy has received more attention, due to its high degree of corrosion resistance, mechanical characteristics and thermal stability, compared to Zn only and other Zn alloys coatings 10-17. Zn-Ni alloy is more toxic than Zn-Cd alloy 18),(19, although it has been widely used in automotive, aeronautic, marine, building and electronics industries 20-22.
In order to improve coating quality, using additives is generally recommended. Generally, a small amount of additives affects the electroplating reaction kinetics, mainly by adsorption or complexation 23,24. Therefore, metals and metal oxides electroplating is often performed in baths containing organic additives 25-29.
The present study dealt with Zn-Ni coating electroplating from a sulfate bath. The main goal was to find the best bath composition that would produce coatings with high quality and hardness. For this purpose, a mixture design method was examined, which provided maximum information on its constituents, their individual influences and possible interactions. This assessment allowed reducing the experiments number, facilitating the study planning and procedures 30,31. The desired response depended on the bath components concentration, which were Na3C6H5O7 -, C7H5NO3S and 2-butyne-1,4-diol.
Experimental
Material
Low CS, conforming to SAE 1010, ASTM A-366 and QQS-698 standards, was used in this study. CS substrate chemical composition is given in Table 1.
Table 1: Chemical composition of CS substrate.
| Element | C | Mn | P | S | Fe |
|---|---|---|---|---|---|
| max% | 0.13 | 0.60 | 0.40 | 0.05 | Remainder |
Electroplating
Zn-Ni alloy coatings electrodeposition was carried out in a sulfate acid bath, of which compositions and operating conditions are shown in Table 2. The solution pH was from 4.3 to 4.5. Each experiment was performed in a fresh solution, to avoid problems such as metal ions depletion from the electrolyte.
Table 2: Bath composition and operating conditions.
| Composition | Quantity | Operating conditions |
|---|---|---|
| ZnSO4.7H2O | 0.10 M | 4.3 < pH < 4.5 G = 63.8 mS T: 30 ± 1 °C Stirring speed: 300 rpm Electrolyte volume: 100 mL = 1 A/dm² e = 15 µm |
| NiSO4.6H2O | 0.10 M | |
| Na2SO4 | 0.40 M | |
| H2SO4 | 0.01M | |
| Na3C6H5O7 | 0.10- 0.30 M | |
| C7H5NO3S | 0 - 0.30 g/L | |
| 2-butyne-1,4-diol | 0 - 0.30 g/L |
Zn-Ni deposits electrodeposition was performed in a conventional electrochemical cell with two electrodes (cathode and anode), to which constant ddp was applied, using a generator. The procedure was carried out by fixing the following parameters: T of 30±1 ºC, stirring speed around 300 rpm, electrolyte volume of 100 mL, I of 1 A/dm² and thickness of 15 µm. However, Na3C6H5O7 -, C7H5NO3S and 2- butyne-1,4-diol concentrations were changed, according to a matrix given by the mixture design (MINITAB 18) (Table 3).
Table 3: Experimental results according to the mixture design.
| Std. order | Na3C6H5O7 (M) | C7H5NO3S (g/L) | 2butyne1,4diol (g/L) | Microhardness (HV) (HV) | Theo microhardness (HV) | Relat. incert.(%) | Absol. incert.(%) |
| 2 | 0.10 | 0.30 | 0.10 | 194.20 | 198.60 | 2.22 | 4.40 |
| 10 | 0.13 | 0.13 | 0.23 | 136.80 | 164.66 | 16.92 | 27.86 |
| 8 | 0.23 | 0.13 | 0.13 | 168.80 | 182.53 | 7.52 | 13.73 |
| 1 | 0.30 | 0.10 | 0.10 | 221.60 | 215.22 | 2.96 | 6.38 |
| 6 | 0.10 | 0.20 | 0.20 | 144.60 | 156.38 | 7.53 | 11.78 |
| 9 | 0.13 | 0.23 | 0.13 | 182.30 | 163.68 | 11.37 | 18.62 |
| 3 | 0.10 | 0.10 | 0.30 | 174.50 | 163.41 | 6.78 | 11.09 |
| 7 | 0.17 | 0.17 | 0.17 | 202.10 | 162.92 | 24.05 | 39.18 |
| 4 | 0.20 | 0.20 | 0.10 | 141.70 | 158.19 | 10.42 | 16.49 |
| 5 | 0.20 | 0.10 | 0.20 | 195.30 | 196.30 | 0.51 | 1.00 |
Results and discussion
Simplex plot
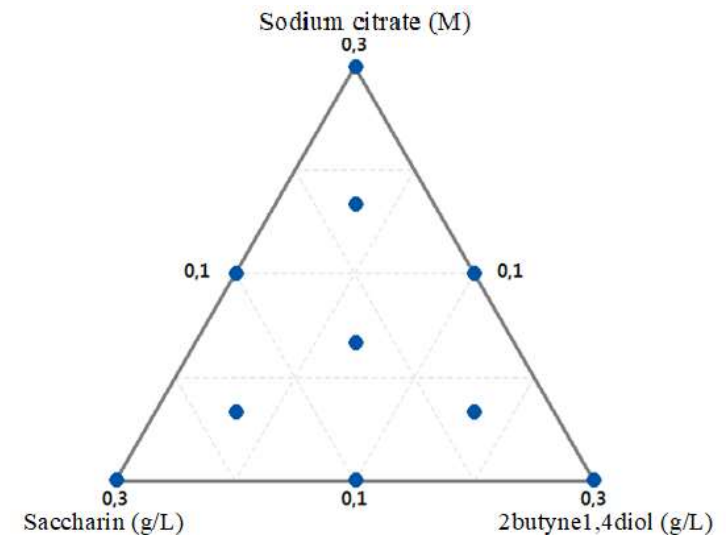
The simplex plot shows points in the plane space, which are: three at the triangle vertices, for 0.3 M Na3C6H5O7 -, 0.3 g/L C7H5NO3S and 0.3 g/L 2butyne1,4diol pure solutions; three on the triangle sides for the mixtures; and one in the triangle center consisting of the three components in equal proportions. These three complete mixtures had all components, but in different proportions (Fig. 1).
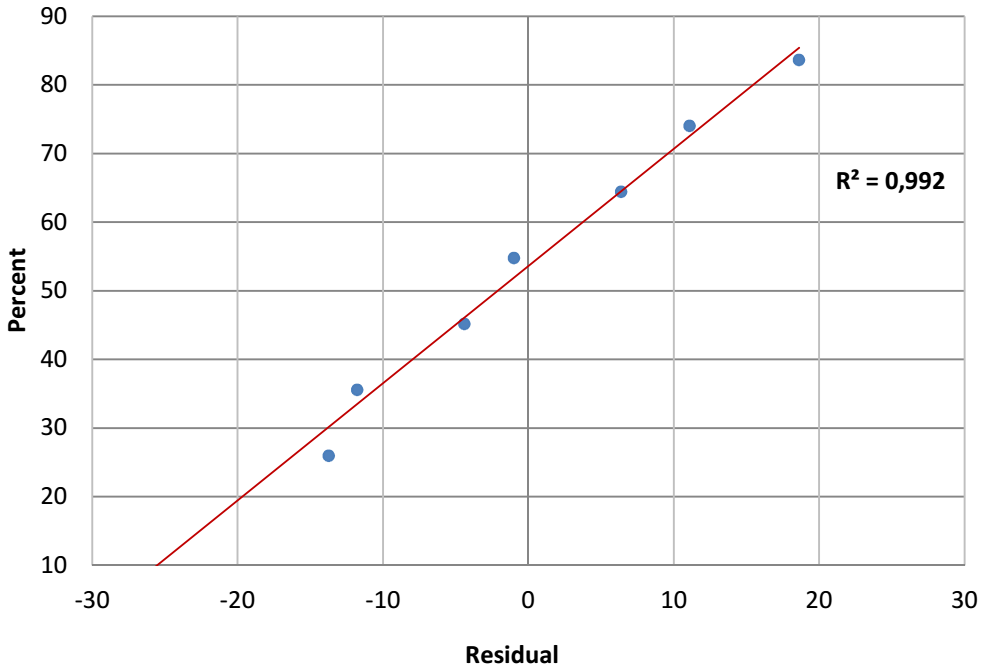
Henry's line of residual values
Generally, Henry's line is useful for checking the model normality. It is seen that the points tend to form a line (Fig. 2).
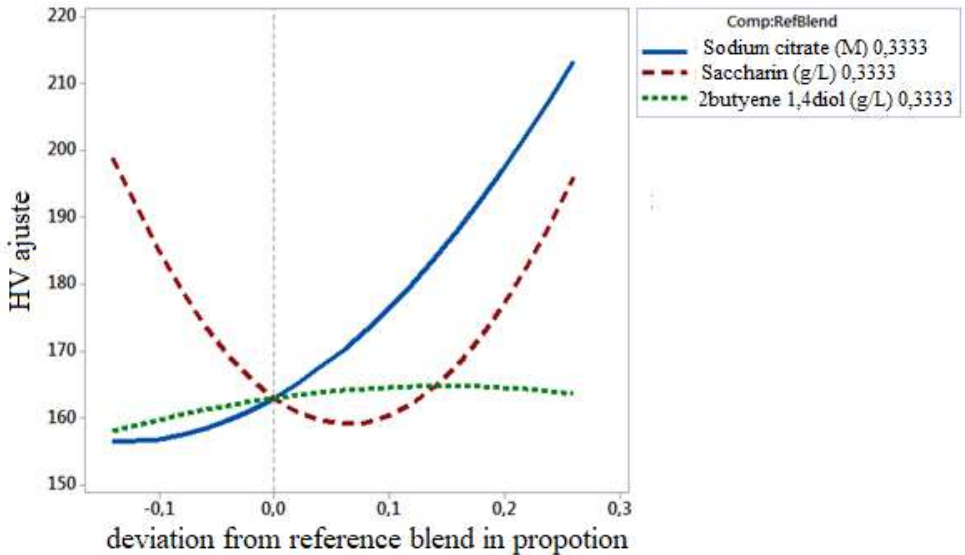
Cox plot
The Cox plot (Fig. 3) presents the evolution of the estimated response by varying the proportion of a single component from a reference mixture, while keeping constant the other components ratio 30. It consists in representing micro-hardness variations along the Cox axis.
Micro-hardness decreased with increased C7H5NO3S concentrations in the mixture, up to the reference line. On the other hand, beyond this line, an increase in micro-hardness was observed. It was also found that 2-butyne1,4diol presence did not have a remarkable effect on micro-hardness. However, Na3C6H5O7 - had a positive effect on the obtained coatings micro-hardness.
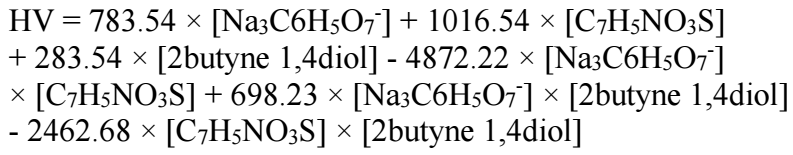
Mathematical model
The mathematical model applied to the response (Zn-Ni coating micro-hardness) is a quadratic model for three components, with a total of six coefficients for a single response, according to eq. 1.
 (1)
(1)
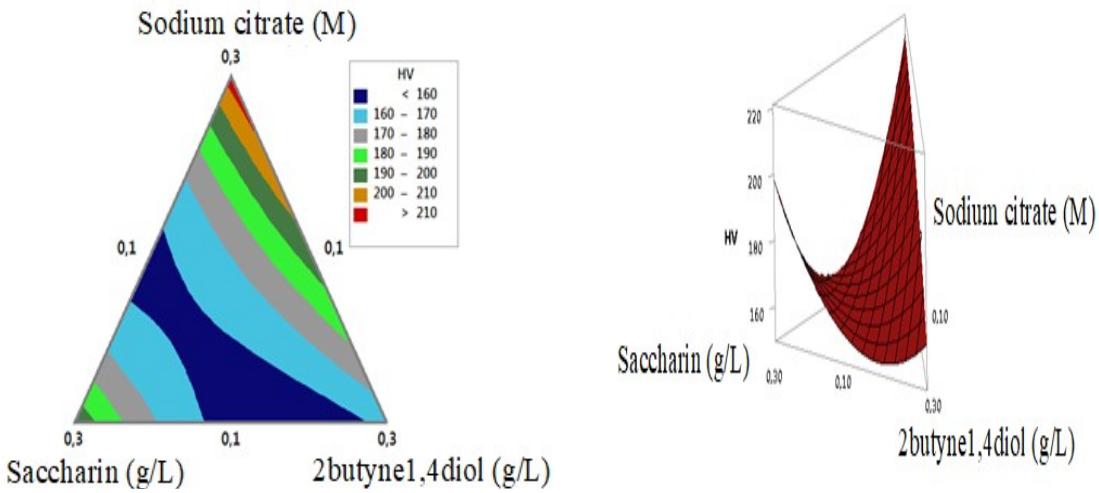
Graphics contour and surface response
Simplex contour and response surfaces are shown in Fig. 4. On its left side, Na3C6H5O7 -, C7H5NO3S, and 2butyne1,4diol contour area and micro-hardness are shown. The best responses are represented by the red contour (>210 HV), which is located at the high level for 0.3 g/L Na3C6H5O7 -, and at the low level for 0.1 g/L C7H5NO3S and 2butyne1,4diol each. The response surface represented in a polyhedron (on Fig. 4 right) is a concave triangle shape.
It is seen that microhardness increased with lower C7H5NO3S and 2butyne1,4diol concentrations, and with higher Na3C6H5O7 - content.
Optimization
There are many optimization methods. Most of them have been created to deal with the mathematical problem of finding the multi-variable extreme, whether non-linear functions are subject to constraints or not. After several optimizations, the best results are shown in Table 4.
Table 4: Optimal composition of the mixture Na3C6H5O7 -, C7H5NO3S and 2butyne 1,4 diol.
| Optimal composition | Theoretical response (HV) | Experimental response (HV) | ||
|---|---|---|---|---|
| Na3C6H5O7 - (M) | C7H5NO3S (g/L) | 2butyne1,4diol (g/L) | ||
| 0.30 | 0.10 | 0.10 | 215.22 | 221.60 |
Theoretical and experimental responses
The following figure represents the plot of experimental response as a function of theoretical response. From Fig. 5, we can see that the experimental and estimated responses are on the regression line, with a very good value of 0.9846.
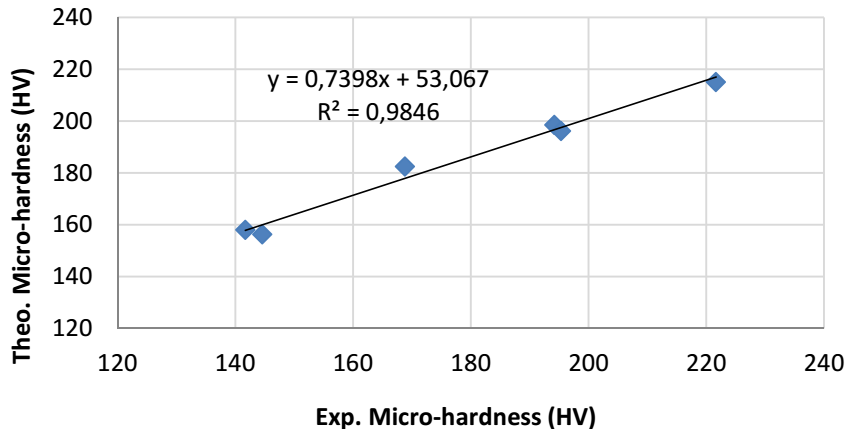
Figure 5: Graphical representation of theoretical responses as a function of experimental responses.
From Table 2, it was confirmed that there was not a significant difference between experimental and theoretical values, which is represented by the relative and absolute incertitudes calculated according to eqs. 2 and 3, respectively.
 (2)
(2)
 (3)
(3)
Characterization
SEM analysis
SEM images show that the bath composition influenced the coating quality. Indeed, with Na3C6H5O7 - only (Fig. 6a), a CS non-homogeneous oxidized surface was obtained.
In contrast, the CS surface morphology was improved by C7H5NO3S addition (Fig. 6b), which turned out to be more homogeneous and less oxidized compared than that of Fig. 6a.
By adding Na3C6H5O7 - and 2butyne1,4diol, the obtained deposit formed cracks (Fig. 6c). It is also seen that the grains have a large size and cauliflower shape. The same results were found by 32,33. It was found that the best surface in terms of quality and brightness was obtained in the presence of all additives (Fig. 6d).
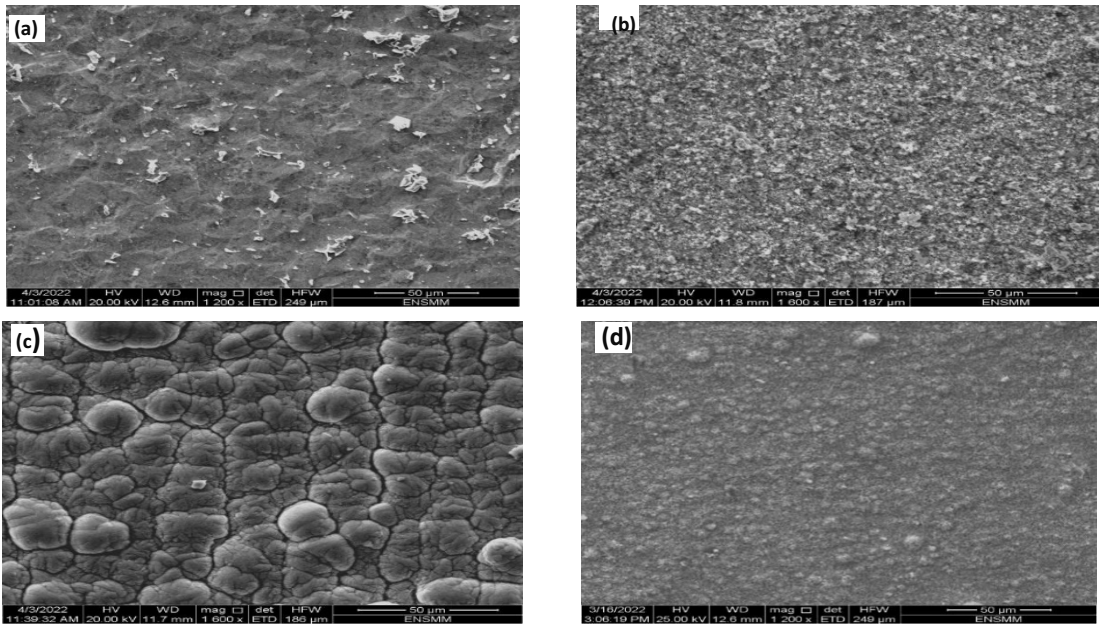
Figure 6: SEM image of Zn-Ni alloys deposited at different baths: (a) Na3C6H5O7 -; (b) Na3C6H5O7 - + C7H5NO3S; (c) Na3C6H5O7 - + 2butyne1,4diol; and (d) Na3C6H5O7 - + C7H5NO3S + 2butyne1,4diol. I = 1A/dm², T = 30 ºC, ss = 300 rpm, Velectrolyte = 100 mL and e = 15µm.
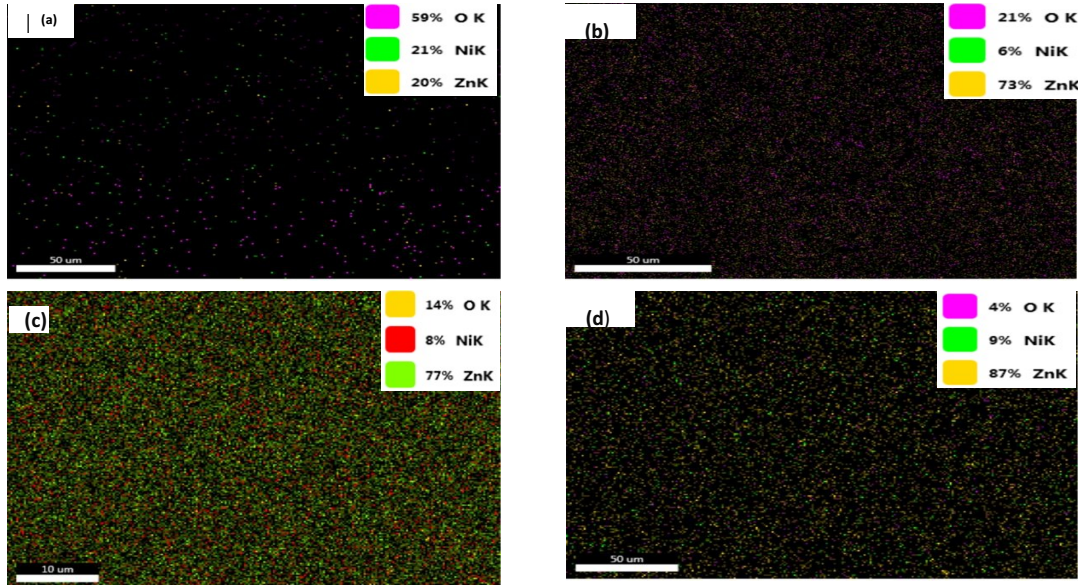
EDS analysis
EDS analysis results showed that Zn content of Fig. 7a was lower than that of Fig. 7d, contrary to O. Ni concentration in the deposit varied between 6 and 21%. From literature, it was reported that Zn-Ni coatings ranging from 10 to 15 wt% Ni have better corrosion resistance 34.
Discussion
These findings are consistent with other previous results, and the change in Zn-Ni alloy coatings quality and micro-hardness is explained by the additive molecules adsorption onto the cathode surface.
It was found, by 11, that Na3C6H5O7 - effectively stabilizes Zn-Ni alloy plating baths. According to 35, it was found that Na3C6H5O7 - addition influenced the grains morphology and size.
C7H5NO3S and 2-butyne 1-4 diol organic additives used in this study influenced the obtained coating roughness, by preventing the formation and growth of nodular structures. This finding was also reported by 36-38.
It was found that O can disrupt the process, due to the formation of Zn(OH)2 precipitate, which inhibits Ni deposition. This result agrees with that of 39, who found that O incorporation into the deposits is probably due to the formation of Zn(OH)2 layer.
Conclusion
This study was focused on the protection of low-CS against corrosion, using electrodeposition as a solution. Zn-Ni coatings were produced from a sulfate bath with 0.1 to 0.3 g/L of both C7H5NO3S and 2-butyne1-4diol (0.1 to 0.3 g/L) as additives, and 0.1 to 0.3 M Na3C6H5O7 - as complexing agent.
The electrodeposition performance of Zn-Ni coating can be improved with the three components blend, by applying the mixture design method. This method employed a quadratic model that considered microhardness as a response to various constituents. A set of experiences and proposed formulations to determine the optimum conditions was herein built, leading to a gray, smooth, uniform, hard and bright coating.
The mathematical model was validated by comparing theoretical and experimental microhardness results. Indeed, the fit was almost perfect, as the linear correlation constant was 0.9846.
Optimization gave a mixture of three components, of which concentrations were 0.3 M Na3C6H5O7 - and 0.1 g/L each C7H5NO3S and 2-butyne1,4diol. This corresponded to a theoretical microhardness of 215.22 HV. Indeed, to confirm and validate the theoretically obtained results, a check for an additional experiment under optimal conditions was performed, and the experimentally obtained microhardness value was 221.60 HV.
From SEM analysis, it was found that the presence of additives played a significant role on the deposit surface morphology and homogeneity.
Acknowledgments
We thank Prof. Rehamnia Rabah Director of the LNCTS Research Laboratory and Dr. Amirat Samia, Head of Chemistry Department, Badji Mokhtar University of Annaba, for providing us with the necessary material resources. The authors thank also the ENSMM-Annaba for the assistance provided in this research, through SEM-EDS analyzes.
Conflict of interest
The authors declare that they have no known competing financial interests or personal relationships that could have appeared to influence the work reported in this paper.
Authors’ contributions
Hawa Bendebane: designed the research work; performed the experimental work; carried out data analysis and interpretation; acted as corresponding author. Salima Bendebane: contributed to the interpretation of results; made the paper English corrections; improved the quality of the paper. Samia Amirat: supervised the work at certain parts. Rabah Rehamnia: provided methodology and investigation. All authors read and reviewed the manuscript.
Abbreviations
ASTM: American Society for Testing and Materials
C7H5NO3S: saccharine
CS: carbon steel
ddp: potential difference
e: thickness (µm)
EDS: energy dispersive spectroscopy
G = conductivity (mS):
H2SO4: sulfuric acid
HV: microhardness unit
I: current density
Na2SO4: sodium sulfate
Na3C6H5O7: sodium citrate
NiSO4.6H2O: nickel sulfate hexahydrate
SEM: scanning electron microscopy
Theo: theobromine
Zn-Ni: zinc-nickel alloy
Zn(OH)2: zinc hydroxide
ZnSO4.7H2O: white vitriol

