




 Inglês (pdf)
 Artigo em XML
 Referências do artigo
 Tradução automática
 Enviar este artigo por email
 Citado por SciELO
  Similares em
SciELO
Similares em
SciELO 
 Permalink
Introduction
Corona gas discharge produces a typical glow on devices with a 5 to 30 kV voltage and frequencies from 10 to 150 kHz 1. In 1949, 2 received a patent for a “Method for obtaining photographic pictures of different types of objects”.
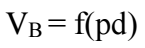
The method of selective electric discharge allows for a dielectric medium to record information on another that is in contact with it. It is based on electric discharge at normal atmospheric pressure in a three-layer condenser: dielectric-air gap-dielectric 3,4. A constant and controllable by-force electric field is created in it. In certain places where the electric field surprises the breakdown value of the field in the air gap, a perforation in the last one occurs. Pashen’s law 5 describes this phenomenon as:
 (1)
(1)
VB depends on p and d.
Due to perforation, electric discharge is selectively remitted on the recording electric medium.
In 1965, 6 has published an electrophotography book with corresponding technology for directly capturing corona discharges from biological objects, especially around larger contact surfaces. Electrophotography is by far the most significant of all the reprographics technologies for photocopying and laser/LED printing.
In 1975, 7 have described the gas discharge effect with copying on the photographic photo film as electrophotography.
Since 1960, 8,9 have developed electrophotographic methods for images registration.
In 1968, 4 has developed a method for gas discharge photography. 10-18 have also made researches in this area. During the process, in the ionization zone, sliding discharge develops on a dielectric surface powered by a non-uniform electric field near an electrode with a small curvature radius. The small gap thickness between the experimental object and the electrode ranges from 10 to 100 µm.
Experimentally, the gas discharge effect gives information on the electric field distribution in the air gap between the object and the registering medium during the discharge 1), (19-21. Ions of N, O, CO₂ and free electrons form the discharge itself. The free electrons are separated from N2, O2 and CO2 molecules, which generate gas discharge between the studied object and the electrode 22-24.
Research has focused on analyzing an insight conclusion about digital analysis on the corona gas discharge spectrum, by introducing a pre-processing procedure to extract the texture effects as the radiation energy signature based on its most significant glow (digitally imaged isolines), which is used for medical biometric and disease interpretations 25.
During corona gas discharge in the atmosphere, there is a process of CO3 - formation 26. When CaCO3, H2O and CO2 are combined, the following reaction is observed 27.
 (2)
(2)
28 have developed a gas discharge photography method that that described the reaction as:
 (3)
(3)
Falk has shown that HOH bending is fundamental for solids and liquids 29.
CaCO3 has the most extensive local extremums at 873 30 and 1457 cm-1 (31.
Studies employing NES and DNES 33-35 methods with 873 cm-1 were made for cave water 32, the environment process 36 and plants with Ca2+ (36,37.
The present investigation aimed to prove that, in coronal gas discharge conditions, there is an activation of the separated photons processes for CaCO3 ions and H2O reactions.
Materials and methods
Device for color coronal spectral analysis
Gas discharge emission for color coronal spectral analysis 1), (21), (23), (37), (38 was investigated in a dark room. It was registered with a photosensitive paper or color film placed on transparent Hostaphan electrode with an 87 mm diameter. It was filled with a conductive liquid composed of a 1% NaCl solution in deionized H2O. Herein, the 1% solution was made from CaCO3. Investigated objects (H2O drops and human thumbs) were placed on the corresponding photosensitive material. Pulses with 12 kV voltage and a carrier frequency of 15 kHz were applied between the objects and the electrode Cu coating.
The functional scheme of gas corona discharge device is shown in Fig. 1.
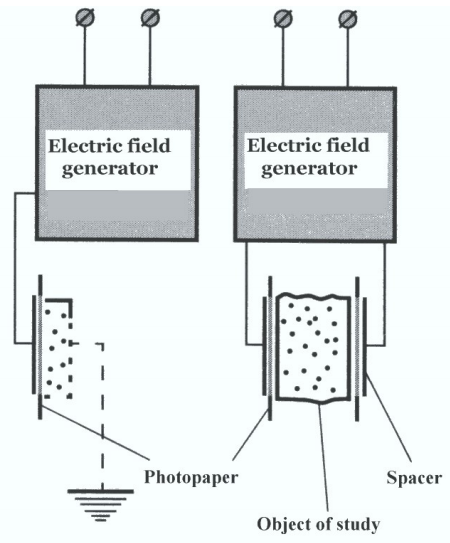
Corona gas discharge was generated in the gap between the investigated objects and the transparent electrode, producing a characteristic glow around the contact area. Its electromagnetic emission, which ranged from 380 to 495 nm and 570 to 750±5 nm, illuminated the corresponding photosensitive material, according to the objects specific properties (Fig. 2) 39.
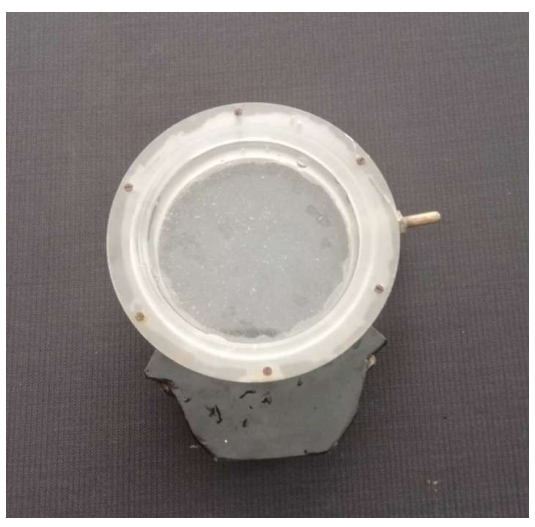
Figure 2: Transparent electrode with 87 mm diameter made of Hostaphan and filled with conductive liquid (1% CaCO3 in a distilled H2O solution).
Color images produced by visible, UV and IR radiation were processed and analyzed with a dedicated software package. Measured spectral characteristics were calculated in eV.
FTIR
IR-spectra of CaCO3 were registered on a Brucker Vertex (“Brucker”, Germany) FTIR (spectral range: average IR- 370 ÷ 7800 cm-1; visible- 2500 ÷ 8000 cm-1; permission- 0.5 cm-1; accuracy of ṽ - 0.1 cm-1 on 2000 cm-1) and Thermo Nicolet Avatar 360 FTIR spectrometers.
NES and DNES methods
θ was measured with a specially designed instrument, which has been described in detail by 40-43. H2O drops evaporation was performed in a sealed chamber with a stable temperature of 22 ºC and humidity from 65 to 70% (40, 43) (Fig. 3). The drops were placed on a 350 µm thick BoPET sheet.
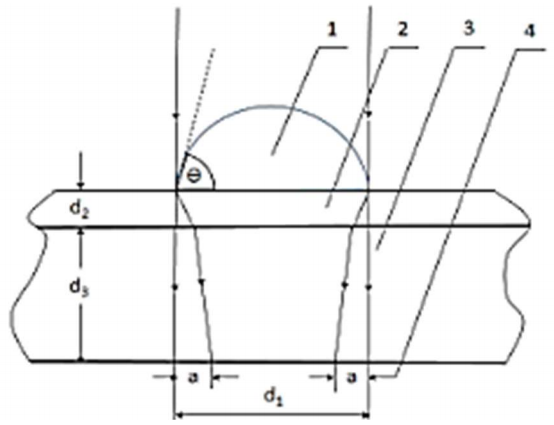
Figure 3: Operating principle of the method for measuring the liquid drops θ on a hard surface: 1- drop, 2- thin Maylar sheet, 3- glass plate and 4- refraction ring width.
θ is a function of a and d1.
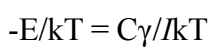
The device had the following technical features: monochromatic filter with λ of 580±7 nm; H2O evaporation angle ranging from 72.3 to 0 deg; measured range of hydrogen bonds energy among H2O molecules was λ = 8.9 ÷13.8 µm or E = -0.08 ÷ -0.1387 eV.
Luck has considered that, in H2O, hydrogen bonds exist between H atom of one H2O molecule and O of another 44. Most of them are bound by the connection energy (-E) and the remaining are free (E = 0). It is accepted that E has a negative value. This is known as Luck’s two-state model 45-48. The number of hydrogen bonds between H atom of one H2O molecule and O of another in a volume of H2O is twice as high as the number of molecules it contains.
Part of the hydrogen bonds is restructured in the proximity of the drop surface spherical part and which produces dependence between δ and hydrogen bond energy 49-51.
 (4)
(4)
where k is Boltzmann constant, E is hydrogen bond energy, α is the ratio of the phase space two sub-volumes related to hydrogen bonds (α = 28±8) structuring and restructuring, and I (5.03.1018 m-2) is H2O molecules density in the hydrophobic surface layer. E and α values were determined by comparison with the experiment. Expression (4) explains fraction C as δ = Cγ 50. According to 43,50, non-hydrogen bond interaction contribution amounts to 20% of γ and C real value (= 4/5). Considering Helmholtz free surface energy:
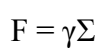 (5)
(5)
where Σ is the drop surface spherical part 43.
At the instant of mechanical equilibrium, F should be minimal, i.e., dF = 0 = d(γΣ) 43.
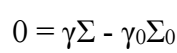 (6)
(6)
H2O drops forced evaporation process occurs at a constant temperature of 20 ºC in a hermetic camera 40.
Expressions for Σ0 and Σ are as follows 43:
 (7)
(7)
 (8)
(8)
 (9)
(9)
During the process, θ changes in discrete steps and characterizes hydrogen bonds average E as follows:
 (10)
(10)
 (11)
(11)
where b is a temperature-dependent parameter 52,53. The employed methods were NES and DNES 53-55. They are used for research on natural waters 37,53,55, plants 35 and blood serum 56. Molecular dynamics simulation was applied to investigate H2O droplets wetting behavior on the sandstone surface under different salinities. The system equilibrium configuration was used for studying the interaction of its components. The number of hydrogen bonds was calculated 57,58. E of hydrogen bonds among H2O molecules in H2O samples is measured in eV. A non-equilibrium evaporation process of H2O droplets characterizes f(E) of H2O. NES is measured in еV-1. DNES is defined as the difference 53-55:
 (12)
(12)
DNES is measured in еV-1, where f (*) denotes evaluated E 50-54.
Results
Parameters of 1% CaCO 3 in a distilled H 2 O solution obtained by color coronal spectral analysis
Electric discharge per unit area of the recording medium can be expressed as follows 20:
 (13)
(13)
where δ = d1/ε1 + d3/ε3; T is electric pulse duration; Up is VB of the air gap between experimental object and recording medium; d1, d2 and d3 are the thickness of the object, air gap, and photosensitive material, respectively; ε0 (1.00057 F/m-1), ε1 and ε3 are dielectric permittivity of air, experimental object and photosensitive material, respectively.
VB of the air gap is:
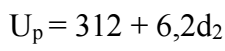 (14)
(14)
Consequently, a quadratic equation describing the width of the air gap is obtained:
 (15)
(15)
It has the following solutions:
 (16)
(16)
Coronal gas discharge method has applications for researching H2O drops electrical parameters in gas discharge conditions 5.
The dielectric constant as a parameter of coronal gas discharge was described by 3,10. It is a reliable dielectric permittivity in a homogenous medium.
The object conductivity is not practically reflected in the formation of the electric image. The image gives information on the dielectric and geometrical object characteristics, dielectric permittivity distribution and surface unevenness 5,9.
Dielectric permittivity is determined by the ability of a material to polarize due to an applied electric field, thereby partially neutralizing it in the material. Polarization refers to the displacement or orientation of associated electrical charges under the action of a field.
Investigation with the method of color coronal spectral analysis 1,21), (22), (37,38 was performed on the electric glow of the control sample (distilled H2O) and 1% CaCO3 in a distilled H2O solution (Fig. 4).
The electrode from Fig. 2 was positively charged. The negative electrode was approached until a corona breakdown voltage occurred.
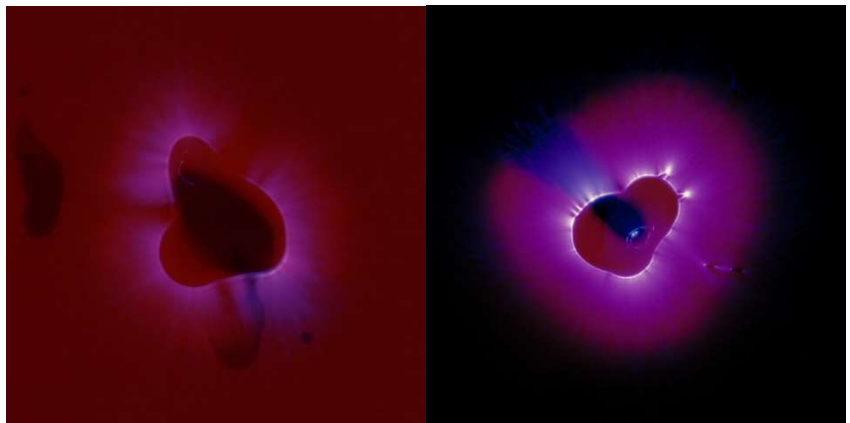
Figure 4: Color coronal images of the control sample (distilled H2O) and of the specimen with 1% CaCO3 in a distilled H2O solution.
Fig. 4 illustrates that the photon emission for the control sample was E = 2.05 eV or λ = 605 nm, and the average outcome was in the Em orange range. The result for the 1% CaCO3 sample was E = 2.98 eV or λ = 416 nm, i.e., the average outcome was in the Em violet range. The difference was E = 0.92 eV. H2O drop radius was 0.41 cm or S = πr2. S = 3.14 x 0.412 = 0.528 cm2.
For the control sample, the result was 2.11 eV/0.528 cm2 = 4.00 eV/cm-2. The result of the 1% CaCO3 sample was 2.98 eV/0.528 cm2 = 5.64 eV/cm-2.
The outcome of a discharge at the liquid drops point of contact with the photo film is valuable. For distilled H2O, VB had 31% discharge with photons in the red Em, where E = 1.68 eV or λ = 738 nm. With 1% CaCO3, there was 73% discharge with photons in the violet Em, where E = 3.02 eV or λ = 410.5 nm.
The method for brightness estimation from coronal discharge emission research was developed 19), (59.
The formula calculates Peff of the device for color corona discharge:
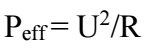 (17)
(17)
where U = 12 kV. Corona discharge for H2O drop was R = 109 Ω. Peff = U2/R = 122106/109= 0.144 W.
Results with pH and electric conductivity
Table 1 shows the change of parameters for 1% (w/v) CaCO3 after 30 sec corona gas discharge, where U = 12 kV and ν =15 kHz.
Table 1: Parameters for 1% CaCO3 in a distilled H2O solution with coronal gas discharge effect.
| Parameters | Distilled H2O | 1% (v/v) CaCO3 | 1% (v/v) CaCO3 Gas discharge effect |
|---|---|---|---|
| Electric conductivity (µS/cm-1) | 28.1 ±0.28 | 55.1 ±0.55 | 57.3 ±0.57 |
| pH | 7.51 ±0.75 | 9.07 ±0.09 | 9.33 ±0.09 |
There was an increase in the studied electric conductivity and pH values. The number of OH- hydroxyl groups also increased with higher pH values.
There was a statistically significant difference between the 1% CaCO3 solution in distilled H2O before and after the coronal effect, according to the Student’s t-test at p < 0.01 level.
Results of reactions with CaCO 3
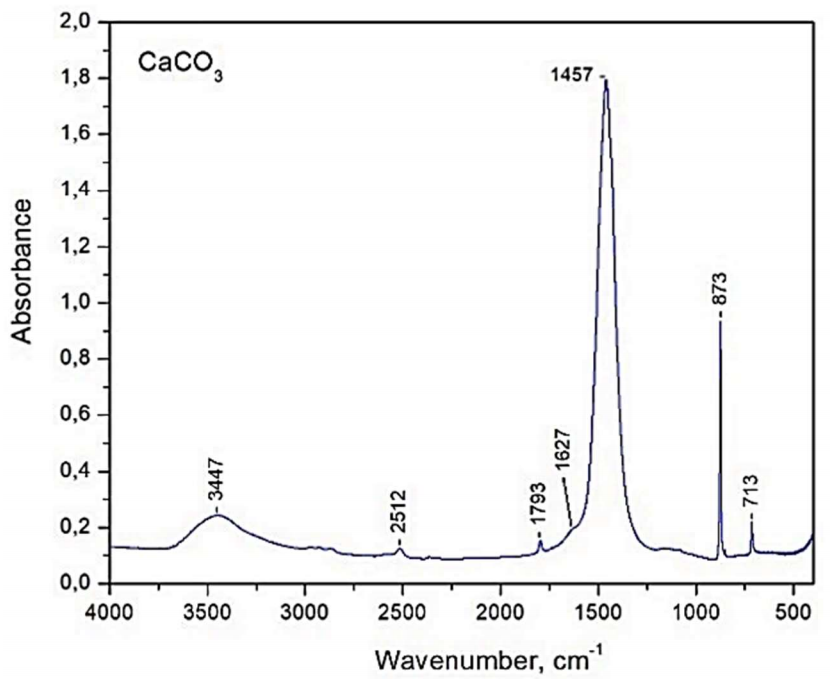
The research on CaCO3 was performed with FTIR, which showed that the peaks at ṽ = 713, 873, 1457, 1627, 1793, 2512 and 3447 cm-1 (60), (61 (Fig. 5).
DNES of H2O was studied from Temnata dupka (Dark hole) cave with Ca2+ and HCO3 - contents of 66 and 223 mg/L-1, respectively. A peak was observed at E = -0.1087 eV, λ = 11.41 μm and ṽ = 877 cm-1. FTIR analysis of CaCO3 had the following results: E = -0.1082 eV; λ = 11.46 μm; and ṽ = 873 cm-1. H2O vapor spectral range ranged from 0 to 877 cm-1 (62. Adsorption peaks for CaCO3 were at 713 and 875 cm-1. The results indicate that an analysis of peaks at 713 and within the interval of 873 ÷ 879 cm-1 can be used to evaluate NES processes with CaCO3 in H2O and air. Since exposure to H2O with different physicochemical parameters, air moisture, and thermal effects can be assessed, the quality of CaCO3 solutions and protection against CO₂ emissions is stronger.
The present study illustrates an increase in f(E) peak at 877 cm-1, from 32.6 to 39.9 eV-1, during the process of coronal discharge on 1% CaCO3 in a distilled H2O solution (Table 2).
Table 2: Results for 1% CaCO3 in a distilled H2O solution before and after coronal discharge.
| 1% CaCO3 in distilled H2O | 1% CaCO3 in distilled H2O after coronal discharge f(E) with eV-1 of 877 cm-1 |
|---|---|
| 32.6 | 45.3 |
| 32.3 | 44.8 |
| 32.8 | 45.1 |
| 32.8 | 45.2 |
| 32.7 | 44.8 |
| 32.2 | 44.7 |
| 32.6 | 44.9 |
| 32.7 | 44.8 |
| 32.7 | 44.6 |
| 32.8 | 45.2 |
| average result | average result |
| 32.6 | 44.9 |
There was a statistically significant difference between 1% CaCO3 in the distilled H2O solution after and before coronal discharge effect, according to Student’s t-test at p < 0.05 level, with r of 0.964.
Conclusions
Color corona spectral analysis method has been applied for studying CaCO3.
The following conclusions were drawn: a difference in the discharge parameters of H2O drops was observed for 1% CaCO3 in distilled H2O before and after coronal discharge effect; there was an increase in electric conductivity and pH studied parameters; the number of OH- hydroxyl groups also increased with higher pH values.
During the coronal discharge process with 1% CaCO3 in a distilled H2O solution, this study illustrated the increase in the peak of energies distribution function for hydrogen bonds among H2O molecules f(E) at 877 cm-1, from 32.6 to 44.9 eV-1. These findings have applications for chemical processes with color corona discharge on CaCO3.
There were corona gas discharge effects from the primordial atmosphere to H2O. In 1952, Miller-Urey experiments were performed with gas discharge effects in laboratory conditions. Twenty organic molecules have been structured from the following inorganic compounds: H2O, CH4, NH3, H2 and electric discharge 63. Different scientists have repeated the Miller-Urey experiment.
In 1968, 64 have synthesized porphyrin using a device with U = 12 kV. In 2014, 1 investigated corona discharge and protocells synthesis with the same value 64. In 2021, 39 published chemical reactions of polar molecules in H2O with gas discharge conditions. In 2021, 65 have studied Miller-Urey experiment processes in a silica medium with U = 30 kV.
Authors’ contributions
Ignat Ignatov: conceived the research paper original idea; collected data; performed experimental work; inserted data or analysis tools; wrote the paper. Christos Drossinakis: collected data; performed experimental work; and analyzed data obtained by xperiments. Alexander I. Ignatov: collected data; performed experimental work; and wrote the references.
Abbreviations
BoPET: biaxially-oriented polyethylene terephthalate
Ca2+: calcium ions
CaCO3: calcium carbonate
Ca(HCО3)2: calcium hydrogen carbonate
CH4: methane
CO₂: carbon dioxide
CO3 -: carbonate ions
Cu: copper
d: gap length
DNES: differential non-equilibrium spectrum
E: energy (eV)
Em: electromagnetic spectrum
eV: electron volts
f(E): energy distribution spectrum function
FTIR: Fourier transform infrared
H2: hydrogen
H2O: water
HCO3 -: hydrogen carbonate ion
HOH: hydrogen hydroxide
LED: light emitting diode
N: nitrogen
NES: non-equilibrium energy spectrum
NH3: ammonia
O: oxygen
p: gas pressure
Peff: effective power
r: correlation coeficient
R: electric resistance
S: surface area
U: voltage (kV)
VB: breakdown voltage

