


 Inglês (pdf)
 Artigo em XML
 Referências do artigo
 Enviar este artigo por email
 Citado por SciELO
  Similares em
SciELO
Similares em
SciELO 
 Permalink
Introduction
Pure Pb is too fragile to be used in batteries. It is easily corroded upon immersion in H2SO4. Within the battery, pure Pb anode will stretch and deform, which causes PbO2 layer to crack, exposing it to oxidation and accelerated CR. This has been proven by previous researchers 1. Pb-acid batteries also suffer from sulfation phenomenon. This is indicated by the formation of PbSO4 that covers the Pb surface and prevents electrochemical reactions to occur, thus reducing the battery life 2. This is why extensive research has recently been made to develop some alloys based on Pb with better corrosion resistance and hardness, allowing batteries to last longer. Some researchers have chosen to add some chemical products into the battery electrolyte, e.g., P compounds such as H3PO4 and its salts, which have given some very remarkable results for decreasing sulfation intensity 3-6. Other scientists have elaborated Pb-based alloys that will give not only stronger corrosion resistance but also more hardness to the metal, which will add up to the battery lifetime. Pb-Ag alloys are among the most effective ones. Ag has shown remarkable abilities to harden Pb anodes, offering them better resistance to H2SO4 attack. Researchers have done some studies about Ag mechanical effect on Pb anodes. It has been found that Pb hardness and Pb-Ag alloy structure essentially depend on the Ct of Ag. For Ct from 0.1 to 0.3 wt%, Pb-Ag structure is very similar to that of pure Pb 7. It has been found that Ag addition to Pb/PbO2 electrode significantly decreases OER surge and Ea, of which effect is stronger with higher Ct 8. 9 have discovered that Ct of 1 wt% Ag decreases Pb anodic corrosion. Because Ag is expensive, the authors have added small quantities of Ca to Pb-Ag, which has improved even more corrosion resistance. These results have been confirmed by other researchers who have found that alloys of Pb with 0.5 and 1% Ag are the only ones that can be widely used in industry, due to their better corrosion resistance 10-12. Also, Ag effect on pure Pb and Pb-Ca-Sn ternary alloy has been studied 14. The research has shown that 0.1% Ag has a delaying effect on overvoltage phenomena appearance, increasing Pb-Ca-Sn corrosion resistance in conditions that simulate the charge end, when Ag is added at a Ct of 0.05 wt% 13. Some researchers who have evaluated Pb anodes reactions in H2SO4 have concluded that, concerning corrosion resistance level, higher Ct of Ag offer better resistance to the alloy. They have classified certain alloys according to their corrosion resistance: Pb/Ag > Pb/Ca/Sn > Pb/In > Pb/Ag/Ca > Pb/Sb > Pb/Ca > Pb.
Prior to this work, the effect of P chemical compounds on the CR of Pb has been assessed. It has been proven that they strongly reduce the CR of Pb in batteries. The electrochemical and metallurgical behavior of Pb-Al alloys immersed in 4 M H2SO4 has also been studied. The results were remarkable, since it was possible to increase the battery lifetime up to 51.11%, by adding only 1.5% Al. Al-Pb also caused a decrease in Ipass, and in passivity bearing size (especially for Pb-1% Al). This means that Al facilitated PbO and PbSO4 transformation reactions into PbO2, which significantly reduces Pb-acid battery sulfation phenomena 15. T was also studied, and it has been found that its negative effect decreased, and that the battery lifetime was longer than that of pure Pb 16.
Herein, it was decided to study the effect of a different kind of addition, i.e., Ag at small quantities, on Pb corrosion and hardness. The difference between the previously published paper and the present work is that Ag is more resistant to corrosion than Al, since Pb-Ag alloy is more stable than the Pb-Al one. Therefore, the CR for Pb-1% Ag (17.13 mm/year) was lower than that obtained of Pb-1.5% Al (20.78 mm/year). The goal of this research was to study the electrochemical and metallurgical effect of Ag addition to Pb anodes in a H2SO4 environment similar to the battery electrolyte, to increase its life and improve its performance. Most research carried out on this subject has used gravimetric procedures. However, these methods do not provide enough information on the continuing evolution of corrosion phenomena, unlike polarization methods that instantly give CR 17. To evaluate Ag effect on Pb corrosion and mechanical stress resistance, PDP and EIS electrochemical methods, and OM and hardness metallurgical techniques were used.
Experimental procedures
Alloys preparation
The studied alloys were made of pure Pb and Ag (99.99%). They were Pb based with Ag addition at different Ct of 0.5, 0.8, 1 and 1.5%, respectively. In order to prepare these alloys, appropriate quantities of Pb and Ag were introduced in a silica glass tube of 1 cm diameter. Then, the tube was sealed under high vacuum to prevent Pb oxidation. The alloy and the tube were introduced in an oven at 500 ºC. After fusion and cooling, the assembly was soaked in cold water (≈10 ºC). The prepared alloys were studied right away, or preserved in liquid N.
To obtain reliable and reproducible results, before each test, the alloys were polished with 400, 600 and 1200 abrasive papers. Then, they were rinsed with distilled water and dried.
As shown in Fig. 1, Pb-Ag binary system presents a eutectic bearing at 304 ºC.

The composition of the eutectic liquid was approximately 2.5 wt% Ag. The solubility limit in eutectic T was 0.l wt% Ag. Before and after the alloys elaboration, the chemical composition of pure Pb and Pb-Ag alloys was analyzed, to determine the exact quantities of each element, including impurities. In doing so, portable Thermo Scientific Niton XL5 XRF spectrometer was employed. It is the newest and faster device that gives accurate results and exact composition on any metal surface. Each chemical composition represented in Table 1 is the result of a punctual analysis.
Table 1: Chemical composition of Pb and Pb-Ag alloys.
| Added Ag (%) | Pb(%) | Ag(%) | Al(%) | Sn(%) | Si(%) | P(%) | C(%) | Zn(%) |
|---|---|---|---|---|---|---|---|---|
| 0 | 99.448 | 0.510 | ---- | 0.010 | 0.002 | 0.030 | ---- | ---- |
| 0.5 | 99.100 | 0.800 | ---- | ---- | 0.002 | ---- | 0.093 | 0.000 |
| 0.8 | 98.893 | 1.010 | ---- | ---- | 0.001 | 0.086 | 0.010 | ---- |
| 1 | 98.447 | 1.510 | ---- | 0.015 | ---- | 0.027 | ---- | ---- |
| 1.5 | 99.448 | 0.510 | ---- | 0.010 | 0.002 | 0.030 | ---- | ---- |
Hardness
The physical properties of Pb alloys quenched solid solutions evolve from room T. Hardening mechanisms are continuous/discontinuous transformations. In fact, this T corresponds to 0.5 TF (alloy’s melting T: 330 ºC). It is known that, from 0.4 to 0.5 TF, the alloy elements can diffuse, whenever the discontinuous transformation kinetics is rapid at room T. The alloys used in this study were polished, soaked in a chemical solution consisting of one to three parts part of 30% H2O2 and glacial CH3COOH. The immersion process duration was varied from 20 s to 2 min, depending on the sample state. The chemical polishing was followed by repeated chemical attacks/etching using a mixture based on C₆H₈O₇ and H8MoN2O4.
Electrochemical techniques
A classic cell of 3 electrodes was used to carry out electrochemical measurements. Saturated calomel, Pt wire and a Pb sample were used as reference, auxiliary and working electrodes, respectively. Before each test, the sample was left under OCP, for 5 min, to achieve a steady state. PDP was carried out at a SR of 2 mV/s, in the range from -1500 to 2500 mV. Various kinetic parameters such as Icorr, Ecorr and Ipass were obtained. Icorr was measured by Tafel straight lines extrapolation. EIS measurements were carried out using a margin of frequency range from 100 kHz to 10 Hz, at Ecorr (450 mV). For the analysis, a 10 VoltaLab model (PGZ100) connected to an HP computer was used. Data acquisition and processing was performed by using VoltaMaster 4 and OriginLab software 16.
Results and discussion
Hardness
Fig. 2 represents Pb-Ag alloys hardness values evolution in comparison with those of pure Pb.
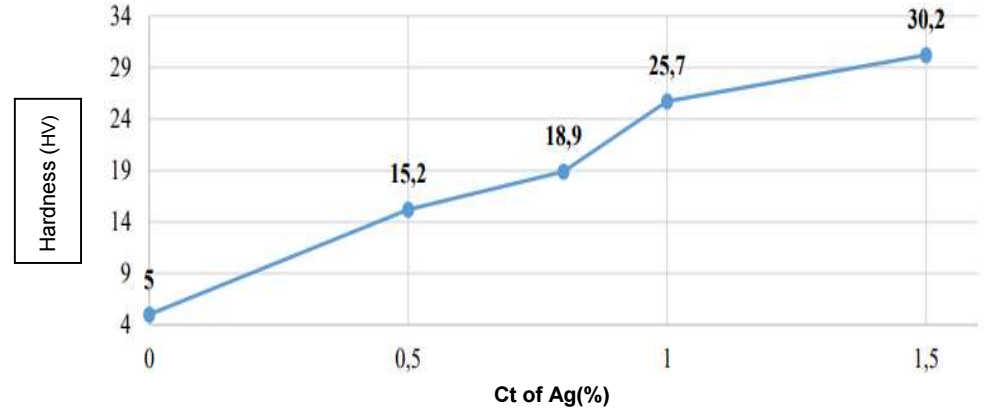
It is clearly seen that, with higher Ct of Ag, the alloy hardness increased, going from 5 HV, for pure Pb, up to 30.2 HV, for Pb-1.5% Ag. This effect was probably due to the decrease in the alloy grains initial size after Ag addition.
PDP
Ct of Ag effect on Pb corrosion
To study the electrochemical effect of Ag addition on the CR of Pb in 4 M H2SO4, PDP and EIS were used. To do so, four electrodes (Pb with 0.5, 0.8, 1 and 1.5% Ag) were prepared by the above described procedure. So as to study Ag effect, it was required to compare polarization curves and EIS diagrams obtained by Pb-Ag electrodes with those obtained by pure Pb immersed in 4 M H2SO4.
Fig. 3 shows polarization curves of pure Pb and Pb-Ag alloys with different Ct of Ag in 4 M H2SO4, at 25 ºC.
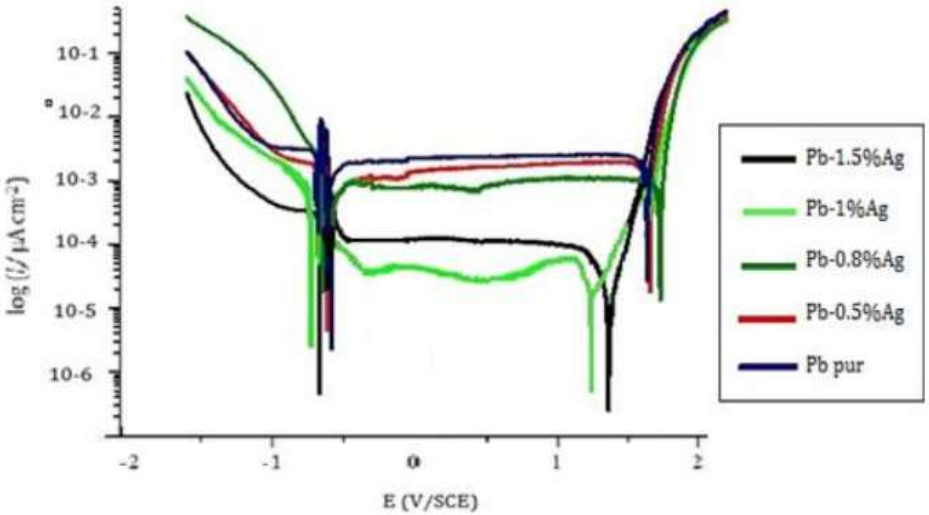
Tafel lines intersection points gave Icorr. Polarization parameters are shown in Table 2.
Table 2: Polarization curves parameters for Ag addition effect on Pb corrosion in H2SO4, at 25 ºC.
| Alloy | Ecorr1 (mV/SCE) | Ecorr2 (mV/SCE) | Icorr (µA/cm2) | Ipass (µA/cm2) | Etra (mV/SCE) | IE(%) |
|---|---|---|---|---|---|---|
| Pure Pb | -536 | -463 | 149 | 125 | 1896 | ----- |
| Pb-0.5% Ag | -520 | -460 | 120 | 107 | 1873 | 19.46 |
| Pb-0.8% Ag | -517 | -453 | 96 | 93 | 1770 | 35.57 |
| Pb-1% Ag | -493 | -421 | 19 | 17 | 1396 | 87.24 |
| Pb-1.5% Ag | -508 | -447 | 39 | 36 | 1483 | 73.82 |
The intense decrease in I at polarization curves beginning corresponds to HER. At this E margin, Pb is at the activation state. This oxidation resulted from the reaction between Pb and H2O:
 (1)
(1)
Ecorr2 corresponds to the reaction of Pb with H2SO4, which forms PbSO4, according to the following eq.:
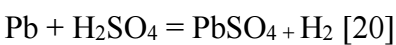 (2)
(2)
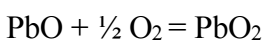
PbO and PbSO4 precipitate on the Pb surface, preventing H2SO4 infiltration, thereby inhibiting any reaction between Pb and the electrolyte. This is the passivation process phase represented by an Icorr bearing, which remains virtually constant for a given period of time. This phase ends with transpassivation. At this stage, the corrosion products (PbO and PbSO4) are transformed into PbO2, by reaction with H2O, as follows:
 (3)
(3)
 (4)
(4)
This transformation is indicated by a polarization peak characterized by Etra, followed by a strong increase in I that corresponds to OER.
By observing polarization curves in Fig. 3, and corresponding data in Table 2, it is seen that Ct of Ag up to 1% reduced Ecorr1 and Ecorr2 from -536 to -493 and -463 to -421 mV, respectively, which means that Pb was protected from corrosion. Also, Ag addition strongly reduced Icorr from 149 to 19 µA/cm2, and Ipass from 125 to 17 µA/cm2, indicating that, at this Ct, Pb corrosion resistance significantly increased. The rate of impermeable elements that turns Pb into a passive mode also decreased and, consequently, the battery lifetime increased. This can be concluded from higher IE(%) of 87.24% after adding 1% Ag (as shown in Fig. 4), which confirms that the battery lifetime will be significantly longer.
18 has done some research on the effect of Ag and Ca addition on Pb corrosion in H2SO4. The author has found that the alloy with the best IE(%) was Pb-1% Ag. Also, 19 has found that this quantity of Ag has given the alloy the best resistance to corrosion.
By adding 1% Ag, Pb oxidation to PbSO4 was strongly inhibited. This can be associated to the fact that the anodic film higher density prevents atoms at the PbSO4 membrane from accessing O.
Etra decreased with the increase in the Ct of Ag up to 1%, meaning that the metal facilitated PbO2 formation followed by OER. As polarization curves in Fig. 3 show, Ag had no noticeable effect on OER.
Fig. 4 illustrates the increase in IE(%) as a function of Ct of Ag.
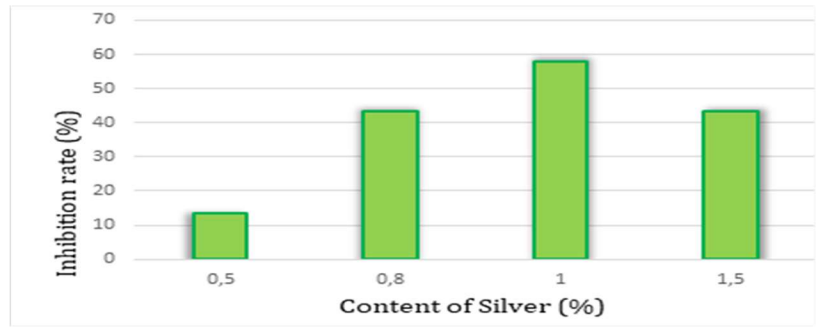
IE(%) was calculated using the equation:
 (5)
(5)
where CR’ and CR are the pure Pb and the alloy CR, respectively.
Etra bearing decreased with the increase in the Ct of Ag, which means that the metal facilitated PbSO4 and PbO conversion into PbO2. This decrease was followed by OER. The parts of polarization curves which indicate these reactions did not change, i.e., Ag had no significant effect on OER.
Effect of T on pure Pb and Pb-Ag alloys
The maximum T that a Pb-acid battery can achieve is approxim. 80 ºC. That is why it was necessary to study T effect on Pb and Pb-Ag alloys at different Ct.
Fig. 5(a) shows Pb polarization curves in H2SO4 at T range from 25 to 80 ºC, while Table 3 shows polarization parameters.
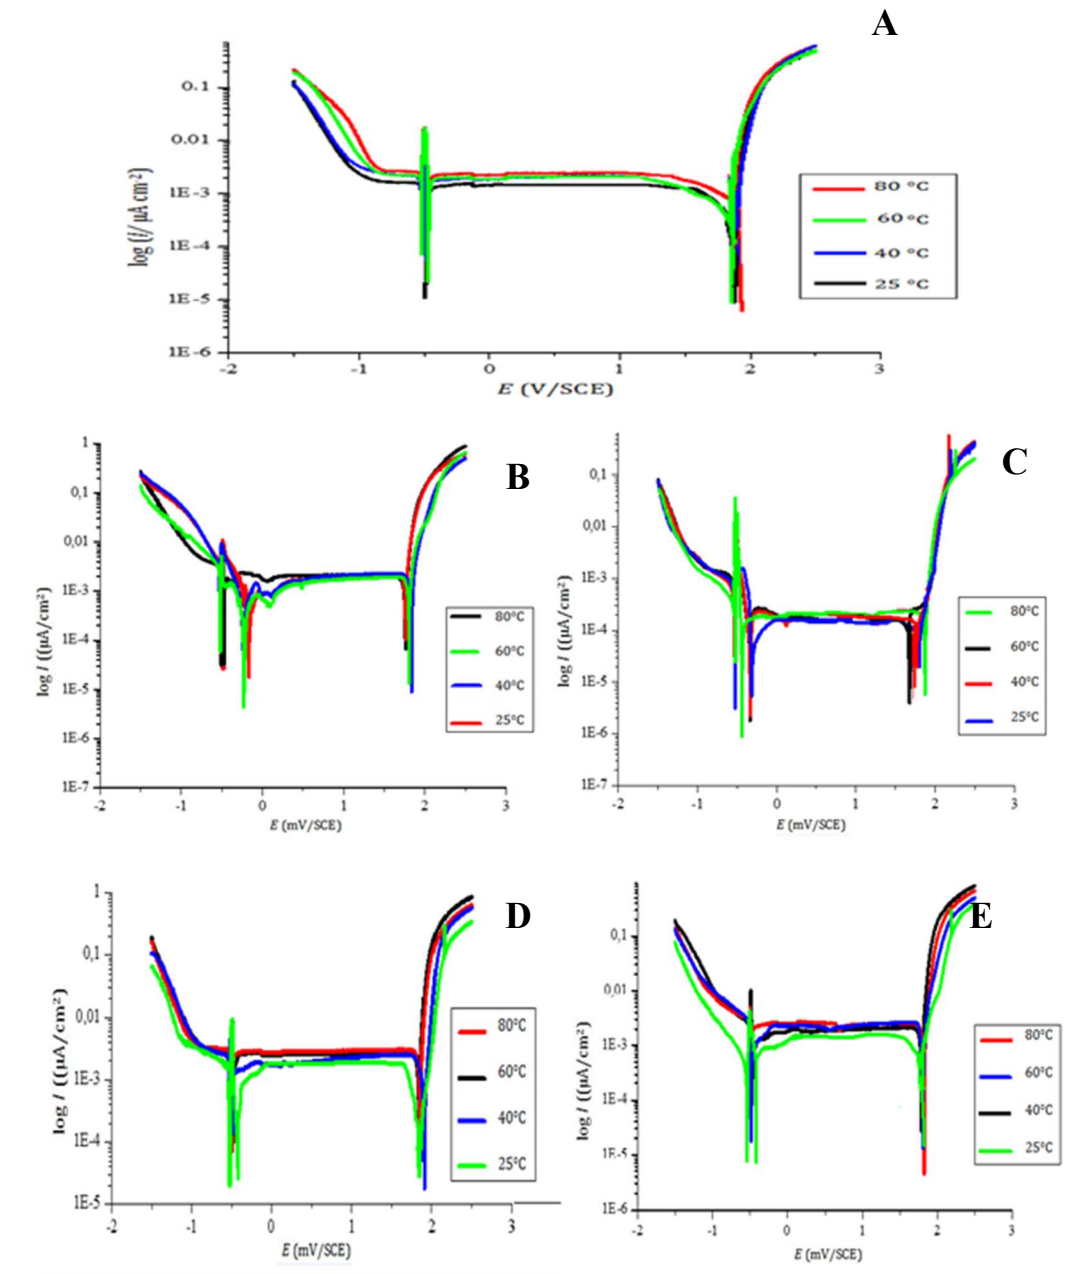
Figure 5: Polarization curves of T effect on Pb in 4 M H2SO4 - (A) pure; and with (B) 0.5% Ag; (C) 0.8% Ag; (D) 1% Ag; and (E) 1.5% Ag.
It can be seen that the increase in T from 149 to 162 µA/cm2 had a significant effect on Icorr. This means that the battery lifetime shortened every time T was risen inside it. The small fluctuations noticed in other parameters might have been due to the analysis conditions.
According to the obtained results, which are represented in Fig. 5 (b, c, d, e) and Table 3, it is clearly seen that Ag addition had no negative effect on Pb when T was increased up to 80 ºC. On the contrary, fluctuations in Icorr decreased for alloys containing from 0.5 to 1% Ag.
Table 3: Polarization curves parameters of T effect on pure Pb and Pb-Ag alloys in 4 M H2SO4.
| Alloy | T (ºC) | Ecorr1 (mV/SCE) | Ecorr2 (mV/SCE) | Icorr (µA/cm2) | Ipass (µA/cm2) | Etra (mV/SCE) | IE(%) |
|---|---|---|---|---|---|---|---|
| Pure Pb | 25 | -536 | -463 | 149 | 125 | 1896 | ----- |
| 40 | -537 | -466 | 151 | 135 | 1881 | ----- | |
| 60 | -541 | -474 | 157 | 139 | 1889 | ----- | |
| 80 | -548 | -479 | 162 | 186 | 1864 | ----- | |
| Pb-0.5%Ag | 25 | -520 | -460 | 120 | 107 | 1873 | 19.46 |
| 40 | -521 | -460 | 122 | 109 | 1874 | 18.12 | |
| 60 | -521 | -461 | 122 | 109 | 1875 | 18.12 | |
| 80 | -521 | -461 | 123 | 110 | 1875 | 17.44 | |
| Pb-0.8%Ag | 25 | -517 | -453 | 96 | 93 | 1770 | 35.57 |
| 40 | -517 | -453 | 96 | 93 | 1772 | 35.57 | |
| 60 | -517 | -454 | 97 | 95 | 1772 | 34.89 | |
| 80 | -518 | -454 | 97 | 95 | 1773 | 34.89 | |
| Pb-1%Ag | 25 | -493 | -421 | 19 | 17 | 1396 | 87.24 |
| 40 | -493 | -421 | 19 | 17 | 1398 | 87.24 | |
| 60 | -493 | -421 | 19 | 17 | 1400 | 87.24 | |
| 80 | -493 | -422 | 19 | 17 | 1401 | 87.24 | |
| Pb-1.5%Ag | 25 | -508 | -447 | 39 | 36 | 1483 | 73.82 |
| 40 | -509 | -448 | 39 | 36 | 1484 | 73.82 | |
| 60 | -509 | -448 | 39 | 36 | 1484 | 73.82 | |
| 80 | -510 | -448 | 39 | 36 | 1486 | 73.82 |
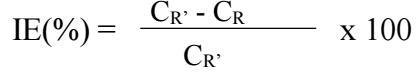
Some conclusions about the inhibition action mechanism can be taken by comparing measured Ea with and without inhibitor. Fig. 6 represents Arrhenius coordinate plot for CR of Pb in 4 M H2SO4 with and without Ag.

Ipass, Ecorr1, Ecorr2, Etra and CR remained practically constant, and, consequently, also the battery lifetime. To be able to study T influence on the corrosion inhibition process, many authors have used Arrhenius equation:
 (6)
(6)
 (7)
(7)
where k and k’ are constants (Arrhenius’s pre-exponential parameters), E’a is Ea with inhibitor and R is universal gas constant. T is in Kelvin.
The variation in icorr logarithm, as a function of T-1, indicates that Arrhenius law was obeyed, which was confirmed by R2 and R2' > 0.90 good linearity.
Ea values were obtained from the slopes of Ln (Icorr) lines, as a T-1 function. These values are given in Table 4.
Table 4: Ea values for pure Pb and Pb-1% Ag in 4 M H2SO4.
| Sample | Ea (kJ/mol) |
|---|---|
| Pure Pb | 11.81 |
| Pb-1%Ag | 24.70 |
Table 4 shows that Ea value decreased after 1% Ag addition. This behavior is due to the presence of a solid solution phase that increased Ea barrier for corrosion, and therefore, decreased the alloy CR. These results reinforce those obtained for the decrease in the CR of Pb after Ag addition.
EIS
Ct of Ag effect on CR of Pb
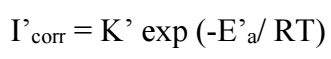
Fig. 7 shows Nyquist representations of pure Pb and Pb-Ag alloys in 4 M H2SO4, at 25 ºC. Rct and Cdl values at Ecorr = -536 mV/ECS are listed in Table 4.
Nyquist representations in Fig. 7 have the shape of a unique semi-circle, which means that the main reaction mechanism present at Cdl was Rct. With an increase in the Ct of Ag up to 1%, it is seen that the semi-circles diameter was wider. This indicates a stronger corrosion resistance at this Ct of Ag. As shown in Table 5, Rct increased from 18 to 150 ohm/cm2 with a raise in Ag up to 1 wt%, while Cdl decreased from 75 to 9 µF/cm2. This reveals that the CR of Pb decreased and, consequently, its lifetime increased. Beyond this Ct, CR began to increase again 16.
Conclusions
The results of the present study on the electrochemical and metallurgical effect of Ag addition to Pb can be resumed as following: Ag addition up to 1.5% enhanced Pb hardness from 5 to 30 HV; Ag addition up to 1% reduced Icorr, increasing the battery lifetime; Ag decreased I pass, i.e., it facilitated PbO and PbSO4 oxidation to PbO2; Pb-1% Ag alloy proved to be the most resistant to corrosion. The battery lifetime became two times longer; the reaction mechanism that governs the metal surface is Rct mechanism; every time T rises inside the Pb-acid battery, the CR of its grids increases, but Ag addition up to 1 wt% significantly reduced this effect.
Authors’ contributions
Salma Khatbi: carried out the experiments and wrote the manuscript. Youssef Gouale: provided metals for the alloys elaboration. Abdeslam Lamiri and Mohamed Essahli: gave directions and necessary resources for this project.
Statements and declarations
On behalf of all authors, the corresponding author states that there was no conflict of interest.
Abbreviations
Ag: silver
Al: aluminum
C₆H₈O₇: citric acid
Ca: calcium
Cdl: double layer capacitance
CH3COOH: acetic acid
CR: corrosion rate
Ct: concentration
E: potential
Ea: activation energy
Ecorr: corrosion potential
EIS: electrochemical impedance spectroscopy
Etra: transpassivation potential
H2O: water
H2O2: hydrogen peroxide
H2SO4: sulfuric acid
H3PO4: phosphoric acid
H8MoN2O4: ammonium molybdate
HER: hydrogen evolution reaction
I: current
Icorr: corrosion current density
IE(%): inhibition efficiency
In: indium
Ipass: passivation rate
N: nitrogen
O: oxygen
OCP: open circuit potential
OER: oxygen evolution reaction
OM: optical microscopy
P: phosphorous
Pb: lead
PbO: lead oxide
PbO2: lead dioxide
PbSO4: lead(II) sulfate
PDP: potentiodynamic polarization
Pt: platinum
R2: correlation coefficient
Rct: charge transfer resistance
Sb: antimony
Si: silicon
Sn: tin
SR: scan rate
T: temperature
TF: temperature on the Fahrenheit scale
XRF: X-ray fluorescence spectrometer
Zn: zinc

