




 Inglês (pdf)
 Artigo em XML
 Referências do artigo
 Tradução automática
 Enviar este artigo por email
 Citado por SciELO
  Similares em
SciELO
Similares em
SciELO 
 Permalink
Introduction
Surface quality is an essential requirement in mechanical engineering due to its impact on product performance. Surfaces characteristics highly influence materials ability to withstand stress, temperature, friction and corrosion 1.
SR plays an important role for the tribological operation of any component. SR characteristics are: center line Ra; root mean square roughness- Rq; skewness- Rsk; kurtosis- Rku; and mean line peak spacing- Rsm2.
In order to reduce SR and enhance materials mechanical properties, the present study researched electroless coating using CCD. Electroless coating is a chemical reduction process in which chemical composition is used for metals deposition without the use of electricity 3. The main goal of this deposition process is to increase corrosion, wear and abrasion resistance by reducing SR of the Cu substrate material.
Among all coatings, Ni-P is the most common type of electroless coating 4. In order to further improve the properties of electroless Ni-P coatings, several ternary Ni-X-P coatings have been developed, where X is typically a transition metal such as W, Co, Mn, Mo, Cu and Re.
The present study focused on W alloy in electroless Ni-P coating, because it exhibits unique properties such as high melting point and hardness 5-6. It was seen that about 3.8 wt.% W was co-deposited with Ni, which caused a reduction in P content of the deposit from 8.9 to 2.3 wt.%, and resulted in a crystalline structure of the film 7. It was confirmed that W co-deposition in a Ni-P matrix reduces P content of the deposit and alters the crystal structure, according to 7-8.
Herein, SR measurements were taken before and after coating deposition. Specimens with almost equivalent SR values were used in wear and friction tests. Measurements were taken using Talysurf profilometer (Surtronic 3+, Taylor Hobson) 9-10, which was is equipped with a diamond stylus having a tip radius of 5 μm, and used 0.8 and 4 mm traversing and sampling lengths, respectively.
SR measurements on the coated samples were repeated at least four times and an average of four values were recorded. The results showed that SR and friction coefficient were dependent of the Ct of W in the film. It is possible that an increase in the Ct of W may promote a decrease in SR. The smoothest surfaces yielded friction coefficient lowest values in as-deposited coatings. A nodular structure, with a cauliflower shape, is often associated with a reduced friction coefficient 11-12.
At lower Ct of the surfactant, the surface finish was poor, but it significantly improved when the Ct exceeded 0.6 g/L. 13-14. It was found that the nodular nature of the electroless coatings shown by SEM was responsible for a surface profile rougher than sputtered coatings 15.
Optimization of the process parameters is the major challenge in experimental work to save labor, materials and money, as well as to obtain an improved response. So, the latest and advanced statistical tools must be adopted within the investigation boundary conditions.
RSM is a highly advanced DoE technique, which includes statistical formulation for developing a model and analyzing a process which aims to optimize the desired response controlled by multiple input parameters 16-17. Employing a relatively small number of experiments, RSM can be used to map a design space. CCD method alone is satisfactory enough for handling single goal problems, but not acceptable to deal with multi objective issues. These multi objective challenges are normally solved by assigning individual weights to the responses according to priority. In all, these theories are assigned based on assumptions, which may lead to uncertainty in results 18-20.
In this study, FL approach was used to overcome all these assumptions, and to clear up any doubts. It is a method that gives values for areas where there are no clear borderlines among variables, and which supports the decision-making process. This theory was introduced by 21, in 1965. FL is widely employed to build inference systems that support decisions making and management of the manufacturing system 22. It is a mathematical theory of inexact reasoning which allows modelling of human intellectual processes in linguistic terms 23. FL is based on intuition and judgment, and it does not need a mathematical model to construct theories 24.
The existing research in Ni-W-P electroless coating has primarily focused on optimizing the deposition process and exploring materials properties. However, a significant research gap exists in comprehensively addressing the SR of coated substrates. Limited attention has been given to systematic investigation and optimization of the parameters affecting SR in Ni-W-P electroless coatings. This gap hinders the knowledge of how to effectively reduce SR, which is crucial for enhancing functional and mechanical properties of coated materials.
The aim of this research was to optimize the parameters of Ni-W-P electroless coatings for reducing SR of the Cu substrate. This optimization was achieved by employing both CCD and FL approaches, with a subsequent comparison of the results, to attain the lowest SR. The coating elements that underwent the optimization process included Na2WO4.2H2O, NaH2PO2.H2O and NiSO4.6H2O.
Experimental details
Cu sheets (Cu with 99% purity, procured from Lobochemie Pvt ltd.) with the dimensions 20 × 15 × 0.1 mm were used as substrates for the deposition of electroless Ni-W-P coatings. The prepared Cu samples were exposed to surface pre-treatment before immersion in the electroless bath samples, to remove the oxide layer and carbonized hydrocarbon formation. For this purpose, the samples were rinsed with distilled water for 2 min, and then cleaned with 25% diluted HCl, for 10 min, at room temperature. Activation is also a very important step of samples preparation. Herein, the specimens were activated with a PdCl2 solution, for 8-10 s, at 55 °C, followed by rinsing with distilled water, for a few seconds. After surface activation, the samples were immersed in the Ni-W-P electroless bath. The electroless bath composition is shown in Table 1.
CCD
CCD is an effective tool of DoE which evaluates the individual effect of each process parameter on the responses, by conducting a minimum number of experiments 8. S/N ratio finds the best level of each parameter for a particular response based on qualitative characteristics such as lower the better, higher the better and nominal the better 9. Irrespective of the chosen qualitative characteristics for a particular response, the levels with higher S/N ratios for the corresponding factors are deemed to be optimal for that particular response. Contour and surface graphs are often used to explain both linear and nonlinear mixing complexities of mixed components. In RSM technique, CCD: offers more understanding than that of the three factorial designs; and it needs less experimental runs, despite showing significant optimization for most stable processes. CCD is the most widely used RSM and includes a factorial or factorial fractional design with center points, supported by a group of axial points 27.
The experiment was based on CCD to study the combined effects of three independent variables: Na2WO4.2H2O, NaH2PO2.2H2O and NiSO4.6H2O. A total of 20 runs, 3 factors and 3 levels of factorial CCD were used to optimize the SR of Ni-W-P electroless coating using Design Expert Software. To establish the importance of individual process parameters and their interactions, a regression equation was formulated, which estimates the correlation between responses and input process parameters.
S/N ratio is a valuable tool in experimental design, to assess and optimize the relationship between input parameters and response variables based on qualitative characteristics. The specific calculation of S/N ratio formula will vary depending on the qualitative characteristic, and whether ones wishes to minimize, maximize or reach a target value for a given response variable.
S/N ratio is calculated based on specific qualitative characteristics associated with the response variable. These characteristics depend on the response nature. There are typically three categories: lower the better- in situations where the goal is want to minimize the response (e.g., SR), where a lower S/N ratio indicates a better outcome; higher the better- conversely, in cases where the aim is to maximize the response (e.g., yield or tensile strength), where a higher S/N ratio indicates a better outcome; and nominal the better- in some cases, the objective may be to obtain response that is close to a target value, neither too far nor too near. Herein, lower the better S/N ratio was preferred, if it was closer to the target value.
FL interference system
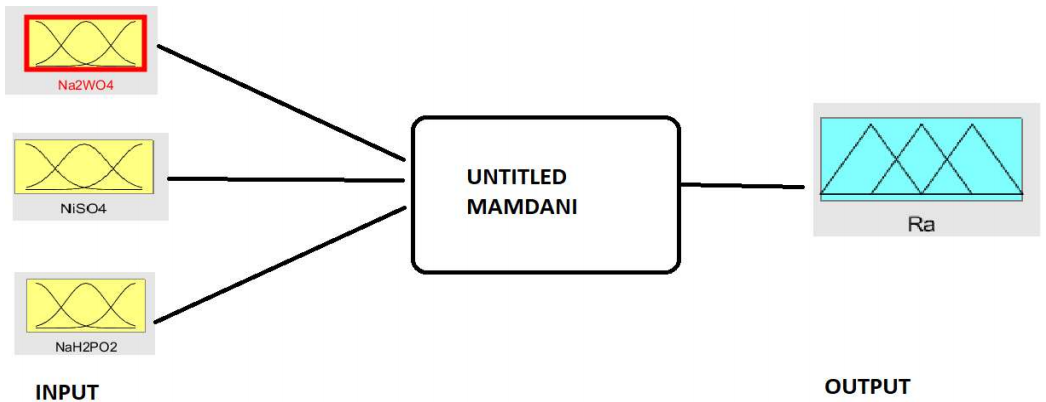
FL is an artificial intelligence technique which has proved to be a very useful tool for modelling and analysing complex inter-relationships between process parameters and response variables 18. Fuzzy modelling is comprised of three steps that include fuzzification, rule framing and defuzzification processes. In the first stage, fuzzification process is done. With the help of connection description, each factor and a well-defined numeric value are preserved 23-24. In the second stage, rules are considered by the combination of parameters using logical operators. Finally, defuzzification is done in which all connection degrees are turned into a quantifiable value by combining outputs of the framed rules 25-26. Variables, i.e., Na2WO4.2H2O, NaH2PO2.H2O and NiSO4.6H2O, are taken as inputs in the fuzzy inference system, where SR is considered as output (Fig. 1). A fuzzy-based rule is defined, which predicts SR in the fuzzy domain, and the fuzzy interference engine is considered as “Mamdani”. Mamdani shows relatively better results 27. Therefore, in modelling the algorithm, the system outputs are calculated based on the centroid method, and Mamdani implication is used for defuzzification 28-29.
Results and discussion
The roughness measurements are quoted in terms of SR values. SR values refer to parameters that characterize Ra. Ra value is defined as the arithmetic mean of the absolute values of the distances from the mean line of the valleys and the peaks 13. There were total 20 runs that were conducted in the CCD design. Based on the different parameters, Ra reading was calculated with the help of Talysurf profilometer. Ra experimental results for different sets of experiments as coded forms are given in Table 2.
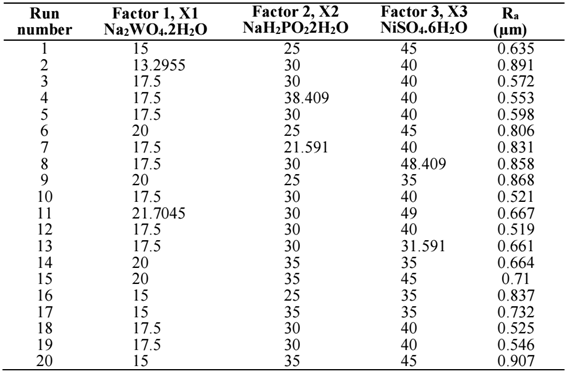
The final CCD obtained for Ra with significant terms was quadratic in actual and coded equation. To evaluate the relationship between response and variables, the following regression equation for deposited Ra in terms of actual factors is given as follows:
Final equation in terms of actual factors
 ()1
()1
Through this regression equation, we will be able to get the response value of each parameter.
Optimization of parameters for R a through mathematical calculation
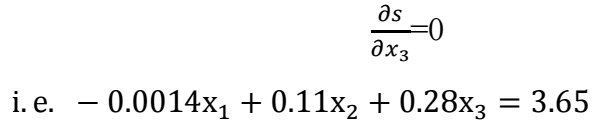
In order to optimize the process parameters and the response (Ra), we can use the equation 3.1. The optimum values for process parameters can be obtained by differentiating the equations w.r.t. x 1 ∗ , x 2 ∗ and x 3 ∗ . The equation that we get is 3.1a,3.1b and 3.1c given below:
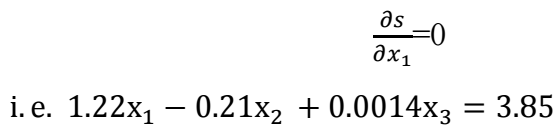 ()2
()2
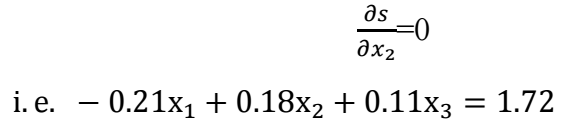 ()3
()3
 ()4
()4
Using equation 1, 2 and 3, one obtains the following optimum solutions of 𝑥 1 ∗ , 𝑥 2 ∗ 𝑎𝑛𝑑 𝑥 3 ∗ , as given below, equation 4:
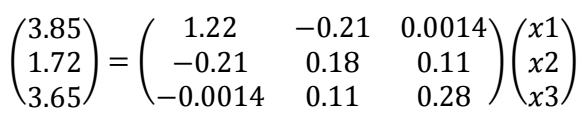 ()5
()5
Solving the above matrix, the optimized value for 𝑥 1 ∗ , 𝑥 2 ∗ 𝑎𝑛𝑑 𝑥 3 ∗ can be considered as equation 6:
 ()6
()6
Since the bath volume was 250 mL, when converting the value of 𝑥 1 ∗ , 𝑥 2 ∗ 𝑎𝑛𝑑 𝑥 3 ∗ into gm/L, one obtains: Na2WO4.2H2O = 19.04 gm/L; NaH2PO22H2O = 37.52 gm/L; and NiSO4. 6H2O = 37.52 gm/L.
Putting the value of 𝑥 1 ∗ , 𝑥 2 ∗ 𝑎𝑛𝑑 𝑥 3 ∗ in equation 5, the optimum response for Ra is 0.522 µm.
ANOVA for Ra
From Table 3, F and p-value can be analysed.
Table 3: ANOVA for response Ra quadratic model.
| Source | Sum of squares | DF | Mean square | F value | p-value | Prob > F |
|---|---|---|---|---|---|---|
| Model | 0.30 | 9 | 0.034 | 6.17 | 0.0044 | significant |
| A-X1 | 0.014 | 1 | 0.014 | 2.61 | 0.1374 | |
| B-X2 | 0.026 | 1 | 0.026 | 4.86 | 0.0520 | |
| C-X3 | 6.087E-003 | 1 | 6.087E-003 | 1.12 | 0.3146 | |
| AB | 0.027 | 1 | 0.027 | 5.02 | 0.0490 | |
| AC | 1.513E-005 | 1 | 1.513E-005 | 2.785E-003 | 0.9589 | |
| BC | 0.029 | 1 | 0.029 | 5.41 | 0.0423 | |
| A2 | 0.10 | 1 | 0.10 | 19.23 | 0.0014 | |
| B2 | 0.043 | 1 | 0.043 | 7.85 | 0.0188 | |
| C2 | 0.088 | 1 | 0.088 | 16,24 | 0.0024 | |
| Residual | 0.054 | 10 | 5.430E-003 | |||
| Lack of fit | 0.049 | 5 | 9.826E-003 | 9.50 | 0.0137 | significant |
| Pure error | 5.171E-003 | 5 | 1.034E-003 | |||
| Corr total | 0.36 | 19 |
Model F-value of 6.17 implies that the model is significant. There is only a 0.44% chance that a "Model F-Value" this large could occur due to noise. Model p-value of 0.0044 also implies the model is significant. P-values less than 0.0500 indicate model terms are significant.
In this case, AB, BC, A2, B2, C2 are significant model terms. Values greater than 0.1000 indicate that the model terms are not significant. Lack of fit F-value of 9.50 implies that it is significant. There is only 1.37% chance that a lack of fit F-value this large could occur due to noise.
Table 4 shows R2 of 0.8475, which is is considered to be a significant value in order to proceed with the design for further analysis. AP measures S/N ratio. A ratio greater than 4 is desirable. Herein, S/N ratio of 6.894 is adequate. This model can be used to navigate the design space. Considering the values of all ANOVA statistical parameters, the model results were found to be significant in this work.
Discussion on 3-D and contour plot for R a
Fig. 2 shows the second-order 3D response surface plot along with the contour plot of Ra as a function of Ct of Na2WO4.2H2O and NaH2PO2.2H2O, keeping NiSO4.6H2O constant. SR plot in Fig. 2(a) indicates that it rose with an increase in the Ct of Na2WO4.2H2O and of NaH2PO2.H2O. Fig. 2(b) shows SR along with contour plot as a function of Ct of Na2WO4.2H2O and NaH2PO2.2H2O. This contour plot indicates that the surface was not symmetric and that peaks were not in the center.
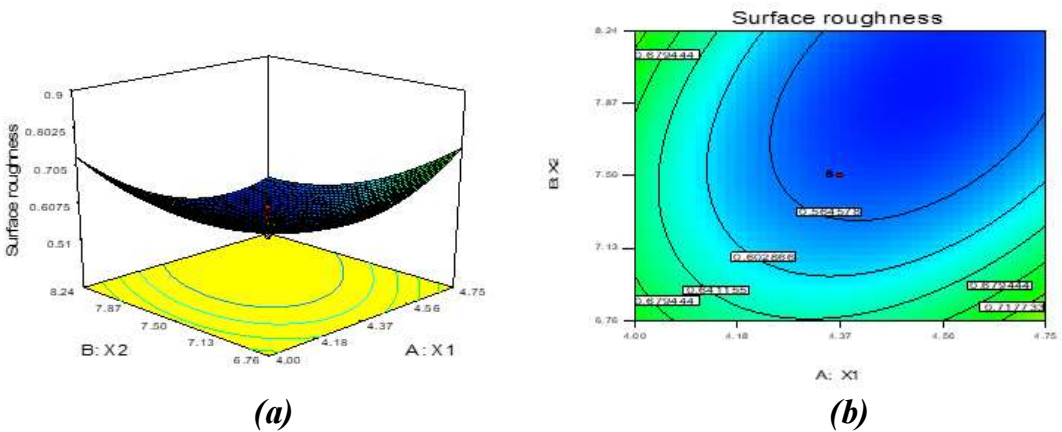
Figure 2: Second order 3-D and contour plot showing interaction effect of X1 and X2 with response to SR.
Fig. 3 shows second-order 3D response surface plot along with SR contour plot as a function of Ct of Na2WO4.2H2O and NiSO4.6H2O, keeping NaH2PO2.2H2O constant.
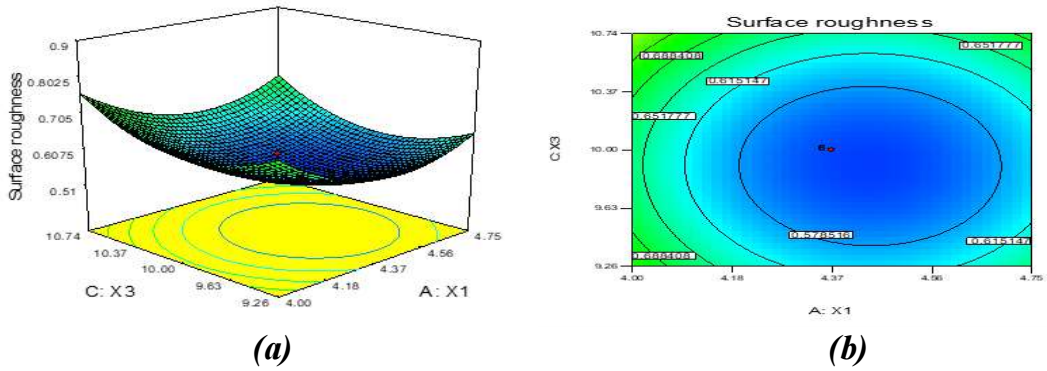
Figure 3: Second order 3-D and contour plot showing interaction effect of X1 and X3 with response to SR.
Fig. 3(a) shows that SR remained constant with Ct of Na2WO4.2H2O, but decreased with the rise in Ct of NiSO4.6H2O. Fig. 3(b) shows that the peak surface is symmetric and that peaks are in the center. Therefore, the interaction between X1 and X3, keeping X2 constant, had significant results.
Fig. 4 shows the second-order 3D response surface plot along with the contour plot of SR, as a function of Ct of NaH2PO2.2H2O and NiSO4.6H2O, keeping Na2WO4.2H2O constant.
Figs. 2-4 show that the interaction between X1 and X3, keeping X2 constant, had a more significant response than the other two, and that SR parameters had great response.
Fig. 4(a) shows that SR decreased at high rate with Ct of NaH2PO2.2H2O, but did not show much changes in deposition with the rise in Ct of NiSO4.6H2O. Fig. 4(b) shows that the peak surface was not symmetric and that peaks are not in the center. Interaction between X2 and X3, keeping X1 constant, did not indicate significant results.
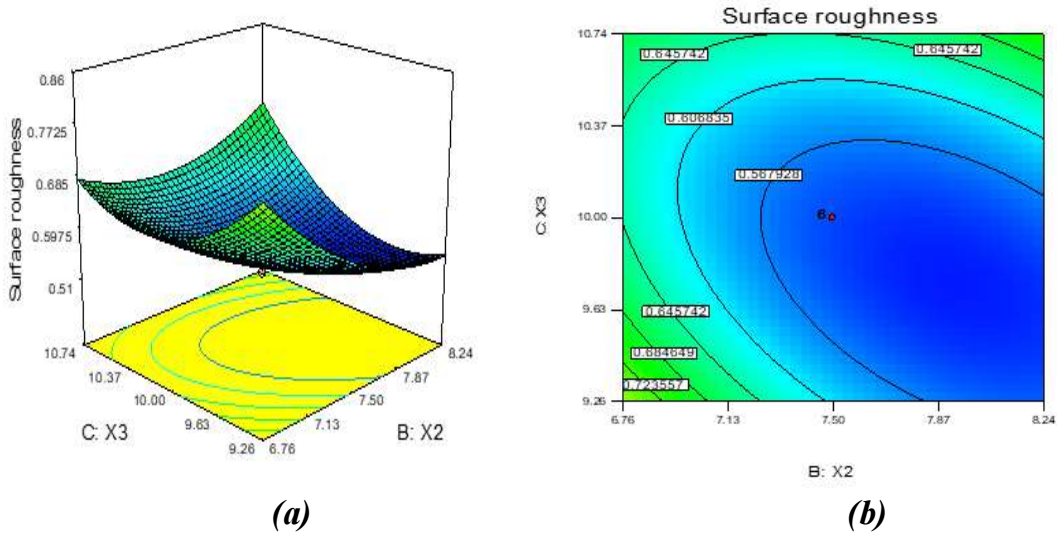
Figure 4: Second order 3-D and contour plot showing interaction effect of X2 and X3 with response to SR.
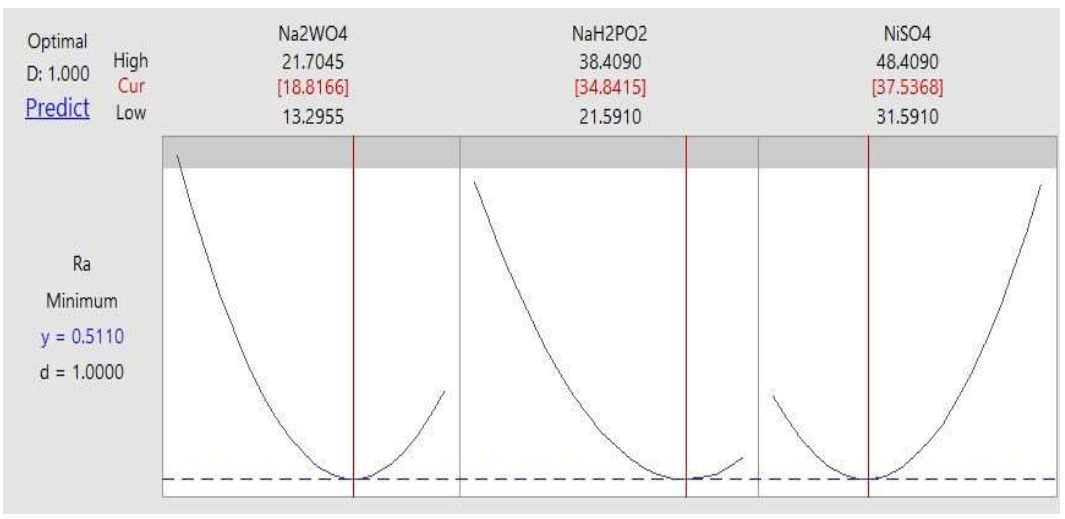
Fig. 5 shows optimized parameters: Na2WO4.2H2O = 18.8166 gm/L, NaH2PO2.2H2O = 34.8415 gm/L and NiSO4.6H2O = 37.5368 gm/L. The optimum response for SR was 0.511 µm.
Fuzzy modelling for SR
From the aforesaid CCD analysis, it is apparent that the electroless Ni-W-P ternary alloy coatings on the Cu substrate produced lower SR. Therefore, experimental data of the electroless Ni-W-P alloy coating were used for the fuzzy-based algorithm to predict SR at different process parameters. In this regard, a conceptual framework based on FL algorithm was designed in MATLAB®(R2018b) (Figs. 6, 7,8, 9). Triangular MF was considered in this study. In the developed algorithm, the input and output variables were fuzzified into three fuzzy sets: low (L), medium (M) and high (H). The input variables and output variables are shown in Figs. 6, 7,8, 9.
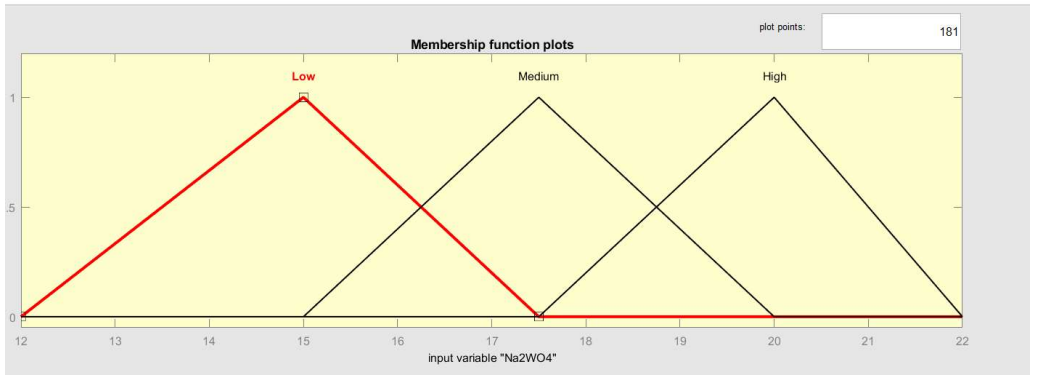
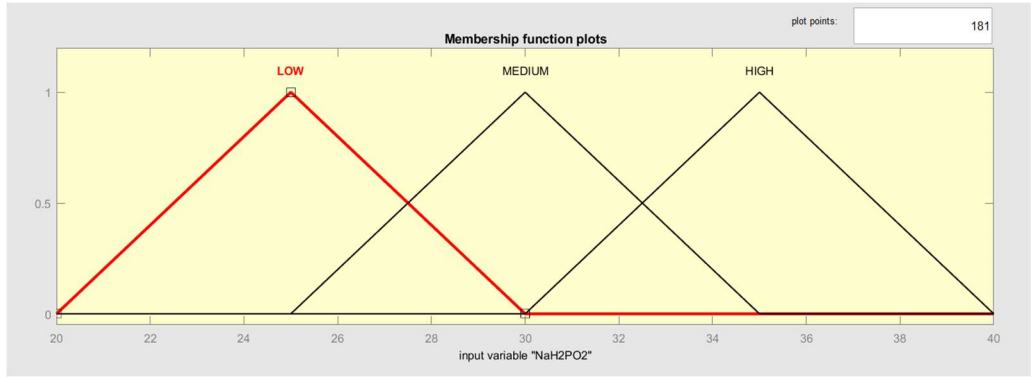
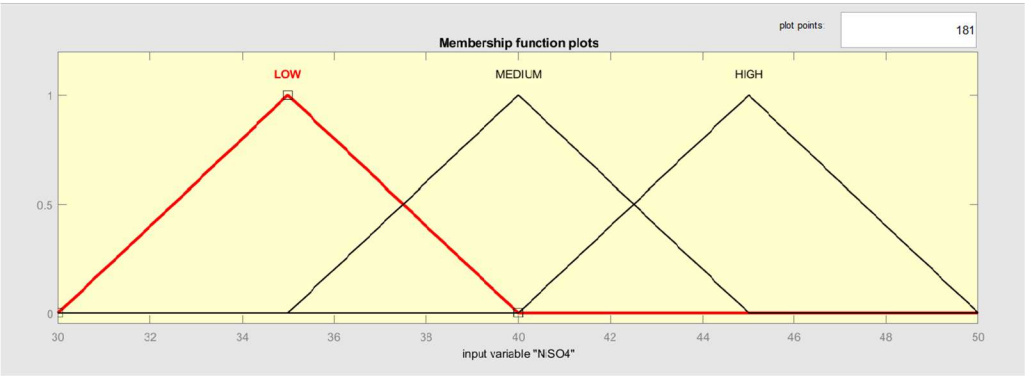
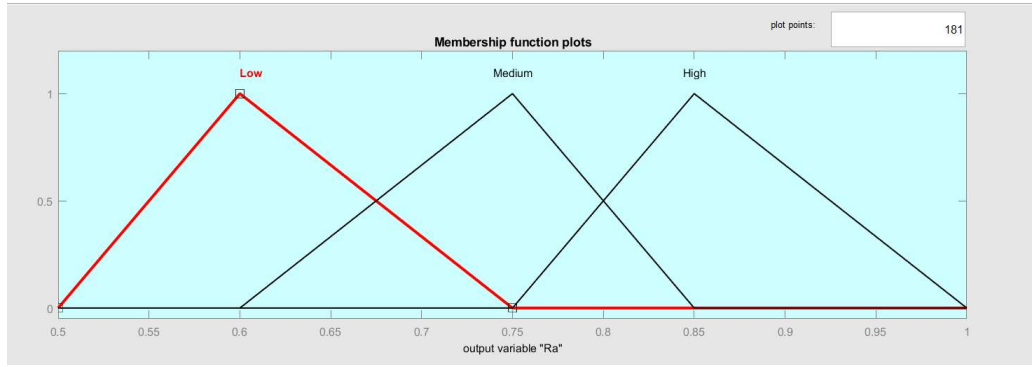
The detailed parameters of fuzzy inference system with triangular MF are given in Table 5.
Fuzzy rule SR graph
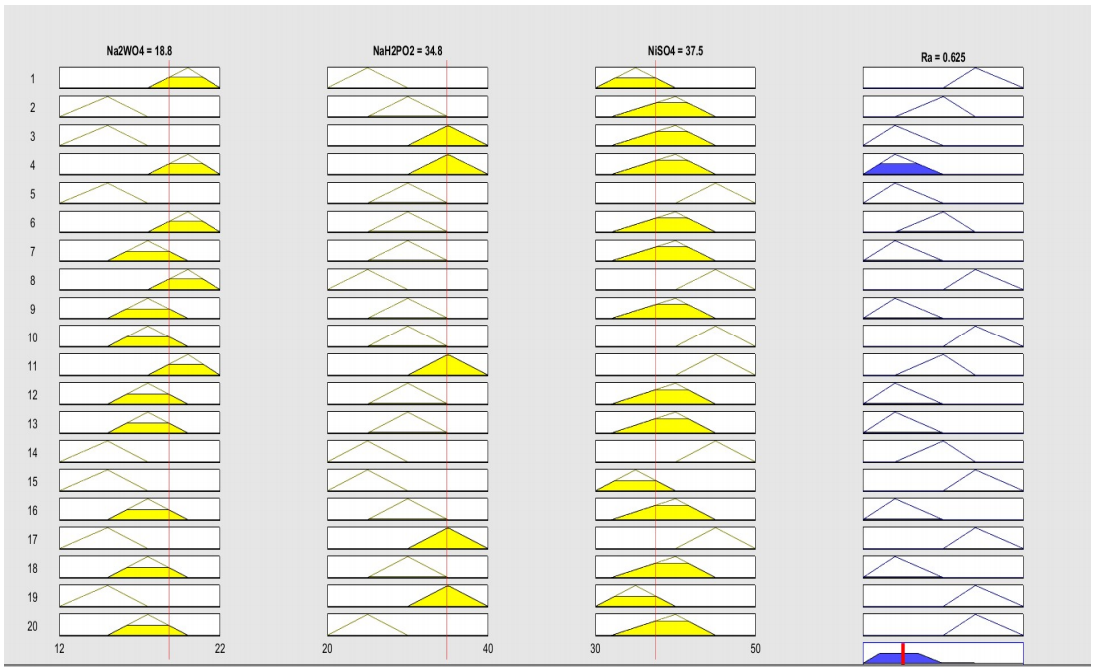
Fig. 10 shows FL graph. The yellow-coloured triangles of the input variables indicate the MF to which the input value belongs. Blue colour triangle of SR indicates the MF of output value yield from the input values of the system based on the adapted fuzzy rules. SR prediction value used the input parameters: Na2WO4.2H2O = 18.8 gm/L; NaH2PO2.2H2O = 34.8 gm/L; and NiSO4.6H2O = 37.5 gm/L. The output SR value was 0.625 µm.
Surface view of SR
Surface view of SR against NaH2PO2.2H2O and Na2WO4.2H2O is plotted in Fig. 11. Steep slopes of contrasting nature of SR are observed when Na2WO4.2H2O is higher. When NaH2PO2.2H2O is increased, SR decreases. A plane SR corresponding to 0.650 µm and lower was observed.
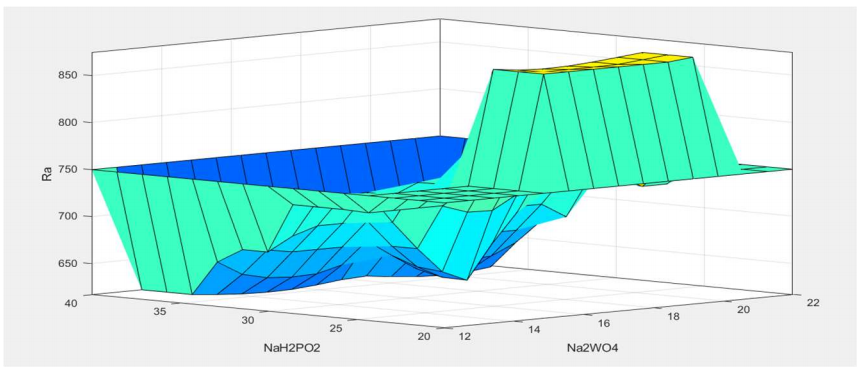
Fig. 12 shows that, with an increase in NiSO4.6H2O to 40 gm/L, SR drastically decreased. However, with an increase in Na2WO4.2H2O, SR increased. Similarly, in Fig. 13, SR decreased when NaH2PO2.2H2O and NiSO4.6H2O ranged from 25 to 30 gm/L and 35 to 40 gm/L, respectively.
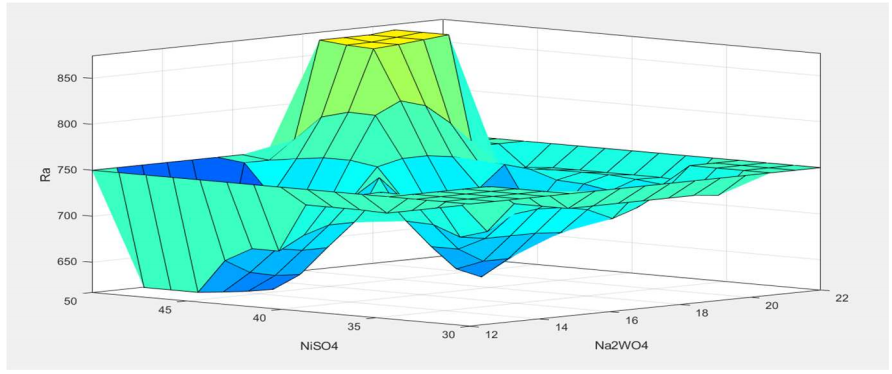
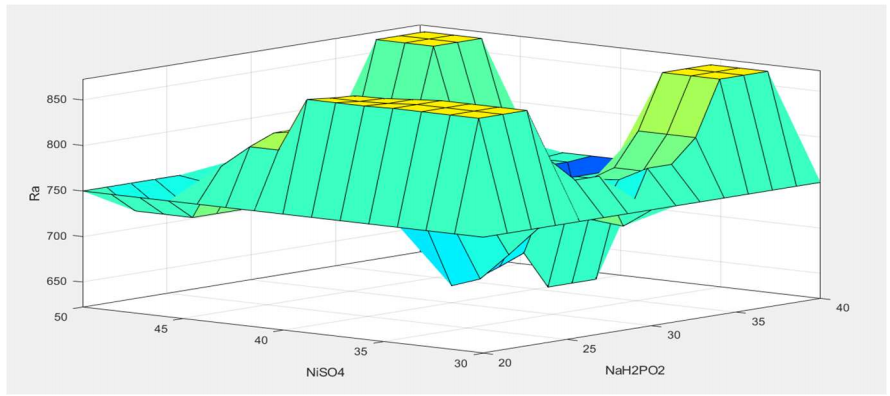
This complements the fact that all SR parameters were correlated to each other and had a similar effect on the outcome.
Comparison and validation test
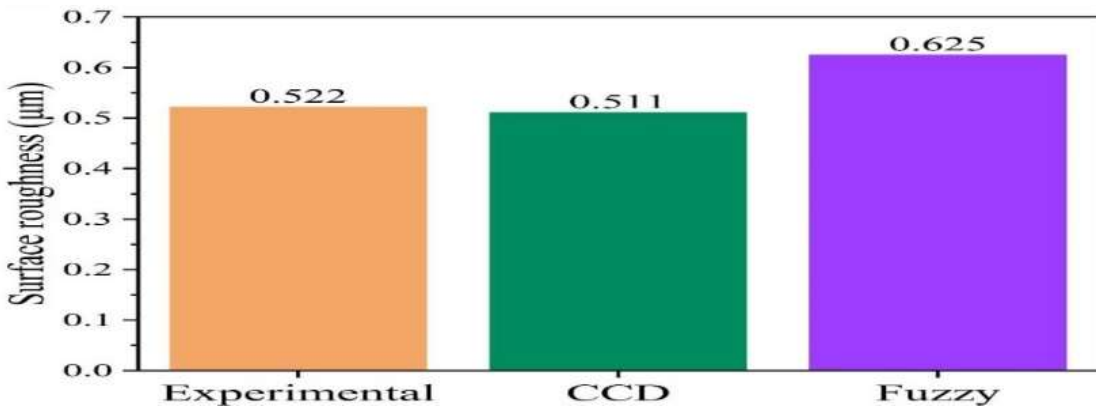
The authentication tests are an essential step for the verification of the results obtained from CCD approach 23. Therefore, validation experiments at the optimized process parameters were conducted for SR. Mathematical results formed from CCD regression equation were compared with the predicted average based on CCD optimal process parameters and FL values. Fig. 14 shows that there is a small difference among all values. The response optimization predicted optimal conditions comparatively well.
Study of microstructure
Under SEM micrograph, the characteristics of the electroless Ni-W-P deposit have been further analyzed. Fig. 15 is the SEM of Cu substrate without coating, which shows elongated grains of the substrate with no defined grain boundary.
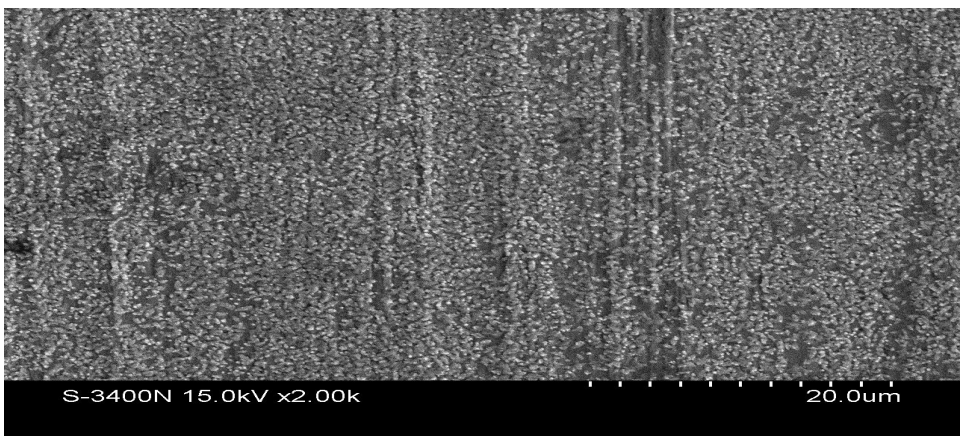
Fig. 16 (a) and (b) show the SEM of Cu substrate after Ni-W-P coating, at 20 and 50 µm, respectively, where the oval shape disintegration for the electroless deposit is visible. All the samples after Ni-W-P electroless coating deposition indicate a disc type precipitate of metallic phosphide on the Cu substrate. It is seen that the globular shaped atom scattered all over the sample, and that granular grains are more clear.
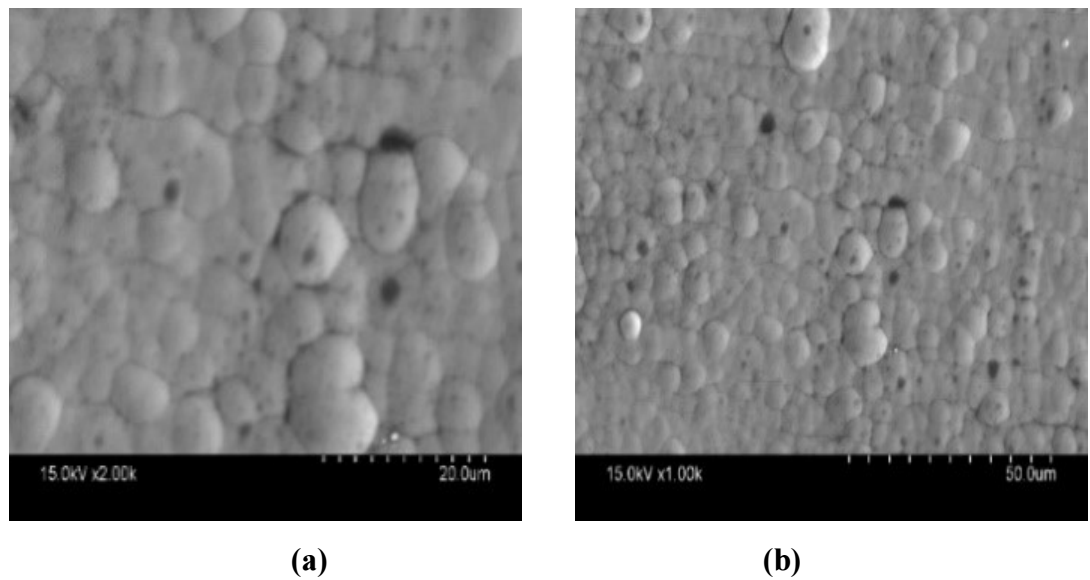
SEM analysis has provided evidence that Ni, W and P addition, in the form of a Ni-W-P coating, had a beneficial effect on the material’s microstructure, leading to improvements in its properties. The specific nature of these improvements will depend on the intended application and the desired material characteristics, which may include SR reduction. So, SEM analysis indicated that Ni-W-P incorporation greatly contributed to the morphology of the film, to enhance Cu properties.
Conclusions
In this study, SR parameters, like centre line Ra, were efficiently optimized using Fuzzy theory along with CCD method in Ni-W-P electroless coatings. The three parameters (Na2WO4.2H2O, NaH2PO2.2H2O and NiSO4.6H2O) were fuzzified to optimize SR parameters through a single comprehensive output measure (Ra).
Optimized parameters for lower Ra which were obtained from regression predicted values through CCD model were: Na2WO4.2H2O = 18.8166 gm/L; NaH2PO2.2H2O = 34.8415 gm/ L; and NiSO4.6H2O = 37.5368 gm/ L. The optimum response for Ra was 0.511 µm.
In terms of FL observation, it was found that Ra prediction value in input parameters was: Na2WO4.2H2O = 18.8 gm/L; NaH2PO2.2H2O = 34.8 gm/L; and NiSO4.6H2O = 37.5 gm/L. The output Ra value was 0.625 µm.
Regression predicted and fuzzy predicted values were fairly close to experimental values i.e., Na2WO4.2H2O = 19.04 gm/L, NaH2PO2.2H2O = 37.52 gm/L and NiSO4.6H2O = 37.5 gm/L. The optimum response for Ra was 0.522 µm. This shows that: there was a small difference among all values; and that the response optimization predicted optimal conditions comparatively well.
From the above observations, it may be concluded that the as-deposited Ni-W-P electroless coating substrate had lower SR. Ra value was 0.511 µm, whereas SR value of Cu substrate without coating was 1.19 µm. Clearly, the optimized as- deposited coated samples showed a significant decrease of 49.74% in SR compared to the substrates without coating.
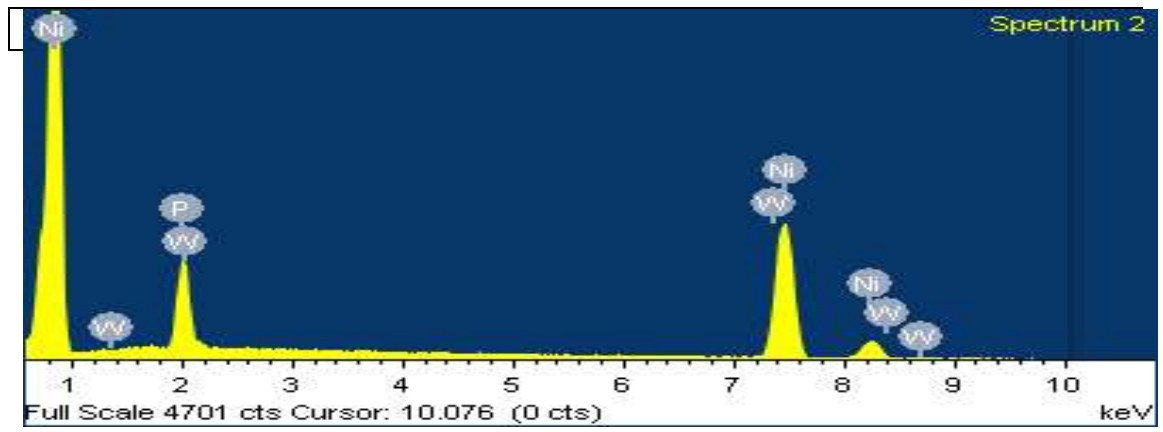
SEM analysis showed that the Cu substrate without coating had elongated grains of the substrate with no defined grains boundaries, while in the as-deposited coating substrate oval shape disintegration is visible. Globular shaped atom was scattered all over the sample and grains were seen more precisely. This indicates that Ni-W-P incorporation made a major contribution to the film morphology, enhancing Cu properties. EDX showed Ct of Ni, P and W in the optimized coating.
From this study, it was concluded that W content played a significant role in reducing the Ra of ternary Ni-W-P electroless coating. The proposed methodology may be taken as an effective approach for optimizing Ra parameters in industrial experiments, and helping researchers.
Authors’ contributions
Sameer Lamichaney, Rupam Madal: contributed to conceptualization, design, methodology, data collection, analysis, investigation, writing (original draft), literature review and editing. Subhasish Sarkar: contributed to conceptual framework, discussion and conclusion. Rajat S. Sen, Buddhadeb Oraon, Gautam Majumdar: contributed to supervision, resources and validation.
Abbreviations
ANOVA: analysis of variance
AP: adequate precision
CCD: central composite design
CH3COONa.3H2O: sodium acetate
Ct: concentration
Cu: copper
CV: coefficient of variation
DoE: design of experiments
EDX: energy dispersive X-ray
FL: fuzzy logic
HCl: hydrochloric acid
MF: membership function
Na2WO4.2H2O: sodium tungsten dihydrate
Na3C6H5O7.2H2O: tri-sodium citrate dihydrate
NaH2PO.2H2O: sodium hypophosphite
Ni: nickel
NiSO4.6H2O: sodium sulphate
P: phosphorus
PdCl2: palladium chloride
PRESS: predicted residual sum of squares
R2: coefficient of determination
Ra: average roughness
Re: rhenium
RSM: response surface methodology
SD: standard deviation
SEM: scanning electron microscopy
S/N: signal-to-noise ratio
SR: surface roughness
W: tungsten

