




 Inglês (pdf)
 Artigo em XML
 Referências do artigo
 Tradução automática
 Enviar este artigo por email
 Citado por SciELO
  Similares em
SciELO
Similares em
SciELO 
 Permalink
Introduction
The impact of hydrodynamic parameters and environmental factors on materials integrity in the mining and mineral related industry cannot be underestimated. High amounts of MS are widely used in these industries, because of its low cost and outstanding mechanical properties. Several studies have documented some corrosion failures associated with equipment in the mining and mineral industry 1-3. It has been concluded that hydrodynamic parameters play a significant role in determining the materials CR in these industries 4-8.
Literature has highlighted some of the advantages and limitations associated with methodologies employed to evaluate hydrodynamics parameters affecting corrosion 9-11. Most of these setups either overvalue or undervalue the CR, leading to inaccurate and imprecise data. Some of the employed methodologies include flow loop, impinging jet and RCE systems. However, generally, it has been challenging to relate data obtained from laboratory set-ups to the ones in the field 12,13. Among the hydrodynamic parameters used in evaluating CR, mass transfer coefficient and wall SS are believed to correlate well with electrochemical signatures. The former is well established and properly documented; most especially, for free film forming conditions. Recently, the use of CFD numerical simulation has been increasing, to ascertain actual SS within a system 14. Considerable works have been carried out on the significance of SS to correlate CR, instead of FV. There are still some unresolved issues to be covered vis-à-vis the mechanisms operating in several industries. Hence, in this investigation, a RCE was employed, since it provides accurate SS, improves electrochemical measurements and uses appropriate electrodes configurations in terms of design and placement.
Therefore, this study assessed the impact of varying SS on the pH of simulated mine water. This stems from a report 15 which has stated that accurate prediction of CR in mine waters is very difficult to achieve, due to the impossibilities of controlling their chemistries. Another observation was that the water pH fluctuates widely through a range from about four to almost twelve. The large variation in pH is suspected to affect the corrosivity of mine waters, which is due to the increase in TDS leading to varied water chemistries 15. Another survey concluded that mine waters varied from one gold mine to another, sampled at different points in a particular mine, as well as in ones taken from the same point at diverse times 16.
The South African gold-mining industry uses 4000 L/sec water 2. A comprehensive study 3 reported the impact of FV and pH on the CR of MS in synthetic mine water. The work correlated CR obtained using flow loop and RCE.
This work differs in that SS is the hydrodynamic parameter employed to evaluate the CR of MS in simulated mine water, instead of FV. Recently, research has established that SS is more robust to evaluate material performances in flow assisted corrosion 17,18. Thus, this study intends to provide information on the corrosion mechanism governing MS in simulated water by correlating the electrochemical signatures obtained through LPR and EIS with a predictive model, at various SS.
Background information
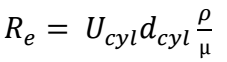
There has been serious concern in matching the hydrodynamics parameters, as obtained in the industrial/field conditions, with laboratory tests during corrosion measurements 7. According to literature, the consensus in solving this issue is the adoption of wall SS to evaluate electrochemical signatures 19. Using wall SS has allowed to correlate laboratory data with field conditions, most especially for RCE. Observations revealed that hydrodynamics conditions for RCE are usually turbulent, which encourage its application for corrosion studies. Studies showed that the transition from laminar to turbulent flow is a function of Re, which is a ratio between inertial and viscous forces, and it is defined mathematically, for RCE, as Eq. (1):
 ()1
()1
where Ucyl (cm/s) is linear velocity, dcyl (cm) is outer diameter, rcyl = dcyl/2 is radius, ρ is solution density (g/cm3) and 𝜇 is the solution absolute viscosity (g/cm/s).
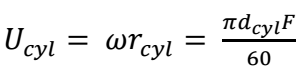
Meanwhile, Ucyl at the cylinder outer surface is given by Eq. (2):
 ()2
()2
where the rate can either be expressed as angular rotation rate, ω (rad/s), or frequency, F (rpm).
In general, for a rotating cylinder, when Re is greater than 200, the flow is turbulent. The good thing about RCE is that the transition from laminar to turbulent occurs at a relative low rotation of 20 rpm, which makes the equipment a perfect device for replicating pipeline infrastructures hydrodynamics. It is worth noting that the corrosion mechanism occurring in the field will be reproduced in the laboratory, when RCE hydrodynamic parameters are similar to the field ones. Hence, it is believed that the presence of turbulent flow at the RCE will induce wall SS on the cylinder surface. Again, Eisenberg’s original reports offer a well-accepted Eq. (3). for the wall stress, (cyl (g/cm/s):
 ()3
()3
In this research, it was believed that no protective films would be formed on CS, according to an earlier report 3. The pH ranged from 4 to 9.8. Employed SS were 95, 190 and 290 Pa. Finally, experimental data will be compared with a semi-empirical model.
Experimental procedure
Materials and electrode preparation
This study evaluated the performance of UNS G10180 CS in a simulated mine water environment, and X80 steel chemical composition is shown in Table 1.
| Al | As | C | Co | Cr | Cu | Mn | Mo | Nb | Ni | P |
|---|---|---|---|---|---|---|---|---|---|---|
| 0.001 | 0.007 | 0.160 | 0.010 | 0.063 | 0.250 | 0.790 | 0.020 | 0.006 | 0.078 | 0.008 |
| S | Sb | Si | Sn | Ti | V | Zr | Fe | |||
| 0.029 | 0.011 | 0.250 | 0.017 | <0.001 | 0.001 | 0.004 | 98.24 |
Fig. 1 revealed SEM images of typical ferrite/pearlite phases, after polishing and etching the material in a 2% Nital solution, for 15 s, to ascertain that it was MS.
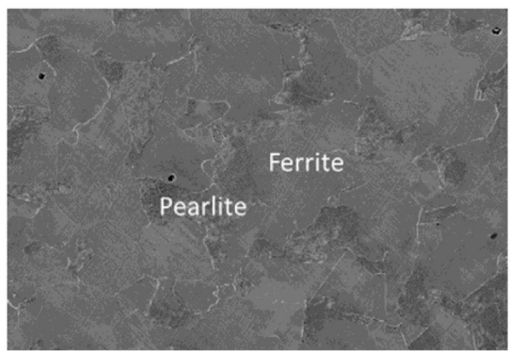
Figure 1: SEM image of UNS G10180 CS microstructure used in the tests (2% Nital etched): ferrite - pearlite phases 22.
The electrodes were prepared according to earlier work 20. The samples were machined in a RCE, to the dimensions of 1.5 cm diameter, 0.5 cm length and 5.89 cm2 area. Thereafter, the steel samples were metallurgical prepared according to ASTM E3-11 21, whereby they were mechanically ground with silicon carbide paper from 220 to 1200 grade, and polished from 9 to 1 mm diamond finish, degreased in acetone, rinsed with distilled water and dried with compressed air. Hydrodynamic parameters (FV and SS), as presented in Table 2, were generated using a Pine RCE Instrument. SS values for the RCE were calculated by using the modified Eq. derived by Eq. (4) 22:
 ()4
()4
where V is FV (cm/s).
Table 2: Hydrodynamic parameters used for tests.
| S/N | Rotating speed (rpm) | FV (m/s) | Re | SS (Pa) |
|---|---|---|---|---|
| 1 | 2000 | 1.6 | 26856 | 95 |
| 2 | 3000 | 2.4 | 40284 | 190 |
| 3 | 4000 | 3.1 | 52034 | 290 |
Water chemistry/solution preparation
The simulated mine water used in this study was formulated in line with 24, and the measured pH was 6.8 (Table 3), being representative of the industrial process fluid employed in mining industry. The pH values selected for the study were adjusted during the experiments, and they were: 4, 6.8 (autogenous) and 9.8. The solution pH was adjusted to the desired value by adding 1 M HCl or NaCO3, which is a good measure of alkalinity 25. The temperature was fixed at 30 ºC ± 2 ºC.
Table 3: Preparation of synthetic mine water.
| Chemicals | NaCl | MgSO4 | CaCl2 | Na2SO4 |
| Concentration (g/L) | 1.380 | 0.199 | 1.038 | 1.237 |
Electrochemical measurements
Electrochemical measurements were performed using a Gamry REF600-12065 Potential/Galvanostat/ZRA. Carried out experiments included Ecorr, Rp and EIS measurements, with the aim of monitoring corrosion behavior over time. OCP measurements were perfomed for 30 min, and the electrode was polarized from OCP, ± 20 mV, at a scanning of 0.5 mV/s. LPR results were used to calculate CR (mm/year), and the data were related to the carbonated solution FV. CR was determined using Eq. (5).
 ()5
()5
where 0.00327 is a constant factor used unit conversion, EW is the equivalent weight of Fe in g (56.8 g) and polarization constant (β) was 26 mV, with β a = 𝛽 𝑐 = 12 mV 23. EIS measurements were carried out from 10000 to 0.01 Hz, using an amplitude of 10 mV peak-to-peak alternating current signals. All experiments were repeated at least five times, but, typically in triplicate, to ensure data reliability and accuracy.
Model validation
An in-house model developed in ICMT, Ohio, to predict the corrosion behavior of materials for oil and gas environment, was modified to validate experimental data obtained from the simulated water environment.
Results
LPR measurements
LPR was used to measure OCP and icorr, and assess the CR of CS in the simulated water environment. Table 4 shows the results of samples with pH 4, at various FV. It can be seen that OCP shifted in the negative direction, as SS increased from -0.549 (95 Pa) to -0.59 V (290 Pa).
Table 4: Linear polarization data for samples at different FV (pH = 4).
| S/N | SS (Pa) | OCP (V) | icorr (mm/year) | Rp (ohm) | CR (mm/yr) |
|---|---|---|---|---|---|
| 1 | 95 | -0.549 ± 0.034 | 0.85 ± 0.01 | 34.41 ± 0.60 | 1.92 ± 0.03 |
| 2 | 190 | -0.573 ± 0.047 | 0.98 ± 0.02 | 29.21 ± 2.07 | 2.21 ± 0.17 |
| 3 | 290 | -0.59 ± 0.028 | 1.17 ± 0.01 | 25.17 ± 2.33 | 2.64 ± 0.11 |
Similar trends were observed for samples immersed in solutions with pH 6.8 and 9.8 (Tables 5 and 6). FV effect on OCP was a shift in the negative direction. For example, at pH 5, OCP values were -0.572, -0.584 and -0.603 V, for SS at 95, 190 and 290 Pa. Noticeably, j and CR data agreed, either with FV effect or the water chemistry pH. CR and j increased with stronger SS and decreased with higher pH. Thus, j and CR were directly and inversely related to FV and water chemistry pH, respectively. Rp results were as expected.
Table 5: Linear polarization data for samples at different FV (pH = 6.8).
| S/N | SS (Pa) | OCP (V) | icorr (mA) | Rp (ohm) | CR (mm/yr) |
|---|---|---|---|---|---|
| 1 | 95 | -0.572 ± 0.00002 | 0.56 ± 0.003 | 48.33 ± 2.07 | 1.27 ± 0.34 |
| 2 | 190 | -0.584 ± 0.0002 | 0.68 ± 0.001 | 39.14 ± 2.33 | 1.54 ± 0.17 |
| 3 | 290 | -0.602 ± 0.004 | 0.87 ± 0.002 | 30.79 ± 3.29 | 1.97 ± 0.11 |
Table 6: Linear polarization data for samples at different FV (pH = 9.8).
| S/N | SS (Pa) | OCP (V) | icorr (µm/A) | Rp (ohm) | CR (mm/yr) |
|---|---|---|---|---|---|
| 1 | 95 | -0.568 ± 0.002 | 0.18 ± 0.01 | 149.61 ± 7.09 | 0.41 ± 0.03 |
| 2 | 190 | -592 ± 0.002 | 0.27 ± 0.01 | 175.95 ± 6.64 | 0.61 ± 0.17 |
| 3 | 290 | -0.613 ± 0.04E-03 | 0.37 ± 0.02 | 83.2 ± 3.09 | 0.84 ± 0.42 |
CR data
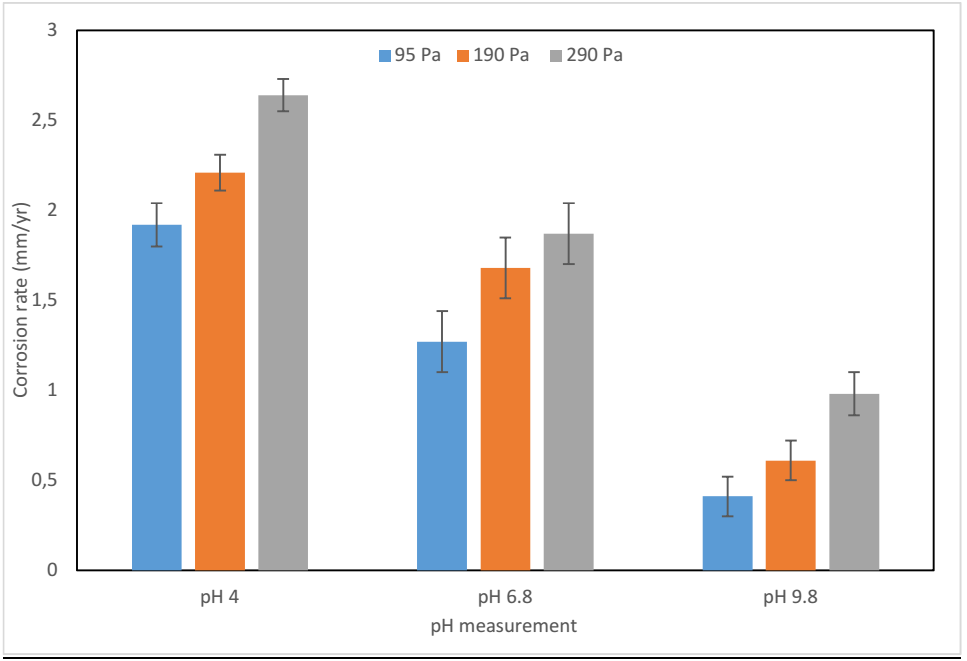
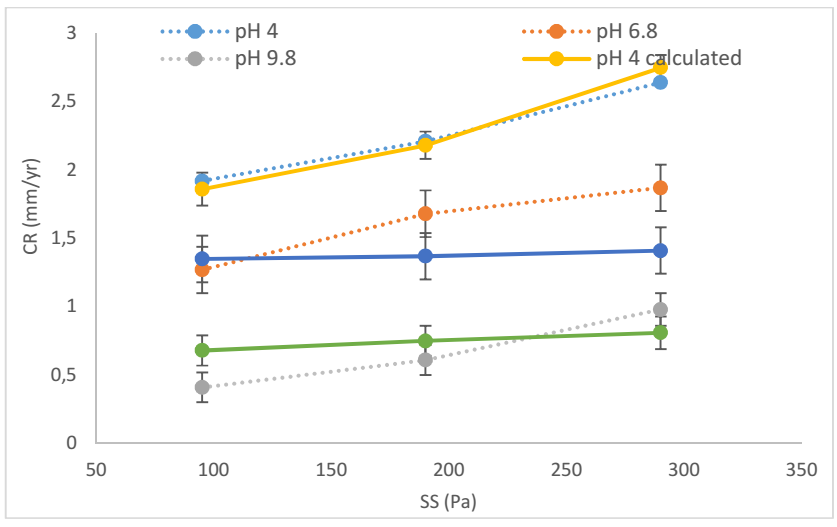
CR values were estimated using Rct obtained by subtracting Rs from Nyquist plots of EIS for Rp obtained from LPR. This is to compensate for the low conductivity associated with the water chemistry employed for the study. In line with earlier studies 17,18,20, CR increased as SS increased, irrespective of the solution pH, as shown in Fig. 2. For example, CR values were 1.92, 2.21 and 2.64 mm/yr for SS of 95, 195and 290 Pa, at pH 4. Similar trends were observed for the samples at pH 6.8 and 9.8. Expectedly, CR decreased as pH increased for samples subjected to 95 Pa, i.e., CR were 1.92, 1.27 and 0.41 mm/yr, for samples immersed in water chemistry of pH 4, 6.8 and 9.8.
EIS results
The use of EIS provide information on the charge transfer and mass transfer components which assist in examination of the corrosion processes 23. A summary of the EIS measurements as a function of the wall SS is presented in Tables 7,8 and 9.
Table 7: EIS data for samples at different FV (pH = 4).
| S/N | FV (m/s) | Rct (ohm) | Rp (ohm) | f (Hz) | R (ohm/cm2) | Cdl (µF/cm2) |
|---|---|---|---|---|---|---|
| 1 | 1.6 | 26.6 | 30.6 | 3.95 | 84 | 488 |
| 2 | 2.5 | 22.6 | 25.5 | 3.16 | 73 | 701 |
| 3 | 3.0 | 18.3 | 22.2 | 2.00 | 61 | 1326 |
Table 8: EIS data for samples at different FV (pH = 6.8).
| S/N | FV (m/s) | Rct (ohms) | Rp (ohms) | f (Hz) | R (ohm/cm2) | Cdl (µF/cm2) |
|---|---|---|---|---|---|---|
| 1 | 1.6 | 42.5 | 46.4 | 1.59 | 410 | 248 |
| 2 | 2.5 | 34.3 | 38.2 | 1.26 | 293 | 438 |
| 3 | 3.0 | 26 | 29.9 | 1.00 | 192 | 843 |
Table 9: EIS data for samples at different FV (pH = 9,8).
| S/N | FV (m/s) | Rct (ohms) | Rp (ohms) | f (Hz) | R (ohm/cm2) | Cdl (µF/cm2) |
|---|---|---|---|---|---|---|
| 1 | 1.6 | 141.2 | 144.4 | 1.00 | 1920 | 84 |
| 2 | 2.5 | 93 | 96.3 | 1.00 | 1064 | 152 |
| 3 | 3.0 | 67 | 70.3 | 1.00 | 604 | 268 |
It was observed that Rp values from EIS at various FV and pH were on lower than LPR. This affects CR value. A similar pattern was observed for Rct and Rp. Rct decreased with increasing FV and was lower with higher pH. The frequency decreased as FV increased with lower pH solutions (4 and 6.8), but it was the same at all FV (1 Hz), with pH 9.8 (Figs. 3, 4 and 5). Based on calculated Cdl, CS behaved like a conductive porous electrode at all FV and pH. Cdl increased with higher FV. An increase in Cdl showed that Rs increased. EIS data produced similar Nyquist plots at varying FV (Figs. 3, 4 and 5).
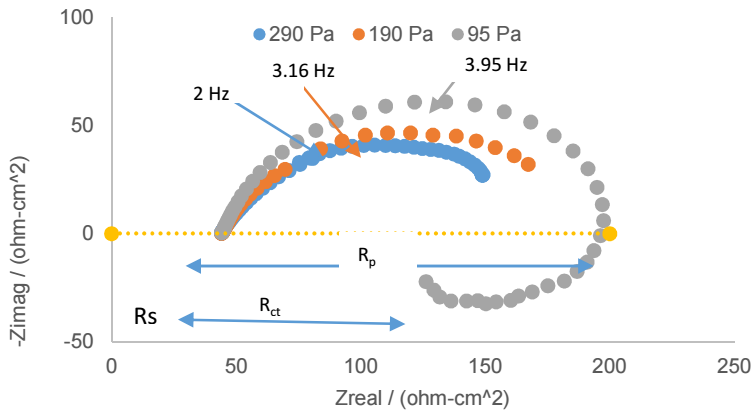
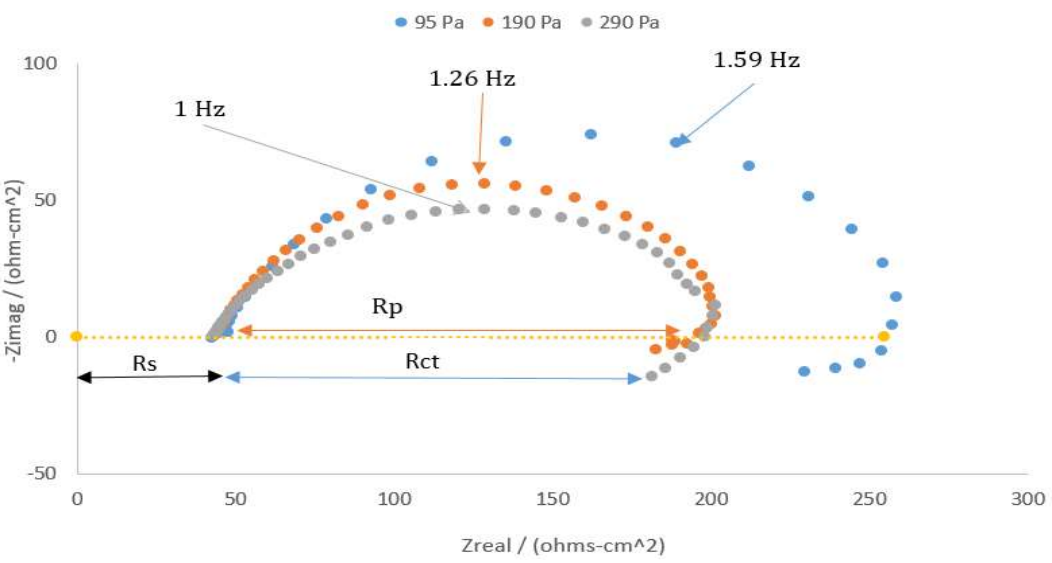
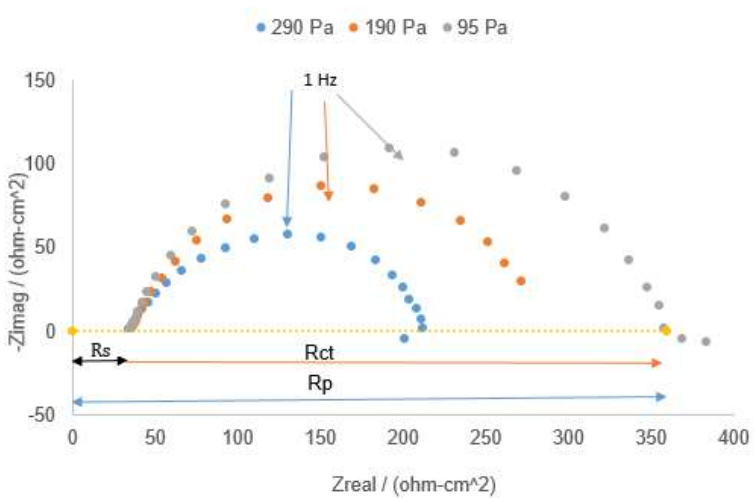
Rs decreased as the solution pH increased, but there were no observed changes with varying FV. Although Nyquist plots loop decreased as FV increased, it enlarged with higher pH values. The bigger the loop the lower the CR, and it can be stated that Nyquist loops were inversely and directly related to FV and water chemistry.
Discussion
CR values obtained from using LPR technique were validated by comparing them with a calculated CR from a semi-empirical model. LPR technique was adopted, since it is able to capture instantaneous changes in CR, i.e., real-time electrochemical measurements. A clear trend from Fig. 6 is that, at pH 4, both experimental and calculated CR values have a difference of 2.43, 0.93 and 2.88%, for 0.5, 0.6 and 1 m/s FV, respectively. The average error for experimental and calculated results, at pH 5, was 23.18%, with a SD of 21.50%. However, both average error and SD decreased to 13.29 and 12.23%. This is in line with CR data (Fig. 6), which showed that there were huge SD for samples immersed in water chemistry, at pH 5. The trend showed that SD values are higher when CR is very low.
Increasing flow SS increased the CR, due to stronger materials dissolution and to the high exposure of the reacting species to the steel surfaces. The implication is that increasing the rapid diffusion of corrosive media to the materials intensifies the mass transfer process. This leads to massive materials dissolution and formation of huge corrosion products on the material.
In the studied environment, it is believed that loose, non-stable and non-adherent corrosion products were formed, which enhanced MS exposure to the simulated mine water. Ultimately, increasing SS will negatively affect the film structure, form a non-protective film on the MS and increase its failure 26-28. Invariably, there is synergy between anodic dissolution and cathodic reduction (O diffusion). Although the flow is turbulent, it is believed that the harmful effects of mass transfer are highly negligible, since SS applied are relatively low 17. Earlier results supported the fact that the wall SS has a direct relationship with FV.
It was figured out in this study that increasing the surface SS resulted in more exposure of the fresh steel matrix to the reacting species in the simulated mine water, by removing the corrosion products 29,30. The relationship between SS and CR reinforced earlier reports which demonstrated that it is linear when the system is inhibited 17.
The implication is that reaction rates and equilibrium drive corrosion reactions in the studied environments. Another observation is that pH was inversely proportional to CR; that is, as pH increased CR decreased. This trend is due to the fact that higher pH values tend to reduce conductivity, TDS and mine water salinity 24.
Meanwhile, there is a nonlinear relationship between SS and pH of the environment, which seems to involve mass action kinetics or chemical reaction systems. It can be inferred that the corrosion reaction is a function of the corrosion products of the participating molecules concentrations. Thus, CR is directly affected by the reactive species amount and by the fact that corrosion within the studied environment is governed by a series of elementary reactions.
Although this study is premised on free film forming condition, loose and non-adherent corrosion products were formed. The observed increase in materials dissolution as the SS increased can be due to higher icorr. The increase in icorr as a function of SS might improve O diffusion throughout the system, which makes it more available for the cathodic reduction 20.
Conclusions
RCE was used to investigate CS corrosion in a film-free conditions, low temperature and pressure, varying SS (95, 190 and 290 Pa) and pH (4, 6.8 and 9.8).
CR supported earlier studies in which it is directly and inversely related to an increase in SS and pH. Experimental data for CR were compared to a predictive model with minimum and maximum SD varying from 0.9 to 26%, at different conditions.
From EIS study, Nyquist loops were inversely and directly related to SS and water chemistry.
Future work will determine the appropriate equivalent circuits using EIS measurements, to provide information on the governing mechanisms within simulated mine water environments. Also, research efforts should consider the effects of corrosion products and films formed by MS in simulated mine waters.
MS corrosive wear in the presence of various water chemistries and SS is due to chemical reaction systems. Thus, this work recognized that the formation of tight corrosion products, reduction of mass transfer process and recommended O scavengers in simulated mine water might reduce failure rates associated with MS.
Acknowledgements
Oladeji O. Ige acknowledges South Africa NRF and Prof. P. Olubambi, CNT, UJ, for funding the research visitation to ICMT, Ohio University, Prof S. Nesic (ICMT, Ohio University), for hosting the research, and late Prof. Anne Neville (IFS, University of Leeds, for introducing the author to “flow assurance in minerals beneficiation”.
Authors’ contributions
Paul C. Okonkwo, Kunle M. Oluwasegun and Ayodele A. Daniyan: contributed to data analysis and to writing of the manuscript. Oladeji O. Ige: conceived and designed the experiments All authors provided the critical feedback and contributed to the research, analysis and manuscript.
Abbreviations
ASTM: American Society for Testing and Materials
CaCl2: calcium chloride
Cdl: double layer capacitance
CFD: computational fluid dynamics
CR: corrosion rate
CS: carbon steel
Ecorr: corrosion potential
EIS: electrochemical impedance spectroscopy
FV: flow velocity (v)
HCl: hydrochloric acid
icorr: corrosion current density
j: current density
LPR: linear polarization resistance
MgSO4: magnesium sulfate
MS: mild steel
Na2SO4: sodium sulfate
NaCl: sodium chloride
NaCO3: sodium carbonate
OCP: open circuit potential
Pa: Pascal
R: Zreal value at the chosen frequency
Rad: adsorption resistance
RCE: rotating cylinder electrode
Rct: charge transfer resistance
Re: Reynolds number
Rp: polarization resistance
Rpm: rotation per minute
Rs: solution resistance
SD: standard deviation
SEM: scanning electron microscopy
SS: shear stress
TDS: total dissolved solids

