




 Inglês (pdf)
 Artigo em XML
 Referências do artigo
 Tradução automática
 Enviar este artigo por email
 Citado por SciELO
  Similares em
SciELO
Similares em
SciELO 
 Permalink
Introduction
For a long time, steels and its alloys have been used in several industries for various purposes, such as pipelines. Every year, worldwide economic losses caused by corrosion amount to 75,000 billion dollars, which depletes world’s GDP of 3-4% 1. Metals corroding process may be prevented with the aid of CI 2,3, which hinder metals dissolution by mineral acids attacks. Several types of un-ecofriendly and toxic CI are used in industries, some of which are inorganic and organic synthetized substances. Nowadays, green and nontoxic CI are in high demand.
Various industries employ acids in the process of cleaning pipes and oil from surfaces 4-6. CI usually behave as adsorbents, which means they adsorb onto metals surfaces and form a chemical bond. However, there are some phenomena where they are attracted by metals, originating physical adsorption. Different plant parts are used to prepare green CI extracts, since they have good ability to cover metals surfaces, because their phytochemicals components possess aromatic structures with heteroatoms. Generally, CI added to AE have organic molecules that contain heteroatoms as prime chemical constituents. In several studies, the extracts of many plants have been used as efficient CI in various AE, such as: walnut green (Juglans regia L.) husk 7; Mish Gush8, Stachys byzantine9, Thymus vulgaris10 and Aloysia citrodora11 leaves; Punica granatum peel on SS-410 12; Ammi visnaga (which was also used as friendly antioxidant) 13; Allamanda cathartica14 and Senggani (Melastoma candidum D. don) 15 leaves; and iodide ions and Xanthium strumarium leaves 16.
KB is a deciduous flowering plant with diverse genera, of the Acanthaceae family. It is an Indian routine medicinal plant, which is used in various treatment of ailments. Its leaves contain various type of phytochemicals 17,18, such as saponins, flavonoids and glycosides.
The novelty of the present work was to employ KBE as a green CI for MS in H2SO4. Employed electrochemical techniques were EIS, PDP and LPR, to test whether KBE behaved as a mixed-type CI. KB adsorption onto the MS surface in H2SO4 followed Langmuir’s isotherm.
Materials and methods
KBE preparation
KBE was obtained via maceration process from 80% ethanol/water system. Then, it was filtered. The residues were removed by a solvent and eliminated via rotary evaporator. A concentrated blackish solid was obtained.
WL method
WL is an extensively used and predictable method for estimating CR. The prepared blank solution was made of geared 0.5 M H2SO4 (analytical reagent) and distilled water. CR values of MS were evaluated at different T (298, 308, 318 and 328 K), via WL method, with different Ct of KBE in the test solution, for 20 h. MS samples (1 x 1 x 1 cm) had the chemical composition by wt% of C-0.1, Si-0.033, Mn-0.335, Al-0.057, Cu-0.0476, Cr-0.02 and balance Fe. For 20 h, the MS samples were entirely immersed in a conical flask of 250 cm3 with a 0.5 M H2SO4 solution. Then, they were taken from the test solutions, and cleaned with acetone.
Instrumentation (electrochemical) measurements
Selected Ct ranges of KBE solutions for the current study were 400, 800, 1200 and 1600 ppm. They were diluted in 0.5 M H2SO4, which was also used as blank. All steps of this experimentation and measurement employed scientific programs have been delineated elsewhere 19-22. The electrochemical potentiostat study was performed by CH Instruments, Inc. CHI760c. The SR adopted in PDP study was 1.0 mV/s-1. EIS were recorded with an amplitude of 5 mV peak to peak, at OCP, with signals/disturbance in the frequency range from 105 to 10-2 Hz.
Study of surface characterization
MS coupons (1 × 1 cm × 2 mm) were used for the surface characterization study. Polished MS coupons were subjected to corrosion, in H2SO4, at the Ct range of KBE from 400 to 1600 ppm, to monitor IE(%), for 10 h. SEM studies were performed by Jeol Japan, Model No. JSM-6610LV instrument.
GC-MS study
GC-MS study was performed with a Shimadzu GC-MS-QP 2010 Ultra fitted with an RTX-5 MS (30 m X 0.25 mm X 0.25 µm) capillary column. He gas was used as transporter, with the flow rate of 1.21 mL/min. The initial oven T was 60 ºC, for two min, and then it was increased to 260 ºC. The 2 mL sample was injected in split less mode, and total IT was 60 min. The ions source was heated at 220 ºC, and electron-impact ionization technique was used at a potential of 70 eV. Mass spectra of KBE with crude ethanol showed compounds identified from NIST and WILEY libraries, and their assessment agreed with those reported in literature 23.
Results and discussion
WL calculation
Data calculated via WL are listed in Table 1.
Table 1: WL parameters for MS, for 20 h IT in 0.5 M H2SO4 without and with KBE at various Ct and T (298-328 K) T.
| T | Ct (ppm) | WL (mg) | CR (mg/cm-2/h-1) | IE% | SC (θ) |
|---|---|---|---|---|---|
| 298 K | Blank | 0.4979 | 0.0277 | - | - |
| 400 | 0.0471 | 0.0026 | 90.61 | 0.9061 | |
| 800 | 0.0362 | 0.0016 | 94.22 | 0.9422 | |
| 1200 | 0.0202 | 0.0011 | 96.02 | 0.9602 | |
| 1600 | 0.0092 | 0.0005 | 98.19 | 0.9819 | |
| 308 K | Blank | 0.6187 | 0.0345 | - | - |
| 400 | 0.0599 | 0.0034 | 90.14 | 0.9014 | |
| 800 | 0.0395 | 0.0022 | 93.62 | 0.9362 | |
| 1200 | 0.0260 | 0.0014 | 95.94 | 0.9594 | |
| 1600 | 0.0175 | 0.0009 | 97.39 | 0.9739 | |
| 318 K | Blank | 0.8261 | 0.0460 | - | - |
| 400 | 0.0872 | 0.0048 | 89.56 | 0.8956 | |
| 800 | 0.0710 | 0.0039 | 91.52 | 0.9152 | |
| 1200 | 0.0598 | 0.0033 | 92.82 | 0.9282 | |
| 1600 | 0.0361 | 0.0020 | 95.65 | 0.9565 | |
| 328 K | Blank | 1.0471 | 0.0584 | - | - |
| 400 | 0.2725 | 0.0152 | 73.97 | 0.7397 | |
| 800 | 0.1681 | 0.0093 | 84.07 | 0.8407 | |
| 1200 | 0.1051 | 0.0058 | 90.06 | 0.9006 | |
| 1600 | 0.0705 | 0.0039 | 93.32 | 0.9332 |
Due to MS corrosion in a 0.5 M H2SO4 solution, its WL was examined, with various Ct of KBE, at several T (298, 308, 318 and 328 K). CR (mm/yr-1) was calculated using eq. (1).
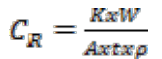 (1)
(1)
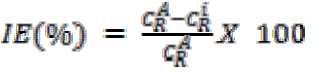
where W is WL, t is IT, ( is density (7.85 g/cm3) and K denotes corrosion constant (8.76 x 10⁴) 24. C R A and 𝐶 𝑅 𝑖 are CR of MS in H2SO4 without and with KBE, of which effect on CR is shown in Fig. 1.
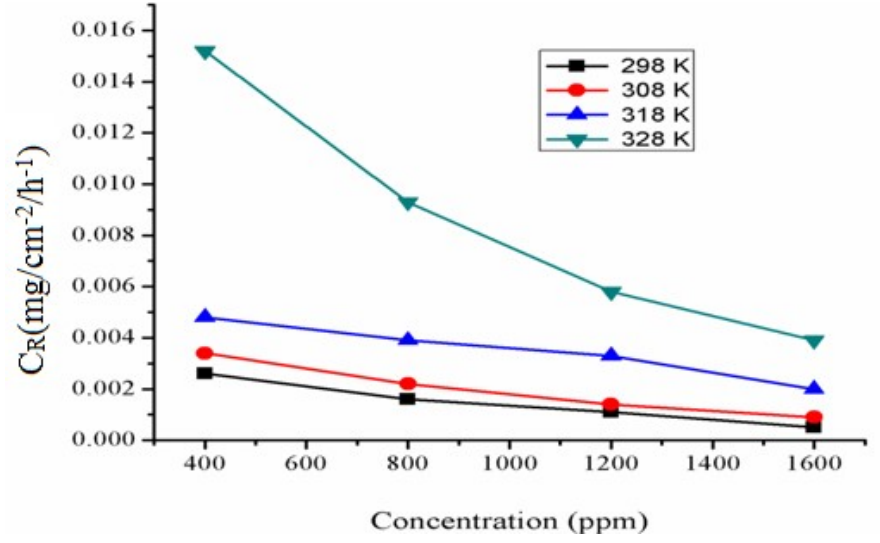
Figure 1: CR values with different Ct of KBE at T from 298 to 318 K. Correct caption to (mg/cm-2/h-1).
With higher Ct of KBE, CR decreased, as shown in Fig. 2. The inhibitor’s molecules were adsorbed onto the MS surface, which hindered CR. The lower the Ct from KBE, the lower the IE(%).
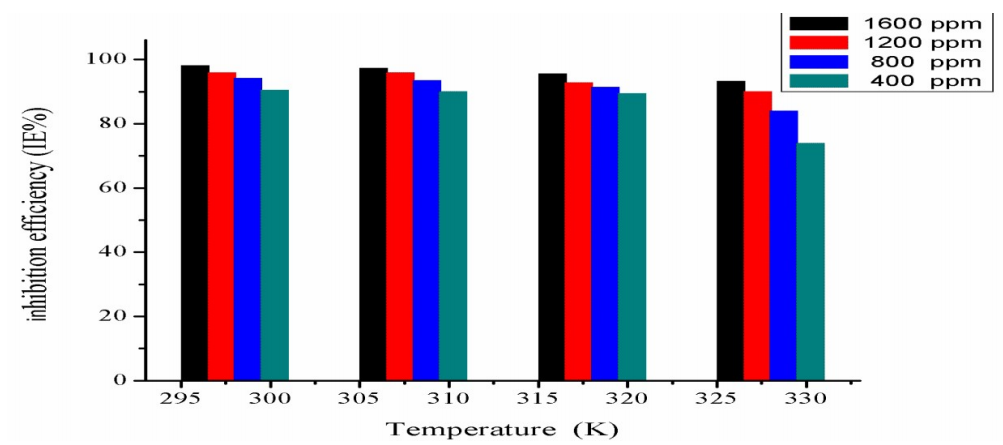
From Table 1, maximum IE(%) of KBE was 98.19, which was achieved at a Ct of 1600 ppm. The inhibitor´s IE(%) and SC (θ) values were calculated via eqs. (2) and (3), respectively.
 (2)
(2)
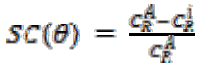 (3)
(3)
Polarization investigations
Galvanostatic study and LRP
Polarization analyses were carried out thorough determination of KBE inhibition mechanism, at 298 K, using different Ct. From the experimental study, Tafel curve plot is shown in Fig. 3, and polarization is represented by Table 2. Improvement in corrosion IE(%) via icorr was calculated by Eq. (4).
 (4)
(4)
where Iinh and Iacid are icorr without and with KBE in a 0.5 M H2SO4 solution, respectively.
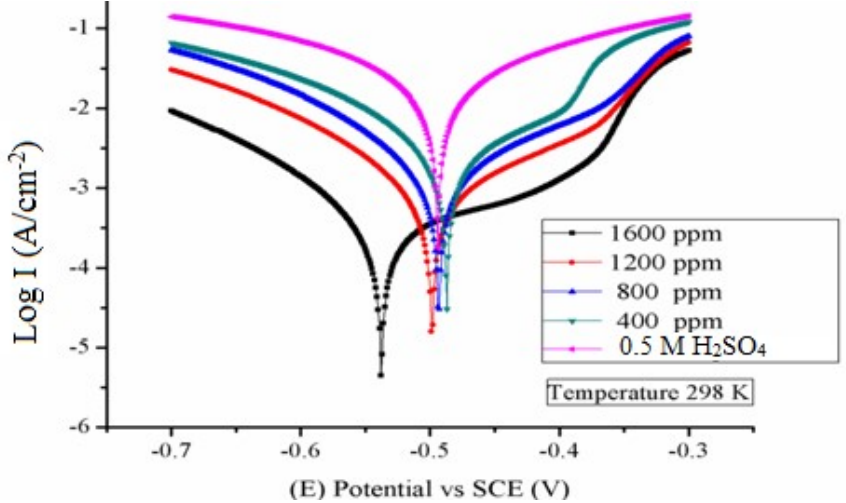
Figure 3: Galvanostatic polarization curves for MS in a 0.5 M H2SO4 solution with various Ct of KBE, at 298 K. Correct captions: Log I (A/cm-2) and 0.5 M H2SO4
Table 2: Tafel and LPR parameters for MS in a 0.5 M H2SO4 solution with different Ct of KBE, at 298 K.
| Ct (ppm) | Icorr (A/cm2) | Ecorr (mV per SCE) | IE% | Tafel data | LPR data | |||
|---|---|---|---|---|---|---|---|---|
| (c (mV/dec) | (a (mV/dec) | Rp (Ω/cm2) | LPR% | |||||
| Blank | 2.560 | 0.494 | - | 53.81 | 51.47 | 1.6 | - | |
| 400 | 0.2165 | 0.487 | 91.54 | 73.45 | 98.54 | 15.4 | 89.57 | |
| 800 | 0.1803 | 0.493 | 92.95 | 67.30 | 86.80 | 18.7 | 91.44 | |
| 1200 | 0.09865 | 0.499 | 96.14 | 70.52 | 85.25 | 31.3 | 94.88 | |
| 1600 | 0.04067 | 0.538 | 98.41 | 91.01 | 45.38 | 78.4 | 97.95 | |
CI action in 0.5 M H2SO4 improved with higher Ct of KBE. Ecorr experimental values’ trend means that the inhibitor is an anti-corrosion catalyst of mixed type. With KBE, (a and (c noticeably changed in an irregular manner, due to the inhibition process that implied HER and MS dissolution. (a was mainly slower than (c, phenomenon that may be temporary, as indicated by the suppressed anodic reaction of MS oxidation/dissolution via KBE action. Moreover, (c differed, although slightly, and the inhibitor suppressed HER. Both reactions were limited by KBE-Fe complexes ([Fe-atoms-KBE]ads) and [Fe- atoms- KBE -OH]ads) on the substrate’s surface, which led to complete active sites coverage 25. LPR values specify KBE’s adsorption onto the MS surface by the development of a physical barrier with a non-conducting nature.
EIS measurements
EIS experiments were performed to assess interfacial changes at the MS surface in 0.5 M H2SO4 with and without KBE, at 298 K. This study was used as a separate and additional method to properly measure IE(%),mechanistic and kinetic data of the electrochemical system under examination. Resulting Bode and Nyquist plots are shown in Figs. 4 and 5, and their parameters are specified in Table 3.
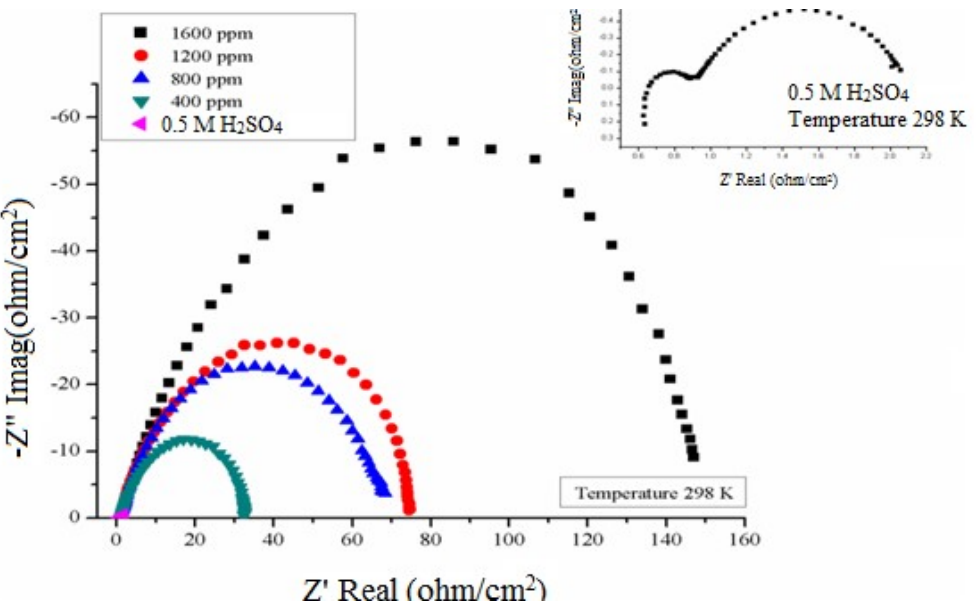
Figure 4: Nyquist’s plots for MS in a 0.5 M H2SO4 solution without and with KBE at various Ct, at 298 K. Correct captions: 0.5 M H2SO4 and ohm/cm2
The MS’s surface irregularity and CI mechanism via single charge transfer was considered through the single semi-circle in the Nyquist plot, for all Ct of KBE in H2SO426. The diameter in Rct remarkable rose with increased Ct of the inhibitor, which confirms this mechanism. CR of MS decreased, after KBE created an insoluble protective layer. By using Eq. (5), IE(%) values were calculated 27.
 (5)
(5)
where Rct and 𝑅 𝐶𝑡 𝑎 are Rct values with and without KBE, respectively.
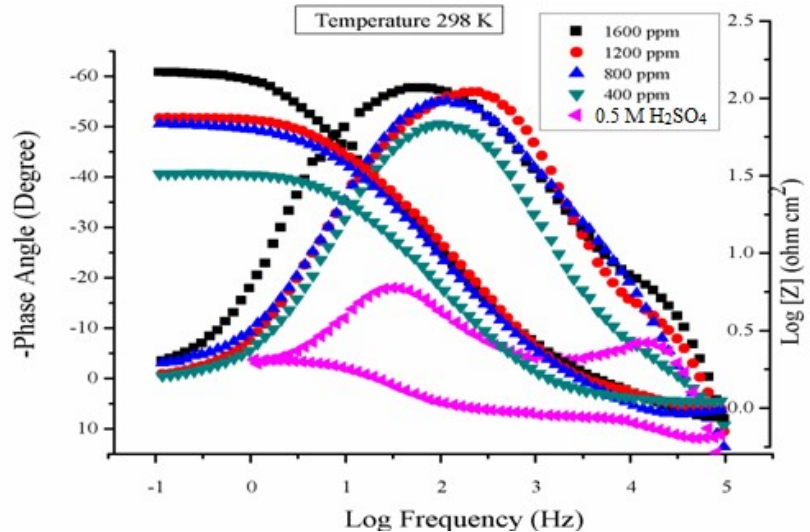
Figure 5: Bode’s plot for MS in a 0.5 M H2SO4 solution without and with KBE at various Ct, at 298 K. Correct captions: 0.5 M H2SO4
Table 3: Parameters of impedance for MS in 0.5 M H2SO4 without and with KBE, in various Ct, at 298 K.
| Ct (ppm) | Rs (Ω/cm2) | n | Q (Ω-1/cm-2 Sn) | Rct (Ω/cm2) | Fmax (Hz) | Cdl (F/cm-2) | IE% |
|---|---|---|---|---|---|---|---|
| Blank | 1.4 | 0.7105 | 0.876 | 1.720 | 6.50 | 0.14229 | |
| 400 | 1.2 | 08528 | 0.481 | 30.19 | 14.31 | 0.03682 | 94.38 |
| 800 | 1.3 | 08974 | 0.116 | 70.31 | 17.28 | 0.001312 | 97.55 |
| 1200 | 1.4 | 0.9296 | 0.0424 | 75.37 | 23.39 | 0.0007996 | 97.71 |
| 1600 | 1.1 | 0.9510 | 0.016 | 155.77 | 69.75 | 0.0001464 | 98.89 |
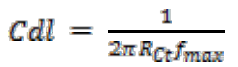
Cdl was measured by using Eq. (6), of which values increased with higher Ct of KBE.
 (6)
(6)
where f max is maxima frequency via Nyquist curve.
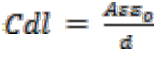
Eq. (7) represents an inverse relation between Cdl and thickness (d) of the shielding layer. Experimental parameters are listed in Table 3, which shows a decrease in Cdl value with higher Ct of KBE. This means that the protecting layer thickness increased.
 (7)
(7)
where A is the surface area of the MS substrate, Ɛ and Ɛo are constants dielectric for the vacuum permittivity with the medium and d is the shielding layer thickness.
The significance of single time constant is illustrated by Bode graphs of Fig. 5, for each Ct of KBE. The phase angle approached to 900, which was further confirmed by stronger homogeneous MS surface substrate (28). Other parameters include (n) values phase shift from Eq. (8), which are nearer to unity with KBE addition, and associated with less heterogeneity on the MS surface without inhibitor 29-31.
 (8)
(8)
where Q is CPE, 𝜔 is angular frequency, which is an imaginary part with the maximum value of electrochemical impedance plot, and fZim−max is maxima frequencies.
Study of T´s kinetics
Adsorption isotherm
The relation between KBE’s molecules and the MS’s surface was studied via the adsorption mechanism characteristics, employing various isotherms. Experimental data established that the relation with best fit was for Langmuir’s adsorption isotherm, with linear R2 values (0.999 - 1) obtained by the plotting graph C/θ vs. Ct, at different T, which generated straight lines 32-37 (Fig. 6).
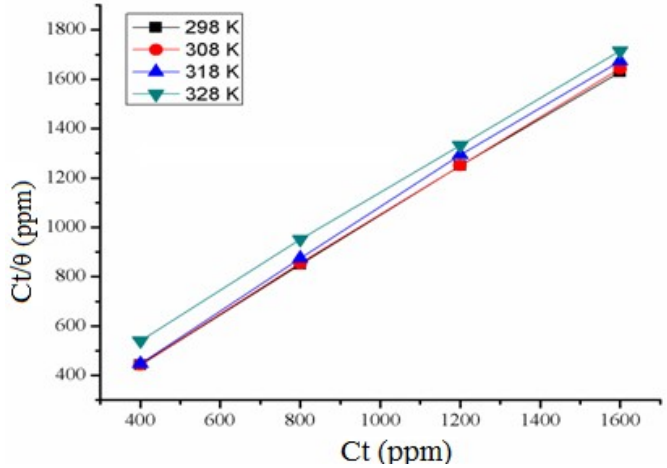
Figure 6: Langmuir’s isotherm for KBE (at different Ct) adsorption onto MS in a 0.5 M H2SO4 solution, at various T.
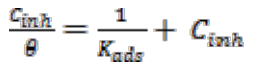
From Eq. (9), Langmuir’s isotherm was calculated. It depends on the Ct of KBE’s molecules in the H2SO4 solution, which have performed SC (θ) of MS.
 (9)
(9)
where Cinh is Ct of KBE (Fig. 7). R2 value had a recognized major role on the relations between KBE’s molecules adsorbed onto the MS surface substrate, which were linked onto cathodic and anodic reactive sites.
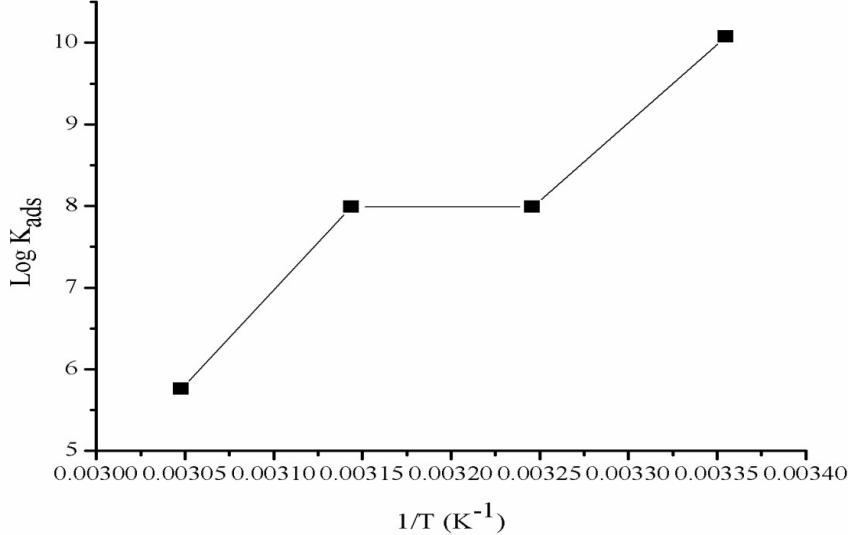
In the investigated system, the additive molecules blankets on cathodic and anodic sites were formed by the adsorption mechanism and the development of a multi-molecular layer that obeyed Langmuir’s isotherm. Kads values were employed to determine Δ𝐺◦ ads via Eq. (10), indicating KBE strong adsorption onto the MS surface. The adsorption was strong, since more heteroatoms with lone pair and aromatic rings were delocalized from pi electrons in KBE’s molecules. According to 38, Δ𝐺◦ ads values closer to -40 Kj/mol-1 indicate chemisorption, and those nearer to -20 kJ/mol-1 show physisorption. For this study, calculated values and parameters are listed in Table 4, which were near to -40 kJ/mol-1, at different t, revealing a chemisorption process, which indicates its spontaneous nature.
Table 4: Thermodynamic parameters for KBE’s adsorption onto the MS surface in 0.5 M H2SO4, at different T.
| T | Log K | R2 | ΔHads (kj/mol) | ΔSads (j/mol K) | ΔGads (kj/mol) |
|---|---|---|---|---|---|
| 298 | 6.29 | 0.9997 | -51.65 | -49.22 | -45.83 |
| 308 | 5.31 | 0.9999 | -41.59 | ||
| 318 | 5.30 | 0.9993 | -42.88 | ||
| 328 | 4.79 | 0.9997 | -41.02 |
 (10)
(10)
where R is universal gas constant. The water’s molecule Ct was 55.5 mol/L.
In the present study, obtained ΔS°ads value was -49.22 kJ/mol, which suggested that the arrangement of KBE’s molecules on the MS surface followed the process of exothermic adsorption 39.
Ea parameter and T effect
The study of T effect, via WL calculations, on MS (coupon) in 0.5 M H2SO4 with different Ct of KBE, is listed in Table 1, which shows CR, SC (θ) and IE(%) values In the solution without KBE, CR of MS exponentially rose from 298 to 328 K, whereas with the inhibitor, it slightly decreased. IE(%) declined with T rise from 298 to 328 K. By using Arrhenius equation (11), Ea was determined. 40
 (11)
(11)
where A is pre-exponential factor of Arrhenius. The plot derived by Arrhenius and Eyring equations is shown in Fig. 8.
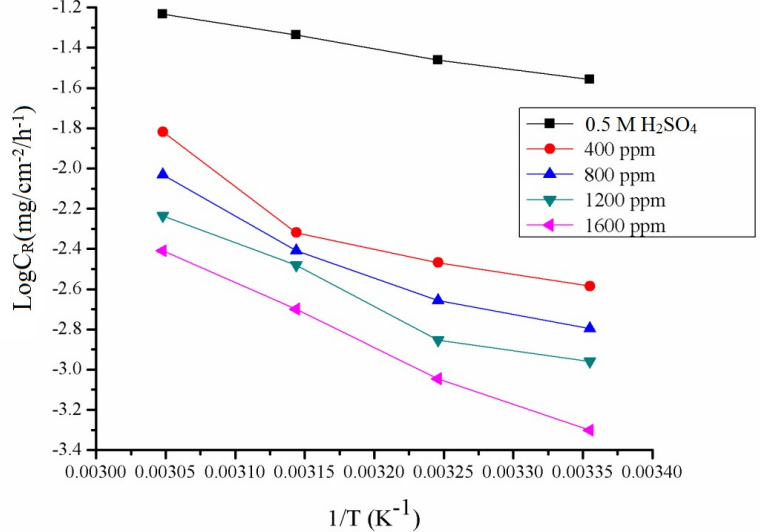
Figure 8: Arrhenius plots of Log CR against T-1 for MS in a 0.5 M H2SO4 solution containing different Ct of KBE.
Calculated values for ∆𝐻 𝑎𝑑𝑠 𝑜 and ∆𝑆 𝑎𝑑𝑠 𝑜 are listed in Table 5. Ea values were calculated via a straight line of the slope (Ea = slope x 2.303 R2), resulting from Arrhenius plot log 𝜕 vs. 1/T curve. Ea observed value for the systems with KBE were larger than those without it, which suggests that the adsorption process was chemical. ∆𝐻 𝑎𝑑𝑠 𝑜 and ∆𝑆 𝑎𝑑𝑠 𝑜 values were calculated by using Eq. (12).
 (12)
(12)
where N is Avogadro number and h is Plank constant 41.
Table 5: Ea parameters for MS in 0.5 M H2SO4 with and without KBE in different Ct.
| Ct (ppm) | Ea (kj/mol) | ΔHads (kj/mol) | ΔSads (j/mol/K) |
|---|---|---|---|
| 1600 | 56.49 | 54.24 | -110.21 |
| 1200 | 47.30 | 44.98 | -74.11 |
| 800 | 47.25 | 44.25 | -73.98 |
| 400 | 45.37 | 42.81 | -61.29 |
| blank | 20.44 | 19.11 | -120.87 |
Through the adsorption route, reactants molecules were improved to activate the complex, in which the phytochemicals disordering took place. Δ𝑆0 ads negative values reveal the associative mechanism that marks the progress of an activated complex, of which step was rate determining 42. Δ𝑆0 ads positive values correspond to the endothermicity of MS’s dissolution reaction. They were higher with KBE, which means that the energy barrier for MS dissolution reaction was drastically improved by the CI in H2SO443.
Morphological investigation
SEM
The micrographs (9a-9d) obtained via SEM in a 0.5 M H2SO4 solution without and with KBE (1600 and 400 ppm) show the changes caused by the corrosion process.
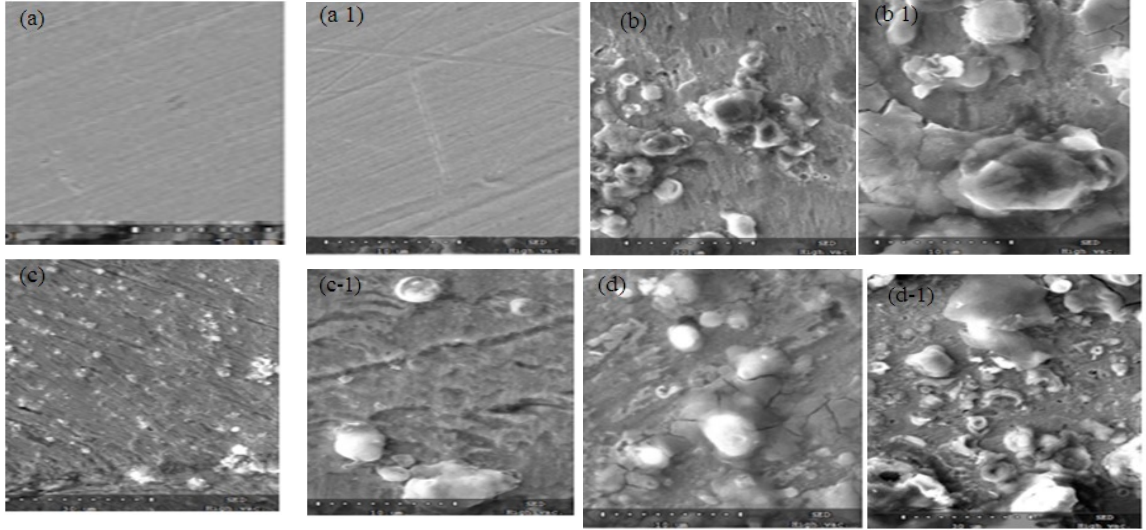
Figure 9: SEM micrographs with magnification 1000 (1) 3000 of MS surfaces - (a) bare; with 0.5 M H2SO4 - (b) blank, (c) with 1600 ppm KBE, and (d) with 1200 ppm KBE.
The MS surface in 0.5 M H2SO4 is damaged, as shown in Fig (9b). Its morphology appreciably improved (Fig. 9c) with the addition of 1600 ppm KBE, and less damages occurred compared to the sample with blank 0.5 M H2SO4. The MS surface roughness level was reduced when the Ct of KBE was increased from 400 to 1600 ppm. This enhancement in MS morphology was due to the excellent protective layer 44,45 formed by KBE on its surface, which was responsible for CI.
GC-MS analysis
In the current investigation, GC-MS identified 15 compounds among the 45 constituents recognized in MS immersed in KBE with ethanol, as shown in Fig. 10.
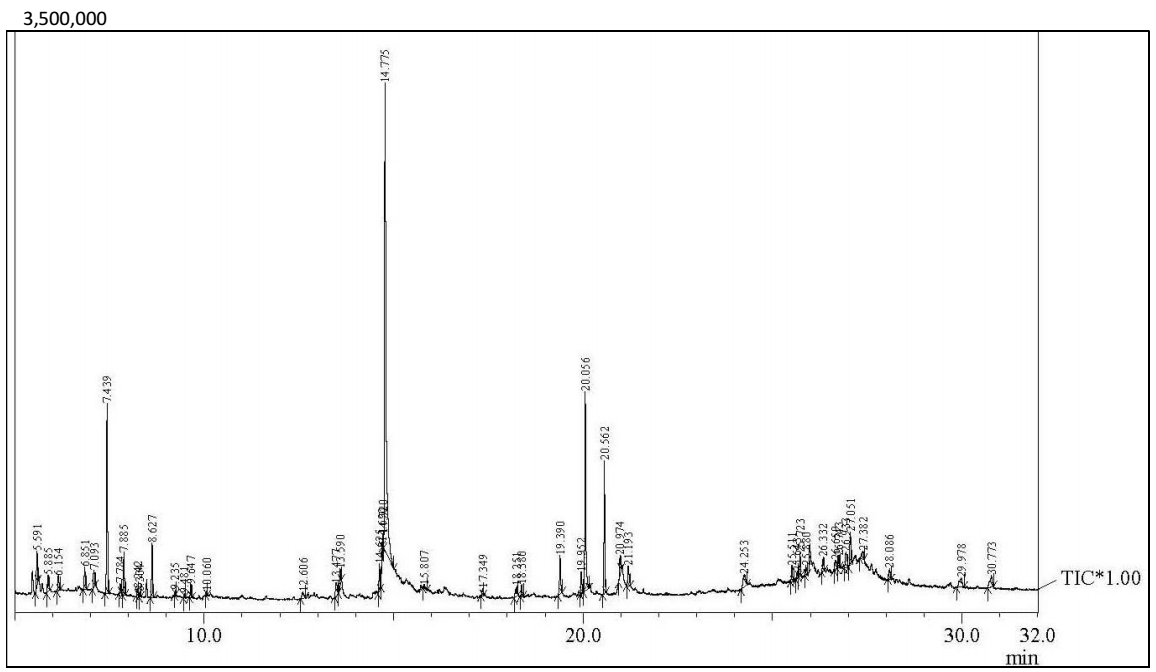
Table 6 characterizes the identified compounds, such as their MF, MW, IT, PA and SI. The phytochemical examination of KBE exposed the presence of heterocyclic organic compounds that can be largely classified as sterols, long chain alkenes (cyclic), long chain fatty acids and purine nucleosides. The majority of detected phytocomponents have been reported as effective green CI 46-53. The existence of multiple bonds with electrons, heteroatoms and some other substances in these organic compounds provides for excellent CI properties 54, due to the synergy among all of them.
Table 6: Phytocomponents detected in KBE.
| S. no | Compounds | MF | MW | IT | PA% | SI |
|---|---|---|---|---|---|---|
| 1 | 1,2,4-trimethylbenzene | C9H12 | 120 | 5.885 | 0.98 | 93 |
| 2 | Cyclopropylbenzene | C9H10 | 118 | 6.851 | 1.28 | 93 |
| 3 | 3a,4,5,6,7,7a-hexahydro-4,7-methanoindene | C10H14 | 134 | 7.439 | 9.22 | 96 |
| 4 | 4,7-Methano-1H-indene, octahydro- | C10H16 | 136 | 7.885 | 2.03 | 95 |
| 5 | Tricyclo[5.2.1.0(2,6)]dec-4-ene, 4-methyl | C11H16 | 148 | 8.627 | 2.49 | 89 |
| 6 | 3H-1,2,4-triazol-3-one, 4-amino-2,4-dihydro-2-methyl-5-phenyl | C9H10N4O | 190 | 14.690 | 0.74 | 75 |
| 7 | Decanoic acid, methyl ester | C11H22O2 | 186 | 18.251 | 0.88 | 87 |
| 8 | 2-Hexadecen-1-ol, 3,7,11,15-tetramethyl-, [R] | C20H40O | 296 | 20.056 | 10.61 | 97 |
| 9 | Bis(trimethylsilyl) ether of 1,4-anhydro-3-deoxypentitol | C11H26O3Si2 | 262 | 25.511 | 0.84 | 59 |
| 10 | D-erythro-pentopyranose, 2-deoxy-1,3,4-tris-o-(trimethylsilyl) | C14H34O4Si3 | 350 | 26.933 | 1.23 | 57 |
| 11 | 5-Hydroxymethyl-2,2,5-trimethyl-1,3-dioxane, | C11H24O3Si | 232 | 26.332 | 0.76 | 56 |
| 12 | Cis-4-Trimethylsilyloxy-cyclohexyl(trimethylsilyl)carboxy | C13H28O3Si2 | 288 | 28.086 | 0.75 | 50 |
| 13 | (1-butoxybutoxy)trimethylsilane | C11H26O2Si | 218 | 13.590 | 0.90 | 74 |
| 14 | Phytol, acetate | C22H42O2 | 338 | 20.562 | 5.95 | 76 |
| 15 | D-Erythro-Pentofuranose, 2-deoxy-1,3,5-tris-O-(trimethylsilyl) | C14H34O4Si3 | 350 | 27.051 | 2.02 | 55 |
Proposed mechanism of CI
KBE protected MS against corrosion in a 0.5 M H2SO4 solution by the adsorption process. CI mechanism is based on molecules interactions of acceptor and donor electrons between KBE and unoccupied d-orbitals on the MS surface. In other words, KBE’s heteroatoms interacted with the vacant d-orbital of the MS surface. At higher Ct, its CI potential in AE, namely H2SO4, was stronger (55).
Conclusions
KBE showed excellent CI results against MS corrosion in a 0.5 M H2SO4 solution. Its IE(%) increased with higher Ct. The highest IE(%) of 98.41% was observed for the Ct of 1600 ppm. All electrochemical measurements showed an analogous trend of IE(%). KBE adsorption onto the MS surface obeyed Langmuir's isotherm. It was a monolayer adsorption, and its nature was spontaneous and comprehensive. Surface morphology study via SEM confirmed the MS surface improvement, due to KBE adsorption onto it. KBE corrosion protection of MS, at particularly low Ct, makes it an ideal material for creating self-healing coatings.
Authors’ contributions
O. S. Yadav: planned the original research works; performed experiments and analysis; interpreted the results; wrote the manuscript. S. Kumar and K. Yadav: treated experimental data; validated results; prepared the draft. R. Sharma and R. Kumar: validated results; prepared the draft.
Acknowledgment
This research work was supported by Prof. Rabi Narayan Kar Shyamlal of College University of Delhi. All the authors also would like to thank DBT-Star Scheme College for financial support of the Department of Chemistry Shyamlal College and the University Science Instrumentation Centre (USIC), University of Delhi, India, and JNU, for research facilities.
Abbreviations
AE: acidic environment
AFM: atomic force microscopy
Cdl: double layer capacitance
Cinh: inhibitor concentration
CI: corrosion inhibitor
CPE: constant phase element
CR: corrosion rate
Ct: concentration
Ecorr: corrosion potential
EIS: electrochemical impedance spectroscopy
GC-MS: gas chromatography/mass spectrometry
H2SO4: sulfuric acid
HER: hydrogen evolution reaction
icorr: corrosion current density
IT: immersion time
KB: Kala Bansa (Barleria Prionitis)
KBE: Kala Bansa extract
LPR: linear polarization resistance
MF: molecular formula
MS: mild steel
MW: molecular weight
OCP: open circuit potential
PA: peak area
PDP: potentiodynamic polarization
ppm: parts per million
R2: regression coefficient
Rct: charge transfer resistance
SC: surface coverage
SEM: scanning electron microscopy
SI: similarity index
SR: scan rate
T: temperature
WL: weight loss
Symbols definition
(a: anodic Tafel slope
(c: cathodic Tafel slope
ΔH°ads: standard enthalpy
ΔG°ads: standard free energy for Gibbs
ΔS°ads: standard entropy
Ea: activation energy for Arrhenius equation

