




 Inglês (pdf)
 Artigo em XML
 Referências do artigo
 Tradução automática
 Enviar este artigo por email
 Citado por SciELO
  Similares em
SciELO
Similares em
SciELO 
 Permalink
Introduction
A broad range of complexes used in industries, pharmaceutical processes, agriculture and medicinal chemistry has garnered significant interest in recent years.
DTC are a class of organic chemicals that have been extensively used in the field of fine organic synthesis, particularly in the production of pesticides, herbicides and fungicides 1. Due to the elevated electron density of S atom in these ligands, and to the existence of active sites with C=S and C-S bonds, DTC are able to create insoluble complexes, and provide stability to metal ions in various oxidation states 2-4. Recently, it has been found that metal-DTC complexes enhance cytotoxic action mechanisms 5-7, and are able to stimulate the growth of tumor cells 8,9. Furthermore, they have been employed as chemotherapeutic agents. DTC also hinders the corrosion process, due to the existence of N and S as electronegative elements 10. The substance is adsorbed onto the metal surface, creating a protective layer that prevents corrosion, at certain areas 11. Recent studies have shown that Na-DDTC is a very effective, secure and cost-effective CI for metals in aggressive environments 12-16. 12 have assessed the IE(%) of Na-DDTC on CS corrosion in a HCl solution, by employing Tafel polarization and electrochemical impedance techniques. Data indicated that the ligand was an effective CI, despite its tendency to expedite the anodic process.
Various analytical approaches are employed to synthesize, analyze and characterize these substances. Electrochemical analysis is a crucial method for characterizing DTC complexes. This methodology has several key benefits, including rapid analysis speed 17, excellent selectivity and sensitivity, a low detection limit, relative simplicity and less equipment costs than those of other methods 18,19. Additionally, its reproducibility is enhanced by the use of a renewable surface electrode 20. Among these electroanalytical approaches, polarography is widely regarded as a productive and adaptable technique to investigate complexes in solutions. For many metal-ligand systems, it is possible to determine the degree of formation, distribution and ( of all species present 21.
In continuation of previous researches in the field by the authors of this study, Na-DDTC was herein used as a ligand to coordinate with Cd ion. Its general chemical formula is C5H10NS2Na. Na-DDTC’s chemical structure is shown in Scheme 1.
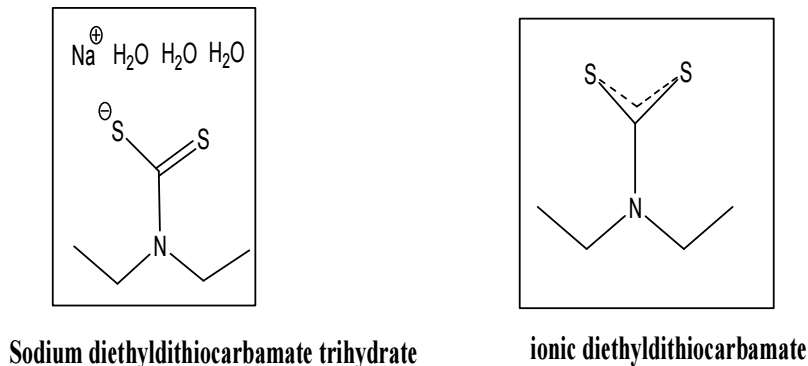
Herein, ( and stoichiometry of Cd-Na-DDTC complex were calculated, by using classical and extended Lingane’s equations in two different SE (KNO3 and NaClO4). Then, the results were compared to those of spectrophotometric techniques like Job’s method. Finally, the complex was employed as CI for CS in a H2SO4 medium.
Materials and methods
Stock solutions preparation
NaClO4 was obtained from Fluka. KNO3, Cd and CdCl2H2O (Fw: atomic absorption standard (98%)) were purchased from Aldrich.
The 5.10-3 M Cd2+ reference solution was prepared by weighing out the required amount of CdCl2H2O and dissolving it in 100 mL Milli-Q® water.
The 10-5 M Cd2+ solution used in this study was prepared by diluting 5.10-3 M Cd2+ with 10 mL 0,1 M KNO3 or 0,1 M NaClO4 in the polarographic cell.
Na-DDTC (Fw: 225.331) was purchased from Sigma Aldrich. Na-DDTC solutions with Ct from 1.10-4 to 3.10-4 M were prepared by weighing out their required amounts and dissolving them in the same solution of 0.1 M KNO3 or 0.1 M NaClO4, as those used for preparing the Cd2+ solution.
H2SO4 (Fw: 98.08, purity of 99.99%) used in WL measurements was purchased from Sigma Aldrich.
Equipments
DPV measurements were performed using a Trace-Lab50 from Radiometer, which included a polarographic analyser (Pol150) and stand (MDE150), monitored by Trace Master 5 software. These measurements were carried out using a conventional three-electrode system. The working electrode was a HMDE, with a capillary diameter of 70 µm. Potential’s values were expressed vs. an Ag/AgCl (3 M KCl) electrode separated from the test solution by a salt bridge containing the solvent/SE. The auxiliary electrode was a Pt wire.
Spectrophotometric measurements were performed on a UV-Visible Thermo Electron Corporation Nicolet Evolution 100 device, using a matched 10 mm quartz cell.
The pH measurements were carried out employing a pH-meter from Denver Instrument Company.
Electrochemical method
In DPV experiments, the pulse duration was programmed to 0.04 s, and the scan rate was 125 mV/s. Initial and final potential’s values were -400 and -700 mV, respectively. A 10 mL SE was placed in the polarographic cell. A magnetic stirrer provided the convective transport. Pure N2 was bubbled through the experimental solution to remove dissolved O2. Data were analyzed using Lingane’s equations.
Lingane’s equation
For the reaction denoted as Mm+ + qL( (MLq)m+ (where M is a metal with a charge of m+ and L is a neutral ligand with a stoichiometric coefficient of q), the polarographic half wave or Ep shifts more negatively with higher Ct of Na-DDTC added to Cd ion solution. Lingane’s 22 classical equation is derived in eq. (1), to calculate ( when activity coefficients were not considered.
 (1)
(1)
where n value of was = 2. This equation has been successfully applied by several researchers for determining ( and the ligand’s stoichiometric coefficient complexation reactions 22,23.
Extended Lingane's equation
If the current’s effect is included, the classical Lingane’s equation should be extended as follows 24,25 in eq. (2):
 (2)
(2)
This equation can only be applied when the system involves a complex highly stable.
Spectrophotometric method
For determining stoichiometry and Kf, A of a series of metal salt and ligand mixtures was initially measured at 298 K. Then, in order to perform ( variation with changes in T, A shifts at different T were studied.
Data were analyzed using Job’s method, also called CVM, which was selected, since it is easy, simple and commonly employed 26 to determine anions and organometallic compounds, and to help understand ligands/metal action modes 26,27. In analytical chemistry, it is mainly used to determine the stability of a complex, its Kf and composition. Optical measurements were employed to study a system with two or three components.
The procedure included making a volume of 2 mL metal complex solutions with different Ct of Cd ions and ligands (Table 1).

Then, the sum of the Ct from Cd2+ was calculated by eq. (3):
 (3)
(3)
The optical densities of the solutions, prepared in the previous step, were determined at the wavelength of a light strongly absorbed by Cd-Na-DDTC. The metal-ion and the ligand did not absorb at this wavelength.
A was plotted against fL (= CL /Ct). This plot is referred to as a Job’s plot. For calculating the Ct of Cd-Na-DDTC, eq. 3 was rewritten as eq. (4):
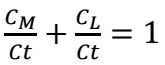 (4)
(4)
Since, as in eq. (5):
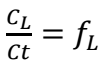 (5)
(5)
Eq. (4) can be reduced to:
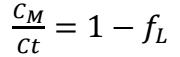 (6)
(6)
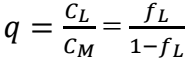
From eqs. (5) and (6) q can be obtained in eq. (7):
 (7)
(7)
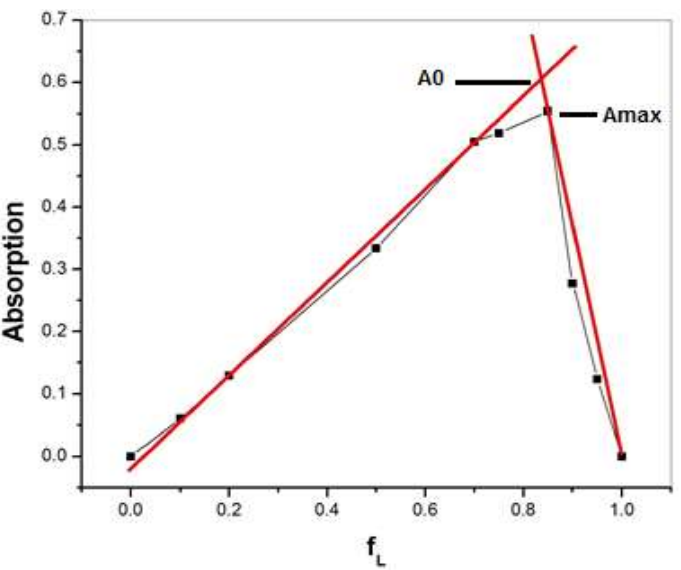
Job’s diagram, as shown in Fig. 6, consists of two straight lines intersecting at A0, at a given value of fL, which indicates Cd:Na-DDTC ratio in MLq.
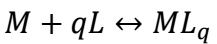
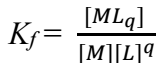
Once q was determined, Kf was calculated 29,30 by eqs. (8) and (9):
 (8)
(8)
 (9)
(9)
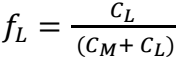
A was plotted at λmax vs. fL, in order to obtain Job’s diagram. A and fL were given by eqs. (10) and (11):
 (10)
(10)
 (11)
(11)
The deviation from Ao values was due to Cd-Na-DDTC’s complex dissociation. Thus, ( was determined from theoretical lines deviations (Fig. 6). Amax denoted A value at the highest point on the experimental curve, indicating the maximum amount of the complex formed with a dissociation degree (α). Ao represents absorbance value, where the theoretical straight lines intersected due to the complex, when its maximum Ct was formed, with a value of α = 0. Aα represents the absorbance value of the complex’s dissociated part, which is the difference between A0 and Amax. In order to quantify (, it was imperative to determine α, which was calculated by employing eq. (12):
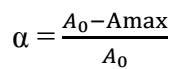 (12)
(12)
At equilibrium, eq. (13) is as follows:
 (13)
(13)
So, K f was given by:
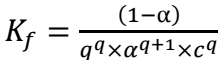 (14)
(14)
CI study
Corrosive solution
0.5 M H2SO4 was used as an aggressive solution, prepared by diluting a 99.99% analytical reagent grade with ultra-pure water.
For WL measurements, 100 mL of the test solution were used, and the Ct of the studied inhibitors varied from 50 to 500 mg/L.
WL measurements
Rectangular samples of CS XC38 (AFNOR/Euronorm: C35E CS and US specification: SAE1035), of 3 × 1.4 × 0.25 cm, were obtained by cutting plates with the chemical composition (wt.%): C = 0.37%, S = 0.016%, Cr = 0.077%, Mn = 0.68%, Si = 0.23%, Ti = 0.011%, Ni = 0.059%, Co = 0.009%, Cu = 0.160% and remainder iron (Fe), which were used for WL measurements. The samples were gradually polished with 200 to 1200 grade emery paper, with a pitch of 200. They were rinsed with double distilled water, degreased, washed thoroughly with double distilled water, dried in a stream of hot air, and weighed. Then they were immersed in the test aggressive solution without and with inhibitor, at different Ct, for 1 h, at T in the range from 298 to 323 K. At the end of the test period, the samples were withdrawn, cleaned with water, dried and reweighed. All measurements were repeated at least thrice, to ensure the results reproducibility.
The measured CR (mg/cm2/h) was determined using eq. (15):
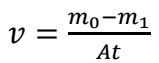 (15)
(15)
where m0 and m1 are the weight of samples before and after immersion, respectively, t is immersion time (1 h) and A is the samples’ total exposed surface area.
According to several authors 31-33, IE(%) may be calculated using eq. (16):
 (16)
(16)
where v0 and v denote average WL in a H2SO4 solution without and with inhibitor, respectively.
Results and discussion
Voltammetric behavior
( of Cd-Na-DEDTC complex was calculated by DPV. KNO3 and NaClO4 solutions were tested as SE, with an ionic strength of 0.1 M, at 298 K.
Under these conditions, 10-5 M Cd2+ showed a peak at about -500 mV, without the ligand. With Na-DEDTC added, at different Ct, to the Cd ion, its Ep shifted towards more negative values than those of the simple and free states. DPV values of Cd2+ in different Ct of Na-DDTC are shown in Figs. 1 and 2.
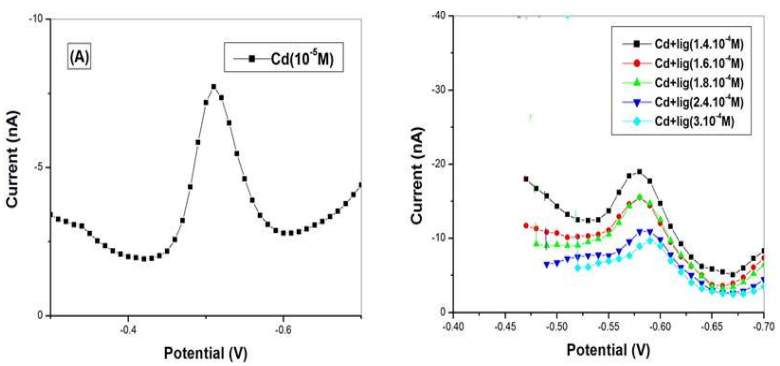
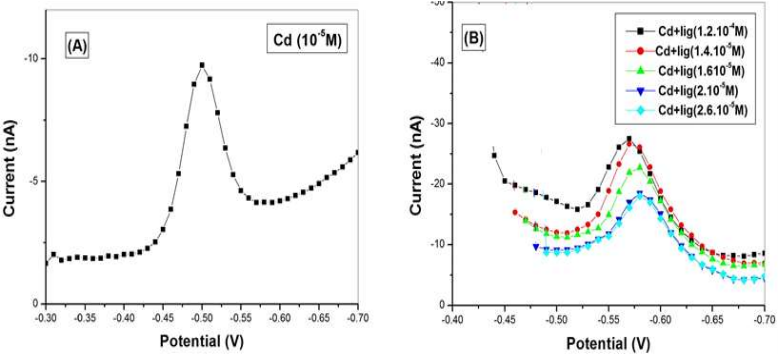
This significant displacement was used to determine ( and q, using simple and extended Lingane’s equations. The obtained results are listed in Tables 2 and 3.
Table 2: ∆Ep vs. Ag/AgCl and peak current of a 10-5M Cd2+ solution as a function of the Ct from Na-DDTC with 0.1 M NaClO4.
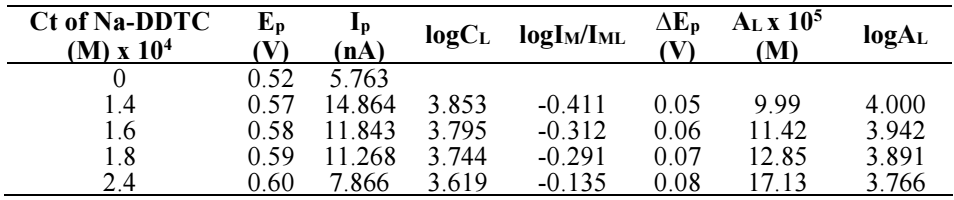
Table 3: ∆Ep vs. Ag/AgCl and peak current of a 10-5 M Cd2+ solution as a function of the Ct from Na-DDTC with 0.1 M KNO3.
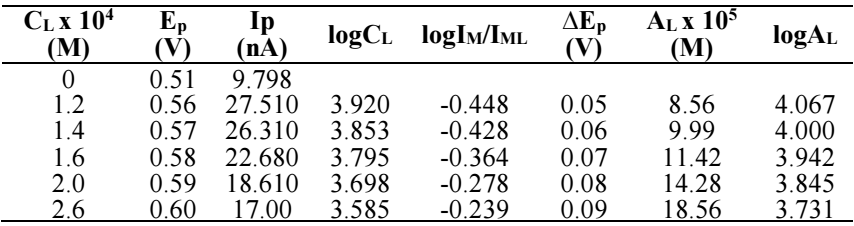
( values of Cd-Na-DDTC complex obtained from Eq. 1 were equal to 17.52 for KNO3 and 20.2 for NaClO4. The values of q were 4 in KNO3 and 5 in NaClO4. The values obtained from Eq. 2 for logβ were 21.20 and 24.48, in KNO3 and NaClO4, respectively. Those of q were 5 in KNO3 and 6 in NaClO4. Thus, it is noted that there was a significant difference in the results obtained by eqs. (1) and (2), which seems to be due to the change in peak intensity.
Validity of approximation
In this step, the same approximations that were used by 34 were adopted. Lingane’s equation was applied by considering Na-DDTC’s activity instead of its Ct. Ionic strength was considered 0.1 M, and the ligand’s activity coefficient was found to be 0.714. Thus, obtained results are given in Table 4, which shows that log( on KNO3 and NaClO4 originated errors of -0.75 and -3.59%, respectively. Concerning q, on KNO3 and NaClO4, 0.064% and 0.00%, respectively, were obtained. That is why it was concluded that Lingane’s equation should be used in its extended form, and that the approximation γMxγL q/γML = 1 was not favorable. Thus, and still in agreement with 34, q and log( values were obtained by plotting n∆Ep/0.059 + log(IM/IML), as an activity’s function (Fig. 3). In this context, even if ∆Ep remains constant, β and q can be calculated by plotting log(IML/IM) as log CL’s function 35.
Cd2+ reversibility in Na-DDTC presence was verified by DPV. As Fig. 4 shows, according to Epa - Epc, values were close to 30 mV, and to Ipa/Ipc, were near to unity. This indicated that the system, including the cation with Na-DDTC, was reversible. A similar result was found by 36, who have studied complexation reactions of Zn2+, Pb2+, Cd2+ and Tl+ metal cations by 5,7- diiodo-8-hydroxyquinoline in non-aqueous solvents 36.

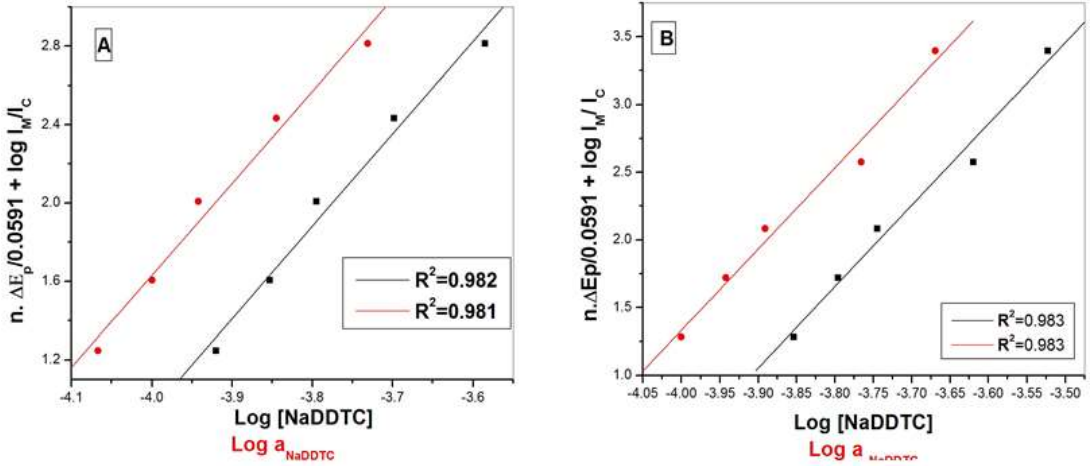
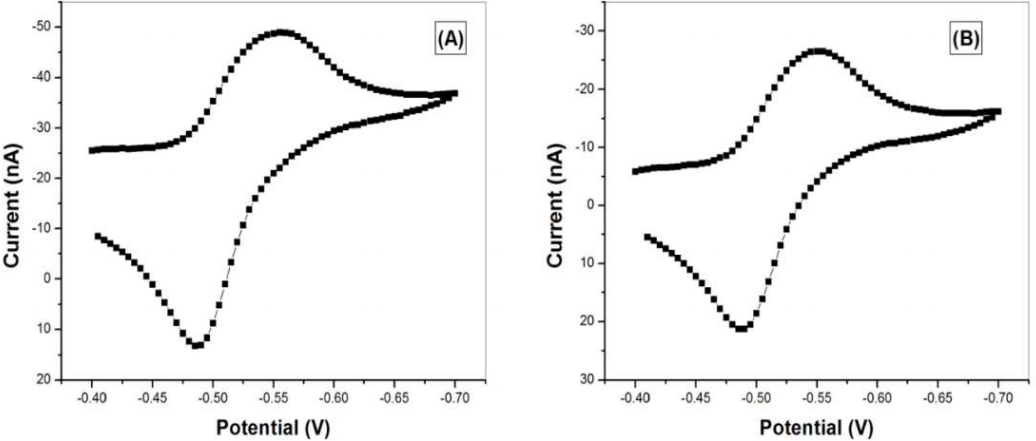
Figure 4: DPV of 10-5 M Cd2+ with 10-4 M Na-DDTC in- (A) 0.1 M KNO3 and (B) 0.1 M NaClO4; scan rate of 125 mV/s, at 25 °C.
Spectrophotometric behavior
The obtained results of ( and q in both SE were checked using spectrophotometric technique. Electronic spectra of Na-DDTC and Cd(II) complex in KNO3 are shown in Fig. 5. When Cd2+ ion was added to Na-DDTC in the KNO3 solution, two absorption peaks were seen. The first, at λmax = 256 nm, corresponds to n-π transition of S-C=S, and the second, at λmax = 280 nm, is assigned to the intraligand π-π* transition of N-C-SS. S absorption was determined 37,38. In perchlorate salts, the first absorption peak appeared in the same place, while a 20 nm bathochromic shift occurred at 300 nm.
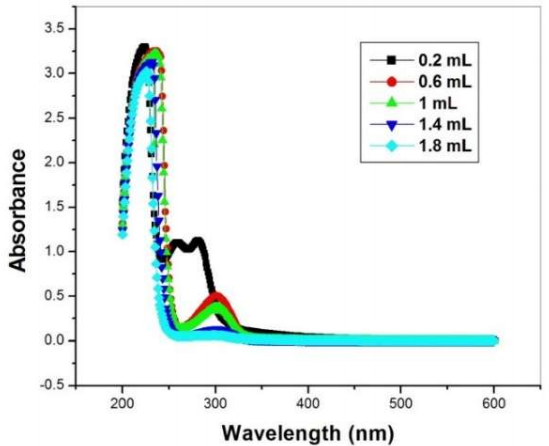
Figure 5: Cd-Na-DDTC absorption spectra in a solution with decreasing Na-DDTC, increasing CS and constant total Ct in 0.1 M NaClO4, at 298±0.1 K.
According to the results in Tables 5 and 6, Job’s diagrams were drawn by plotting absorbance as fL function, at 280 nm and 300 nm, in KNO3 and NaClO4 solutions, respectively. ( and q were derived from eqs. (7) and (14).
Table 5: Spectrophotometric data for Cd-Na-DDTC system in the 0.1 M KNO3 solution, with pH of 7.5, at different T.
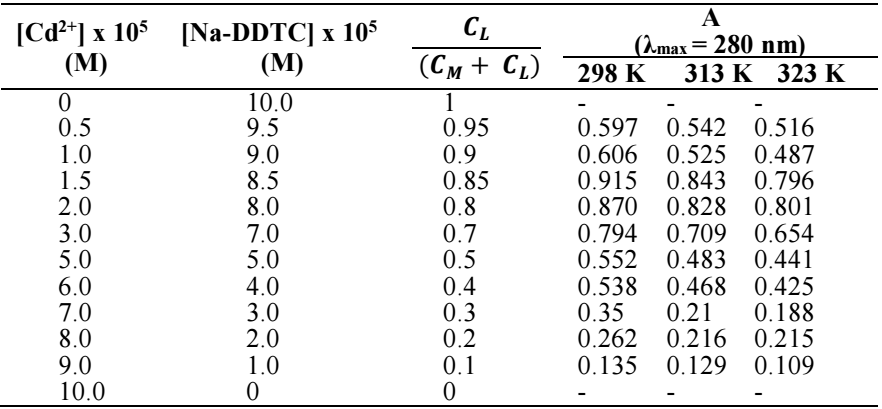
Table 6: Spectrophotometric data for Cd-Na-DDTC system in the 0.1 M NaClO4 solution, with pH = 7.5, at different T.
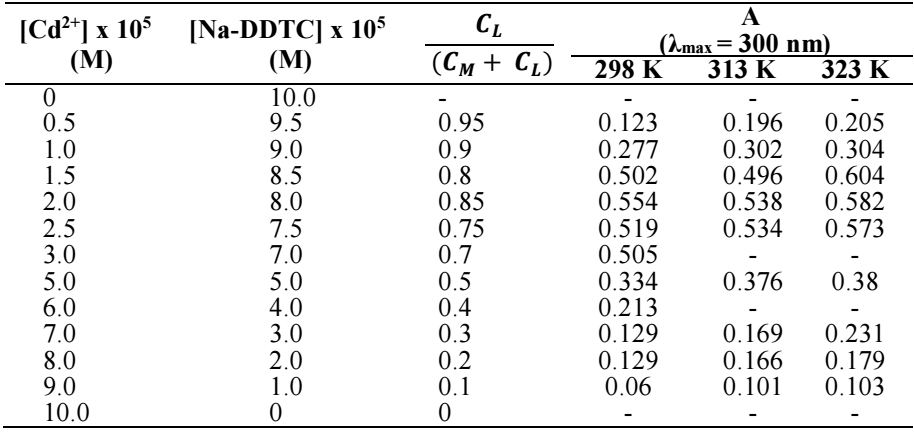
Fig. 6 depicts Job’s diagram in NaClO4, showing that the straight lines intersected at fL = 0.85, which indicates that Cd2+ coordinated with six Na-DDTC ligands. The same was seen for KNO3. In this case, q was found to be 5. All measurements were taken at a pH of 7.5, since Na-DDTC was dissolved in acidic media. These results can be compared with those obtained by DPV. In addition, in this area, hydroxyl groups formation was suppressed. When the results obtained in both SE were compared, it was found that ( in KNO3 was lower than that in NaClO4. From this, it can be concluded that nitrate ions have a complexing character, and compete with Cd2+ for Na-DDTC.
Effect of T
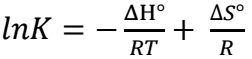
Thermodynamic parameters provide information about the structure, the kind of complex, and the nature of the interaction between Na-DDTC and Cd2+. These parameters were calculated using the eqs. (17-19):
 (17)
(17)
 (18)
(18)
These equations can be arranged to give eq. (19):
 (19)
(19)
The plot of lnK or ln( vs. that was not herein reported, gave a straight line. The slope and intercept of this straight line were (∆H°)/R and (∆𝑆°)/𝑅 (complexation entropy), respectively.
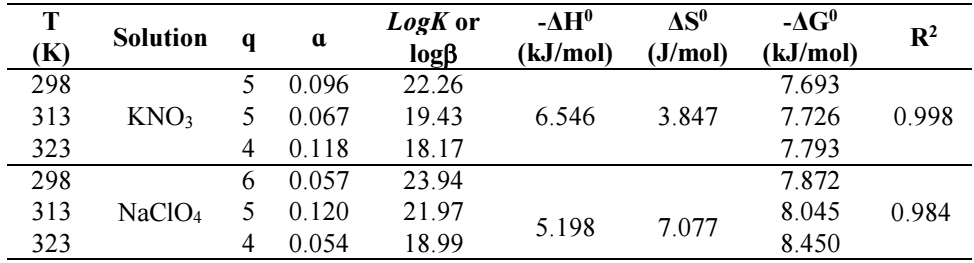
(, q and thermodynamic parameters of the complexation process were determined in KNO3 or NaClO4 solutions at different T (Table 7). These results show that ΔGº was negative, which confirms the spontaneous nature of the complexation process. Moreover, ( values decreased with increasing T. At 323 K, q was found to be 4. This shows that the complex’s formation was strongly favored at lower T. On the other hand, ΔHº negative values indicate an exothermic interaction between Na-DDTC and Cd2+. ΔSº positive values led to an increase in the solution, and accordingly, the complex’s structure disordering. ΔSº value in the NaClO4 solution was higher than that from the KNO3 one, showing an increase in steric factor 39. Kf was more favored in the NaClO4 solution.
Effect of Ct
DPV showed that, even in acidic media, Cd-Na-DDTC complex was formed. For this reason, IE(%) of the complex on CS corrosion in H2SO4 was studied. Corrosion parameters for CS in 0.5 M H2SO4 were determined, from WL measurements, at different Ct (50-500 mg/L) of the studied inhibitor, at various T (Fig. 7).
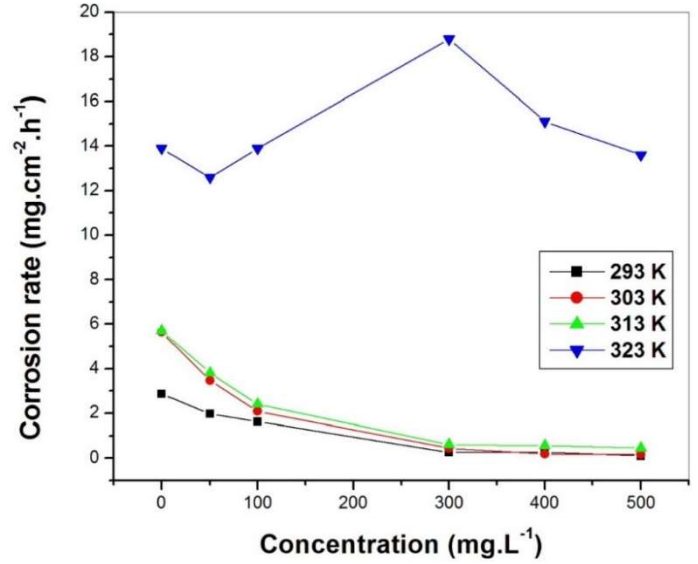
Fig. 7 shows that, at the initial Ct of Na-DDTC (50 mg/L), CR stayed high. Thus, this Ct was not enough to cover the entire CS’s surface, and IE(%) was low. When it was increased, CR decreased for all T, except 323 K, and the inhibitor formed an effective film that protected the CS’s surface. This was accompanied by a decrease in CR and an increase in IE(%), as a function of the inhibitor’s Ct. Maximum IE(%) (>96) was obtained with a Ct of 500 mg/L.
Concerning general dissolution mechanism for CS, the one proposed by 40, which found that CS is positively charged in a H2SO4 medium, was herein adopted. SO4 2- anions act as connecting bridges between protonated organic inhibitors and positively charged metal surfaces, as expressed in eqs. (20-22).
 (20)
(20)
 (21)
(21)
 (22)
(22)
Furthermore, CS corrosion in H2SO4 solutions was an electrochemical process. The anodic reaction was:
 (23)
(23)
And cathodic behavior corresponded to Volmer’s reaction:
 (24)
(24)
followed by Tafel’s reaction:
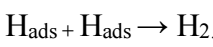 (25)
(25)
or Heyrovsky’s reaction:
 (26)
(26)
Effect of T
To investigate T effect on CR, WL measurements were performed at different T (298-323 K), without and with inhibitor, at various Ct (Table 8).
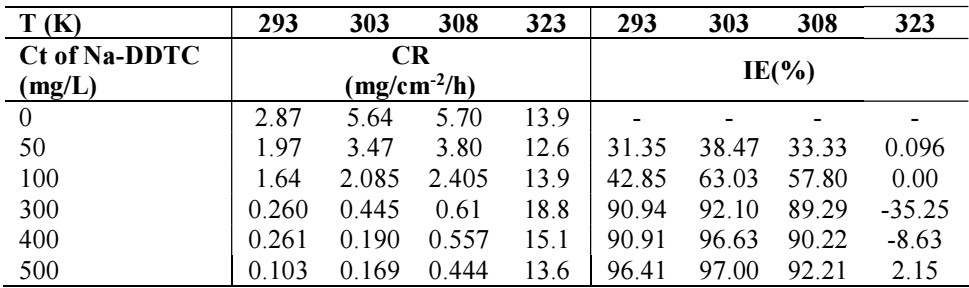
Inspection of the results reveals that CR decreased with higher inhibitor’s Ct. So, at 500 mg/L, IE(%) reached maximum values of 96.43, 96.98, and 92.2%, at 293, 303 and 308 K, respectively.
The fact that IE(%) decreased with higher T suggests a physical adsorption mechanism. This may be due to an increase in the solubility of the protective barrier. On the other hand, the decrease in IE(%) with higher T may also be due to a possible shift in Kads towards the desorption of the adsorbed inhibitor molecules. Inversely, IE(%) increased with T from 293 to 303 K. That suggests a chemical adsorption mechanism 41. So, physisorption was predominant at higher T, while chemical adsorption predominated at lower ones (≤ 303 K).
Synergistic effect of Cd2+
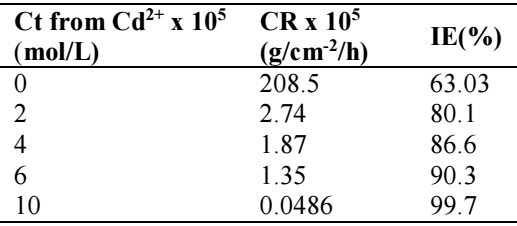
To show the effect of Cd2+ addition to Na-DDTC on its IE(%), the metal’s Ct was increased from 4.43 to 22.53 mg/L, while the ligand’s Ct was kept constant. Table 9 shows that the decrease in CR of CS in 0.5 M H2SO4 with Cd2+ was more pronounced than that without it. This table also shows that CR visibly decreased with increased Ct of Cd2+. As a result, IE(%) also substantially increased. This result may be explained by Cd ions and Na-DDTC molecules co-adsorption onto the CS surface, which involved a possible increase in Cd2+ synergistic effect. Therefore, it was concluded that Cd-Na-DDTC complex was more hydrophobic in the CS surface, and it had low electronegativity and easy polarization in the electronic layer.
Table 9: CR and IE(%) for XC38 CS in a 0.5 M H2SO4 solution, at 303 K, at different Ct of Cd2+ with 100 mg/L Na-DDTC.
It is worthwhile to note that, when H2SO4 was added to Na-DDTC without Cd ion, the synergistic effect was not seen. Inversely, when Cd ion was added to Na-DDTC without H2SO4, IE(%) increased. This could mean that although H2SO4 can degrade Na-DDTC, it cannot dissolve the complex.
Adsorption study
Most often, organic CI act on the metal surface by adsorption. It is known that the determination of adsorption types and thermodynamic parameters serves to understand the interaction between metal surface and inhibitor.
Assuming that CI mechanism was due to Na-DDTC adsorption, according to 42, the degree of metal surface coverage SC (θ) was calculated from WL measurements, using the following equation:
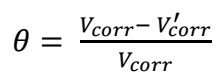 (27)
(27)
where Vcorr and V´corr are CR for solutions without and with inhibitor, respectively. Therefore, SC was calculated using eq. (28):
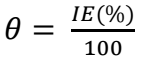 (28)
(28)
In order to verify the suitable adsorption mode, various isotherms, including Temkin’s, Frumkin’s, Flory Huggins’ and Langmuir’s, were tested. The best fit was obtained with Langmuir’s isotherm. According to it, the inhibitor Ct was related with SC by eq. (29):
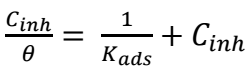 (29)
(29)
Kads denotes the interaction strength between adsorbent and adsorbate 43. The plot of C_𝑖𝑛ℎ/𝜃 vs. Cinh, at different T, yielded straight lines (Fig. 8 (A)).
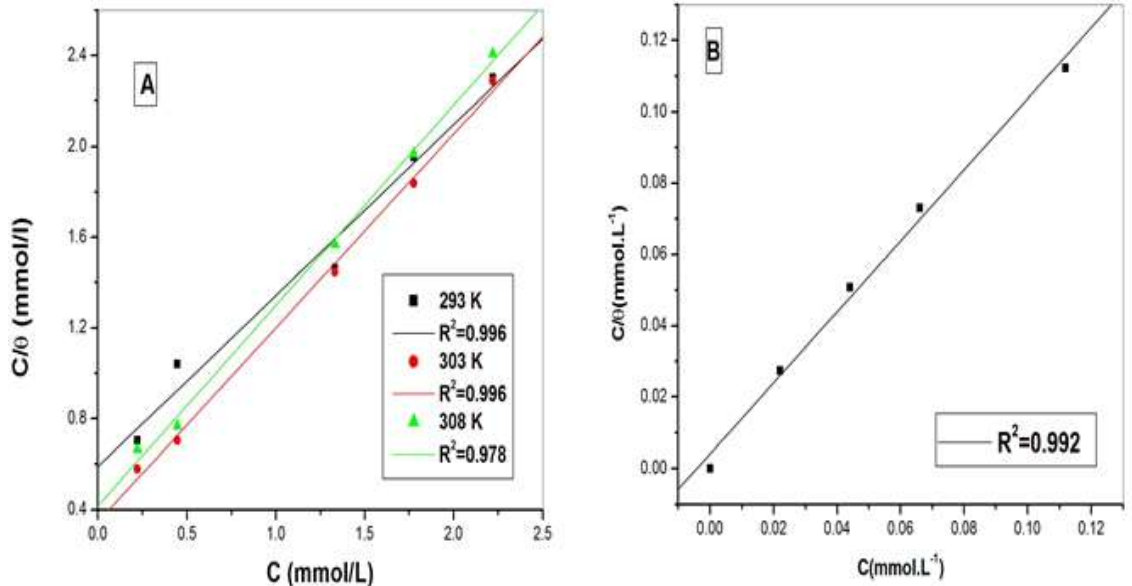
Table 10 shows R2 values and the slope of all straight lines, which were close to 1. This confirms that the inhibitor adsorption onto the CS surface obeyed Langmuir’s isotherm. However, a deviation of the slopes from unity can be seen, which was due to the interaction between adsorbates on the metal surface 44-46, and to the fact that adsorption heat changed with the increasing SC 44. So, Langmuir’s isotherm could not be rigorously applied. Thus, Na-DDTC’s behavior was interpreted by a modified Langmuir’s isotherm, which suggested that each molecule inhibitor could occupy n’s adsorbed sites (31). This modified expression is given in eq. (30):
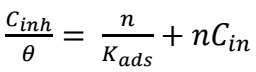 (30)
(30)
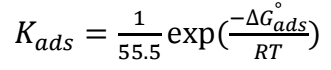
Kads value obtained from the intercept enabled to calculate ΔGºads, as in eq. (31):
 (31)
(31)
where 55.5 is the molar Ct of water in the solution in mol/L-1.
From the intercept in Fig. 8 (A) and from Eq. (31), Kads and ΔGºads (Table 10) for Na-DDTC were determined at different T. Kads larger value obtained at 308 K suggests that corrosion IE(%) of Na-DDTC improved at this T, leading to the formation of a protective film at the metal/solution interface, which reduced chemical attacks on CS. ΔGºads negative values at all tested T revealed that the adsorption process was spontaneous.
According to 45, ΔGºads values up to -20 kJ/mol cause physisorption, while values lower than -40 kJ/mol lead to chemisorption. In this study, ΔGºads values were from -20 to -40 kJ/mol. This suggests that Na-DDTC went through both physical and chemical adsorption 47.
The plot of 𝐶_𝑖𝑛𝑏/𝜃 vs. Cinh, in Cd-Na-DDTC complex’s case, was a straight line (Fig. 8 (B)) with the slope equal to unity and R2 equal to 0,99. This confirmed that the inhibitor adsorption followed Langmuir’s isotherm. The intercept gave Kads, as represented in Table 10.
Table 10: Thermodynamic parameters obtained from gravimetric study for Na-DDTC and Cd-Na-DDTC adsorption onto the CS surface in 0.5 M H2SO4.
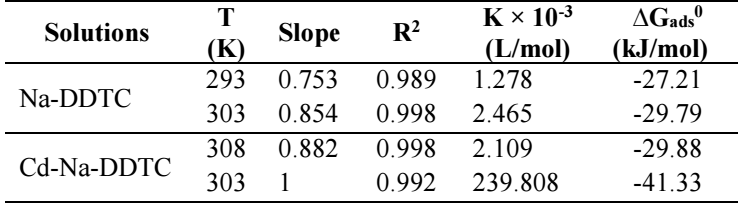
The obtained results indicate that Kads values were higher than those obtained by Na-DDTC alone, which might be due to the presence of a strong bond between adsorbate and adsorbent. More importantly, ΔGºads value for Cd-Na-DDTC complex around -40 kJ/mol led to chemisorption process. This was due to the transfer of an unshared electronic pair of organic molecules to the metal surface, thus forming a dative bond.
Synergistic effect mechanism
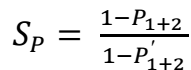
Sp for different Ct of Cd2+ in 0.5 M H2SO4 with 100 mg/L Na-DDTC was determined from the relationship proposed by 48 (eqs. (32) and (33)).
 (32)
(32)
with
 (33)
(33)
where P1, P2 and P'1+2 are IE(%) values of Na-DDTC, Cd2+ and of Cd-Na-DDTC, respectively. Sp values are given in Table 11.

It was noted that all Sp values were greater than unity. This result shows that Cd-Na-DDTC high CI on CS was due to the synergy effect. As a matter of fact, 49 explained the synergy effect either by competitive or by cooperative adsorption between two compounds. In the first case, the two compounds are adsorbed on different sites onto the electrode surface. In the second case, one compound is chemisorbed onto the metal surface and the other is physisorbed onto it. If Sp < 1, thre is competitive adsorption. If Sp > 1, cooperative adsorption occurs. The values obtained in this study were well above unity, which shows cooperative adsorption between Na-DDTC and Cd2+. Thus, the synergistic effect can be explained as follows: Na-DDTC was protonated in the acidic solution. Then, the protonated Na-DDTC and Cd2+ could attach onto XC38 (CS) through electrostatic interaction with the negatively charged surface, which was provided with the specifically adsorbed SO4 2- anions onto the FeSO4 2- surface. When Na-DDTC adsorbed onto the CS surface, coordinate bonds were formed by the partial transference of electrons from unprotonated N and S atoms and delocalized π electrons in S atoms groups to the metal surface and to the Cd2+ ions, which were able to form stable complexes with the ligand. Therefore, in the adsorption process, both physical and chemical adsorption took place.
Conclusion
Experimental results indicated that Na-DDTC exhibited high propensity to form a stable complex with Cd2+, in both KNO3 and NaClO4 solutions. ( of the produced compound exhibited higher values in NaClO4 than those of KNO3. This was due to the competition for Cd2+ between NO3 - ions and the ligand. Negative ∆G° values seen in the complexation process revealed the intrinsic spontaneity of complexation. Observed values show that ∆G° became more negative at lower T, providing evidence for the enhanced stability of the complex under these conditions. The exothermic interaction between Na-DDTC and Cd2+ was shown by the existence of negative ∆H° and positive ∆S values, highlighting the disorder of the complex structure. DPV and spectrophotometric measurements were in good agreement. Furthermore, Na-DDTC functioned as CI for XC38 CS, when immersed in 0.5 M H2SO4. An increase in the Ct from Na-DDTC enhanced IE(%), while higher T diminished it. Na-DDTC adsorbed according to Langmuir’s adsorption isotherm. Thermodynamic data suggested that Na-DDTC action involved both physisorption and chemisorption processes. The synergistic impact of Cd2+ ions on CI by Na-DDTC was also highlighted. The chemisorption process of Cd-Na-DDTC was confirmed by measuring ∆G°ads value.
Authors’ contributions
Djamila Hammoum: performed experiments; collected the data; wrote the paper. Lahcène Larabi: chose the problem; conceptualized ideas; supervised the whole work; wrote some sections of the manuscript. Yahia Harek: helped analysing results; guided in the paper writing.
Abbreviations
A: absorbance
A0: initial absorption before dissociation
AML: absorbance value of metallic complex
CdCl2H2O: cadmium chloride
CI: corrosion inhibition/inhibitor
CL: concentration of the ligand
CM: metal concentration
CR: corrosion rate
CS: carbon steel
Ct: concentration
CVM: continuous variation method
DPV: differential pulse voltammetry
DTC: dithiocarbamates
Ep: peak potential
Epa: anodic peak potential
Epc: cathodic peak potential
F: Faraday constant
FL: molar fraction of ligand
Fw: formula weight
H2SO4: sulfuric acid
HMDE: Hanging Mercury Drop Electrode
IE(%): inhibition efficiency
IM: currents for free metal
IMLq: current for complexed metal
Ipa: anodic peak current
Ipc: cathodic peak current
Kads: equilibrium constant of the adsorption
Kf: formation constant of complex
KNO3: potassium nitrate
[L]: molar concentration of ligand at equilibrium
[M]: molar concentration of the metal ion at equilibrium
[MLq]: molar concentrations of metal complex at equilibrium
NaClO4: sodium perchlorate
Na-DDTC: sodium diethyldithiocarbamate tryhydrate (C5H16NNaO3S2)
q: coordination number of ligand
R: universal gas constant (8.315 J.K-1.mol-1)
R2: linear correlation coefficient
SC: surface coverage (θ)
SE: supporting electrolyte
Sp: synergy parameter
T: absolute temperature in Kelvin (K)
WL: weight loss
Symbols definition
α: fraction of dissociation of complex
β: stability constant of the complex
n: number of electrons involved in the reaction
(Ep: difference between metal ion reduction and the complex peak potentials
(G°: standard free energy change of complexation
ΔGºads: standard free enthalpy of adsorption energy
(H°: standard enthalpy changes of complexation
(S°: standard entropy changes of complexation
ԐL: extinction coefficient of ligand
ԐM: extinction coefficient of metal
γM: metal activity coefficient
λmax: maximum wavelength

