




 Inglês (pdf)
 Artigo em XML
 Referências do artigo
 Tradução automática
 Enviar este artigo por email
 Citado por SciELO
  Similares em
SciELO
Similares em
SciELO 
 Permalink
Introduction
Schiff bases have shown to possess medicinal and biological anticonvulsant, anti-inflammatory, anti-cancer, anti-bacterial, anti-microbial, anti-tubercular, anti-viral, anti-fungal, anti-HIV and anti-oxidant properties 1,10.
They are well-known as fabulous ligands, since the imine groups forming chelates with metal ions show a strong affinity with transition metal ions, making them very stable materials suitable for surface coating, catalysis and electro-catalysis 11,18.
Studies by 2-23,19 on unsymmetrical tetradentate N2O2 Schiff base complexes for biological activity, and CI of steel sheets, have revealed that, in a chlorinated basic medium simulating the pore water in concrete, the more higher the Ct of aggressive ions such as Cl-, the stronger the CR 24-26. The addition of Schiff's bases CI at different Ct remarkably decreases CR. Sometimes, the addition of small quantities of these compounds (10-5-10-6 M) improves CI 27,28.
Schiff-base N,N-bis(2-furaldehyde)−1,3-diaminopropane and its complex with Fe have been prepared and used as CI for MS in a 3.5% NaCl medium artificial marine environment, to evaluate the functional groups’ IE(%) 29. Electrochemical measurements showed the inhibitors’ significant resistance to charge transfer through the electrolyte-metal interface, and mixed-type behavior. Furthermore, the film formed onto the MS surface was examined by SEM 29.
Essential oil of Thymus satureoides and octacalcium phosphate were studied as CI for stainless and carbon steels in a saline environment of 3% NaCl. The compounds had IE(%) of 82 and 93.1%, respectively. Examination of the metal surface contact morphology by SEM revealed the formation of a protective layer 30,31.
Due to DPPH, ABTS and C40H56/C18H32O2 bleaching and reducing properties, they have been the most widely used for assessing AA. AA is defined as the average free radical scavenging capacity, and it is measured using DPPH and ABTS, which are stable free radicals. AA is also evaluated by other methods based on different mechanisms of action, such as the ability to reduce and inhibit lipid peroxidation. C40H56 bleaching and C18H32O2 test is one of the AA tests suitable for plant samples and other products. In this test, AA is determined by measuring the production inhibition of volatile organic compounds, and the formation of conjugated diene hydroperoxides resulting from the oxidation of C18H32O2, which leads to the discoloration of C40H56.
The transformation of ferric Fe into ferrous FE has been determined as reduction capacity of compounds, which may indicate electron-donation activity, an important mechanism of AA, and it may be strongly correlated with other AA.
In a study by 32, three Schiff bases have been synthesized by condensation reaction of the same aminophenol in different positions (ortho/meta/para) with 2-hydroxy-3 methoxybenzaldehyde, of which biological properties have been assesses (scavenging of DPPH radical and C40H56 bleaching). The variable results showed on a certain degree of increasing inhibitory effects by the synthesized Schiff bases.
DPPH analysis shows its good IE(%) against the corrosion of MS reinforcements with concrete in 0.5 M NaCl, due to N and O atoms in the ligand structure, which are suitable sites for interaction between this compound and the MS surface, in the CI process 27,28.
The present work aimed to investigate the IE(%) and AA of an original synthesized Schiff base (L1) vs. rebar corrosion in NaCl. First, L1 structure was synthesized and determined by XRD 27. Then, electrochemical proprieties were examined employing PDP technique. Finally, AA, by DPPH, ABTS, C40H56/C18H32O2 and FRAP tests, was investigated.
Materials and methods
Schiff base (L1) synthesis
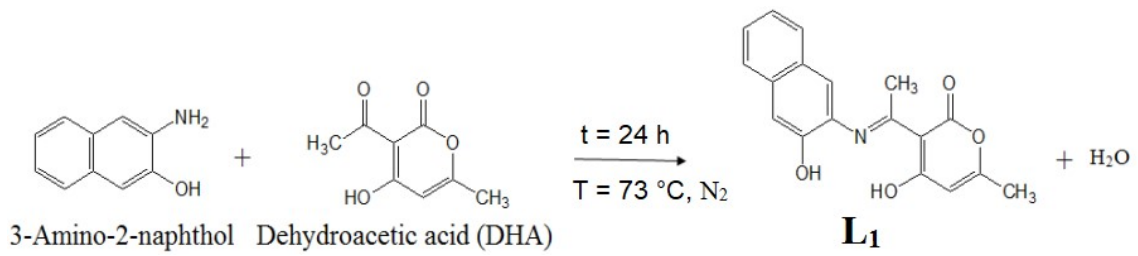
L1 was synthesized through a condensation reaction with 1/159.19 and 1 mmol/168.15 mg 3-amino-2-naphthol and DHA, respectively (Scheme 1) 27.
L 1 characterization
Crystal structure characterization
X-RD intensities for L1 were assessed at the University of Strasbourg, France. The data were collected at 173(2) K, on a Collect diffractometer (Nonius BV, 1998), up to a graphic monochromator, using a fine-focus Mo K α sealed tube as radiation source, and employing phi and omega scan method. L1 structure was solved and refined by SHELXS-97 program (Sheldrick, 1997) 33.
Electrochemical study
The electrochemical study was carried out using PGSTAT309N (Autolab Potentiostat/Galvanostat). The three-electrode system was comprised by GCE as WE, Pt plate (S = 10 mm2) as AE, and SCE (Hg/Hg2Cl2/KCl) as RE. NOVA Software Switzerland piloted by Pc was used to analyse experimental results. The GCE surface was polished with wet SiC paper of size 350-2000, rinsed with acetone, and then with distilled water. GCE was placed individually in the electrolytes (0.1 M KOH and DMSO), with 10-6 M L1 and without it.
Before starting and recording polarization curves, OCP was maintained for 30 min, until it reached a steady state. Firstly, the cathodic branch was recorded. Then, the anodic branch was determined after establishing OCP. Potential sweep rate was 5 mV/s-1. Electrochemical tests were carried out at room T of 25 ºC.
CI behaviour of L1 was examined using a VOLTA- LAB PGZ 301, MS coated with parafilm as WE, a Pt plate (S = 10 mm2) as AE, and Hg/HgO system as RE. Voltamaster 4 software was employed to analyse experimental results.
Before starting and recording polarization curves, OCP was assured for each plot of polarization curves, during 30 min. For the three electrode systems in the different solutions, the potential became stable. At this moment, the stability potential value was taken and added to the polarization curves plot, and Tafel parameters (Icorr and Ecorr) were determined. At first, the cathodic branch was recorded. Then, the anodic branch was determined, after establishing OCP. Potential sweep rate was 10 mV/s-1.
AA
DPPH radical scavenging assay
Free radical scavenging activity of extracts against stable DPPH was determined using the method described by 34. 0.5 mL samples were added to a 1 mL 0.1 mM DPPH solution. The mixture was strongly shaken and left to stand at room T, for 30 min. The samples’ changes in color (from deep-violet to light yellow) and absorbance were measured at 517 nm. Radical scavenging activity (%) was calculated using eq. (1):
 (1)
(1)
where Acontrol is the absorbance of the control reaction (containing all reagents, except the sample) and Asample is the product absorbance.
A curve of IE(%) or scavenging effect against the sample Ct was plotted. Then, the sample Ct required for 50% IE(%) was determined. The value for each test sample was presented as the IE(%) curve at 50% or IC50.
ABTS free radical scavenging ability
Free radical scavenging activity was determined by ABTS decolorization study by 35. It was generated by a reaction of 7 mM ABTS with 2.45 mM K2S2O8. The reaction mixture was allowed to stand in the dark for 16 h, at room T. The solution was then diluted by mixing ABTS with CH3OH, to obtain an absorbance of 0.70 ± 0.02 units, at 734 nm. Then, 50 μl sample were mixed with 1 mL ABTS + solution, and kept for 30 min at room T. The reaction mixture absorbance was measured at 734 nm. ABTS scavenging capacity on the product was compared with that of QUER and BHT. IE(%) was calculated by Eq. (2):
 (2)
(2)
where Abc and Abs are ABTS radical’ CH3OH and sample/standard absorbance, respectively.
C40H56 bleaching test
In this test, the AA of the products was determined by measuring the inhibition of C40H56 oxidative decomposition (discoloration) by C18H32O2 oxidation products, according to the method described by 36-38. C40H56/C18H32O2 emulsion was prepared by dissolving 0.5 mg C40H56 in 1 mL chloroform, to which 25 μl C18H32O2 and 200 mg Tween 40 were added. Then, 100 mL distilled water saturated with O were added to the reaction mixture. 350 μl extract or BHT solubilized in 2 mg/mL CH3OH were mixed with 2.5 mL emulsion.
The same procedure was repeated with CH3OH and H2O, as negative control. Absorbance was measured at 490 nm, after 1, 2, 3, 4, 6 and 24 h IT, at room T, in the dark. C40H56 decomposition (%) by the extract’s AA was calculated by Eq. (3):
 (3)
(3)
where AA% is AA percentage, and ABStest and ABSBHT are absorbance values without and with BHT, respectively.
Reducing power activity
The reducing power of the product was estimated according to the method described by 39. 100 µl of the sample with various Ct were mixed with an equal volume of 0.2 M PBS (PH = 6.6) and 1% [K3Fe (CN6)]. The reaction was incubated at 50 ºC, in a water bath, for 20 min, and it was terminated by the addition of 250 µl 10% C2HCl3O2, followed by centrifugation, for 10 min, at 3000 rpm. 250 µl of the solution upper layer were mixed with 250 µl distilled water and 500 µl FeCl3. The absorbance was measured at 700 nm against a blank. Stronger absorbance indicated higher reducing power. BHT, QUER and trolox were used as positive controls.
Results and discussion
Characterization of L1
X-RD description
X-RD patterns extracted from CIF 27 confirm the presence of the polycrystalline phase of L1 as monoclinic crystal structure, with preferential orientation along (110), (002), (200), (10-2), (011), (110), (102), (11-1), (210), (211), (212), (021), (121), (12-2) and (122) (Fig. 1).
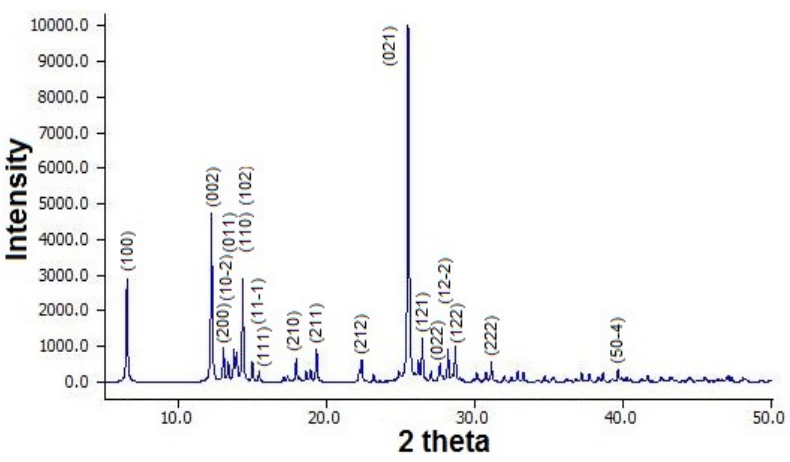
The same intense peaks that appeared at 2 theta = 12.26, 15.39 and 25.58 will only be characteristic peaks of 3-Amino-2-naphthol 28.
CV
Electrochemical study
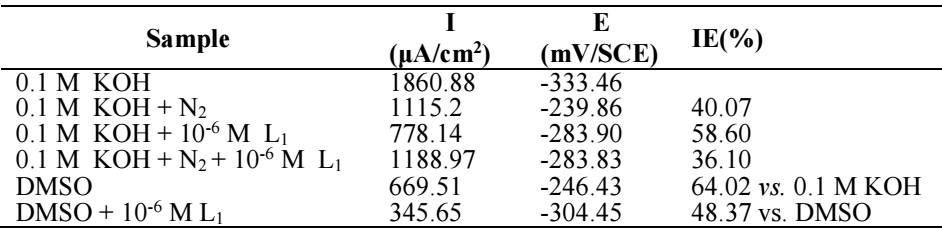
Electrochemical characteristics, such as Ecorr, icorr and IE(%) are presented in Table 1.
IE(%) was obtained from eq. (4):
 (4)
(4)
where icorr and icorr(inh) are icorr values without and with inhibitor, respectively, obtained by intersecting Ecorr, (a and (c lines (Fig. 2).
N2 gas effect
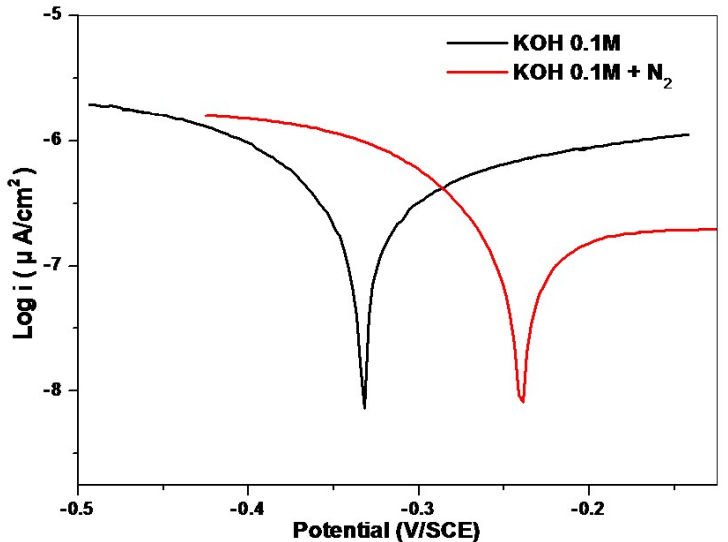
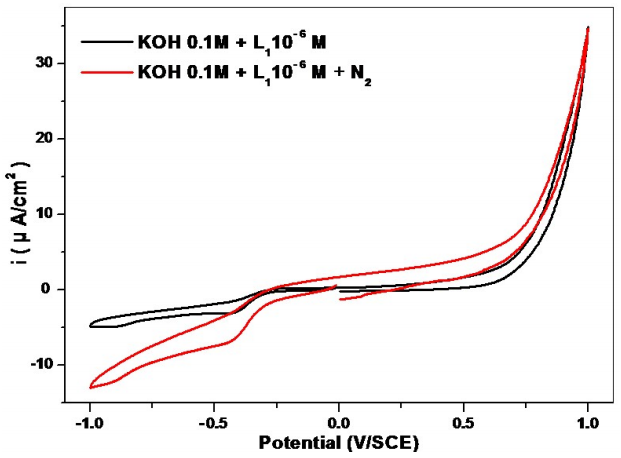
In CV for GCE (Fig. 3), there was one positive reduction peak shift from -333.46 (0.1 M KOH) to -239.86 mV (0.1 M KOH + N2), attributed to O2 electrochemical reduction to H2O2 (reactions 5, 6 and 7) 40.
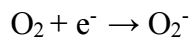 (5)
(5)
 (6)
(6)
 (7)
(7)
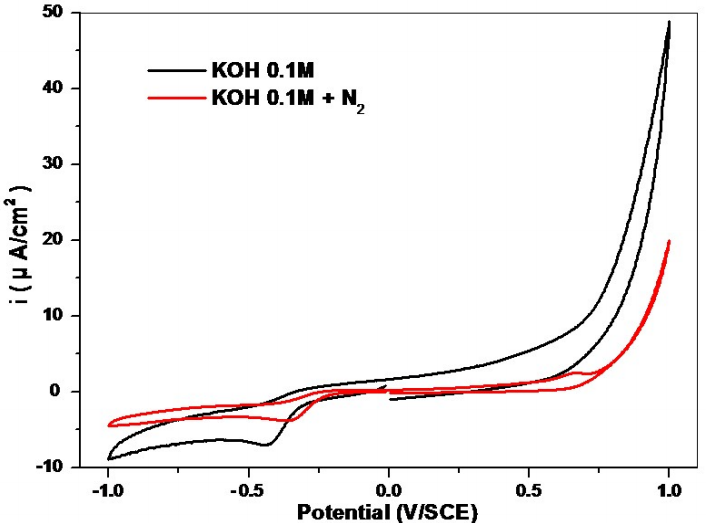
Icorr decreased from 1860.88 to 1115.2 μA /cm2 , for 0.1 M KOH and 0.1 M KOH + N2, respectively (Table 2), due to H+ consumption and reaction in the solution with O, which increased its basicity, and decreased the conductivity at the solution-electrode interface 41.
L1 effect
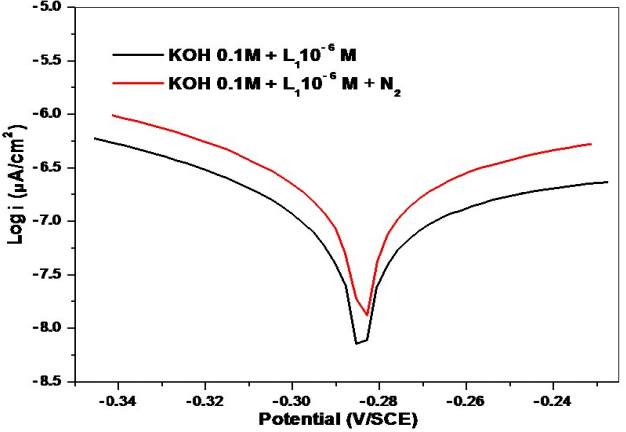
L1 addition (Figs. 4 and 5) led to a decrease in icorr and to a shift in Ecorr towards more positive values: -333.46 (0.1 M KOH) to 283.90 mV (0.1 M KOH + 10-6 M L1), with an IE(%) of 58.60.
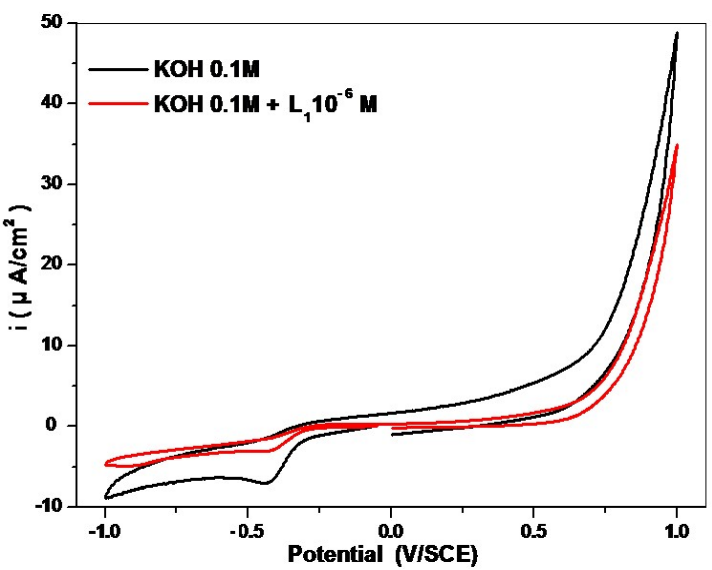
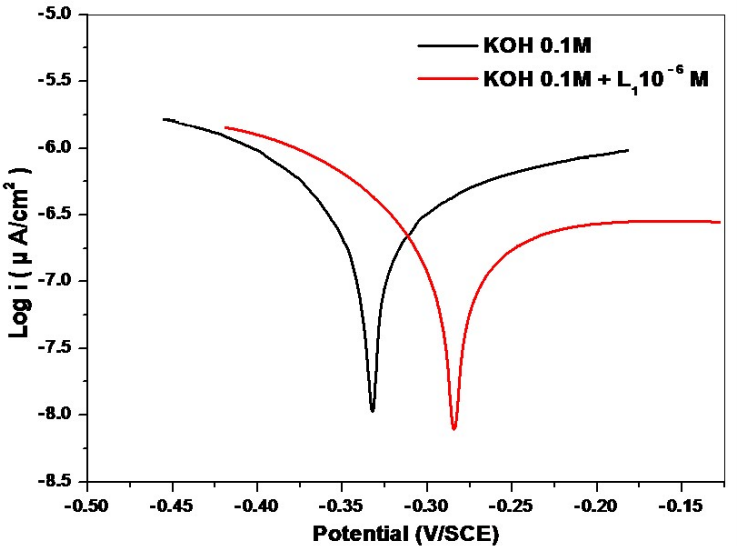
However, looking at CV and Tafel curves of GCE (Figs. 6 and 7), degassing with N2 had no potential displacement influence, since Ecorr was -283.83 mV/SCE. However, it increased icorr and decreased IE(%) to 36.10.
Solvent effect
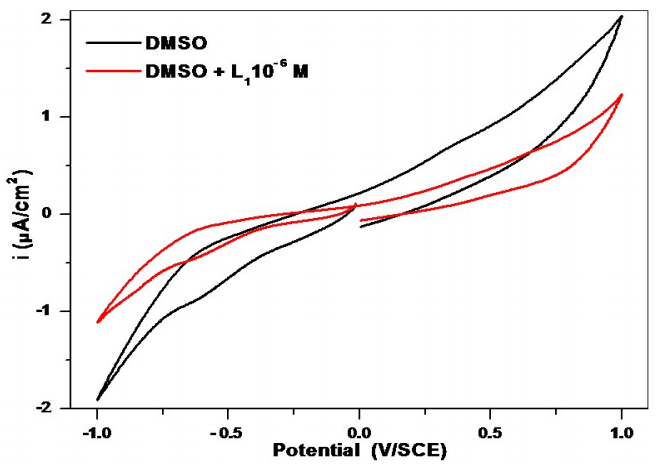
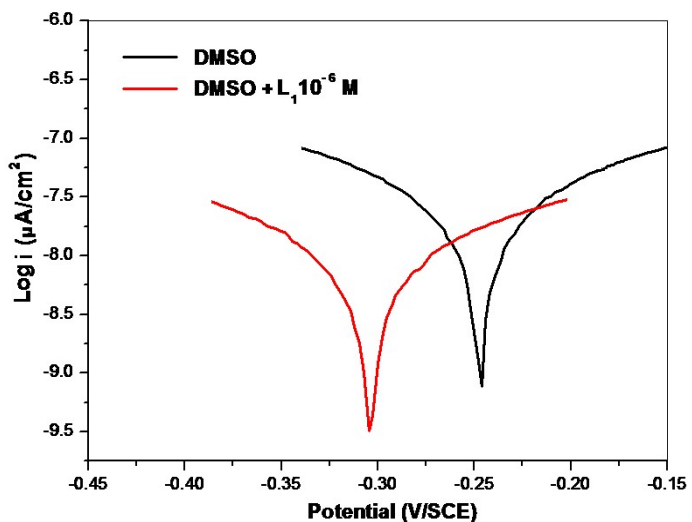
According to Table 2, GCE immersion in blank DMSO greatly decreased icorr and caused Ecorr shifts to positive values vs. 0.1 M KOH. 10-6 M L1 addition decreased icorr even more (IE(%) = 48.37), with an Ecorr displacement to negative values vs. DMSO (Figs. 8 and 9).
Corrosion study
Ecorr and Icorr dissolution peaks for MS immersed in KOH (pH = 13.5) with 0.8 M NaCl, as a function of IT (0, 7, 14, 21 and 28 days), were assessed. WE were cylindrical MS rebars (Table 2) with 6 mm diameter and 28.26 mm2 S.
Before each electrochemical test, the WE lower section was mechanical polished with SiC paper of different grain sizes, then with Al. The remaining electrodes were protected with Teflon, and each polishing was followed by rinsing with distilled water.
Throughout the study and after each test, the WE, RE and AE were cleaned with distilled water. The WE underwent the same polishing conditions, to have reproducible results.

Polarization curves without L1
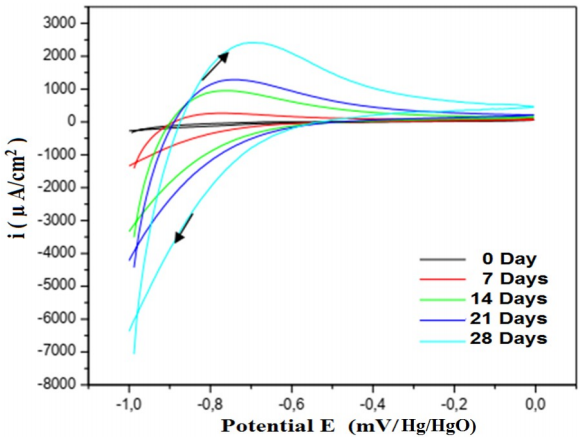
PDP curves obtained by studying MS electrochemical behavior in 0.8 M Cl-, as a function of IT (Fig. 10), showed that the corrosion peak became more intense.
The corrosion mechanism in the basic medium proceeded according to reactions (8-9) 42-47:
 (8)
(8)
 (9)
(9)
During the second stage of the corrosion process, the dissolved metal ion (Fe2+) reacted with hydroxyls to form a precipitate which covered MS, following reaction (10):
 (10)
(10)
In solid concrete, i.e., if pH > 11, and in Cl- total absence, FeOOH protective layer formation is noted, following reaction (11):
 (11)
(11)
In Cl- presence, the coating product no longer became waterproof, and MS corroded, according to reactions (12-15):
 (12)
(12)
 (13)
(13)
 (14)
(14)
 (15)
(15)
When the Ct of Cl- is lower than that of hydroxyl ions, stable Fe(OH)₂ formation occurs; if it is higher, formed Fe(OH)₂ is unstable, and green rust ([2 Fe(OH)2, FeOHCl, Fe(OH)2 Cl]), as an intermediate compound, is formed, which turns into lepidocrocite (hydrated ferric oxide (Fe2O3, H2O)) containing chlorine, according to reaction (16):
 (16)
(16)
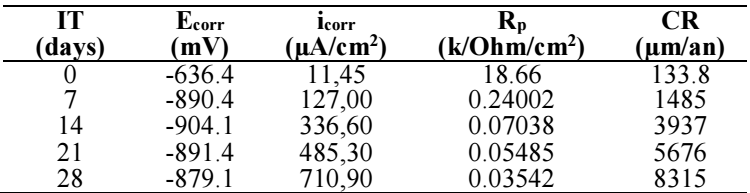
The use of these curves and the plots of corresponding Tafel curves allowed to determine various electrochemical parameters (Ecorr, Icorr, Rp and CR). Table 3 shows a shift on Ecorr towards negative values, with an increase in CR and a decrease in Rp, as an IT function.
Polarization curves with L1
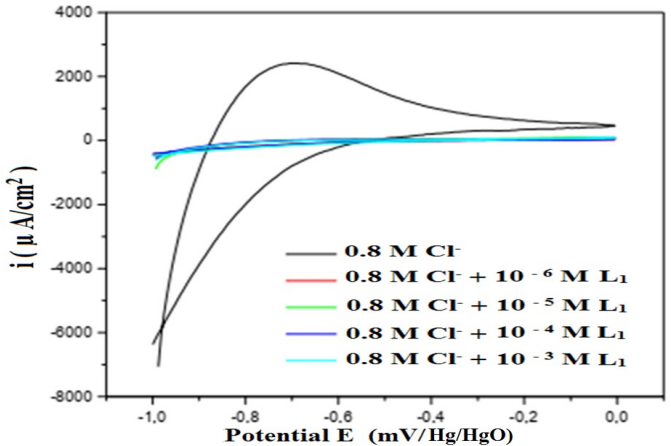
The analysis of polarization curves, obtained (Fig. 11) for MS immersed in a solution simulating concrete pore water with 0.8 M Cl- and different Ct of L1, at an IT of 28 days, shows that the CI addition decreased icorr.
These curvatures allowed drawing Tafel curves (Fig. 12), which show a shift in Ecorr towards less negative values, and a reduction in icorr. The corresponding electrochemical parameters are grouped in Table 4.
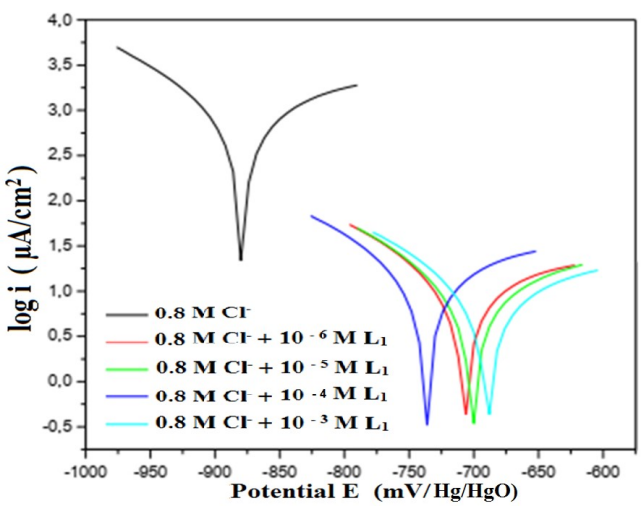
Table 4: Electrochemical characteristics of MS in a solution simulating concrete pore water with Cl- and different Ct of L1, for 28 days IT.
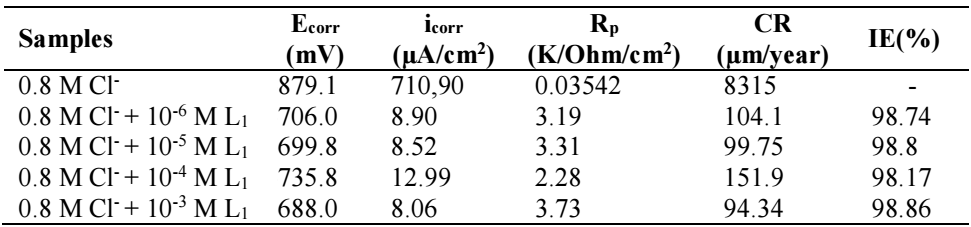
The addition of various Ct of L1 decreased CR of MS, as a function of IT (Table 5).
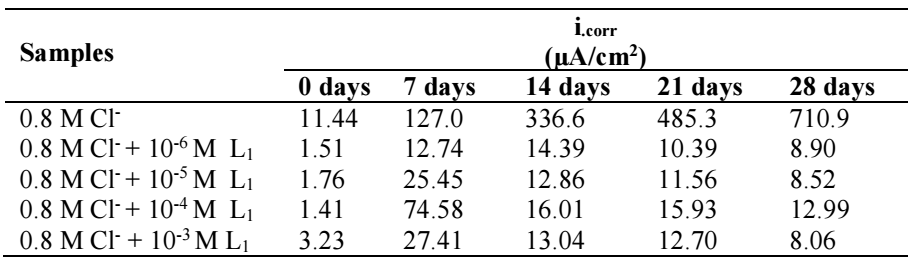
CR evolution of MS in a solution without and with different Ct of L1, as a function of IT (Fig.13), shows that it is always lower than that of MS immersed in a solution with blank Cl-.
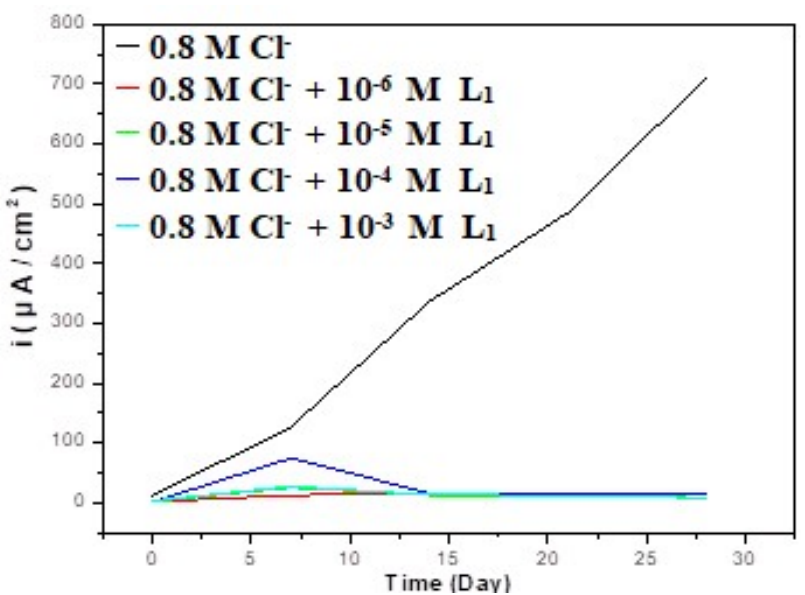
The immediate addition of L1 caused a significant inhibition (≥ 70%) which increases as a function of IT, with lower Ct. This confirms the L1 inhibitory action by the creation of a protective film composed of an activated complex [Fen(Cl)p(L2)m] 28) which is responsible for blocking the of Cl- ions access to the MS/solution interface. Therefore, CI was enabled by the adsorption of this activated complex onto the active sites 28, due to the electron density of N and O unpaired electrons enhanced by naphthol group electrons.
AA
L1 antiradical activity is remarkable, which was given as IC50 = 0.022 ± 0.003 µg/mL. Such activity is significantly higher than that of Trolox (IC50 = 0.005 ± 2.985E-05 µg/mL) and QUER (IC50 = 0.003 ± 5.248E-05 µg/mL) (Fig. 14).
L1 antiradical activity, given as IC50 = 0.022 ± 0.003 µg/Ml, was remarkable.
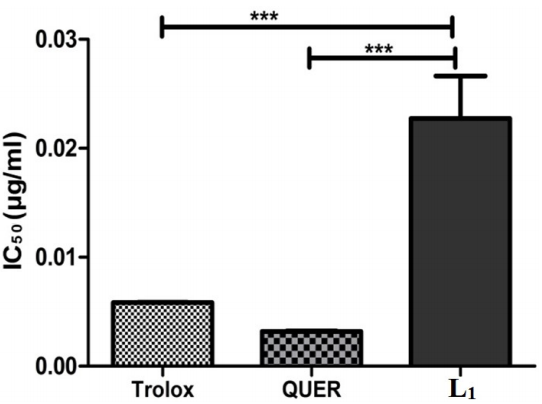
Figure 14: Scavenging activity of L1 on DPPH radical. Data were presented as IC50 means ± SD (n = 3); ***p < 0.001 were compared to Trolox and QUER as standards.
Such activity is significantly higher than that of Trolox (IC50 = 0.005 ± 2.985E-05 µg/mL) and QUER (IC50 = 0.003 ± 5.248E-05 µg/mL) (Fig. 15). The measurement of AA with DPPH and ABTS assays is rapid, sensitive, and more frequently applied for preliminary evaluation of various substances. Although the basic principles are similar, ABTS assay is preferable for assessing the activity of lipophilic and hydrophilic antioxidants 48-51. In contrast, DPPH is more selective, because it does not react with flavonoids, which do not contain hydroxyl groups in B ring 52,53.
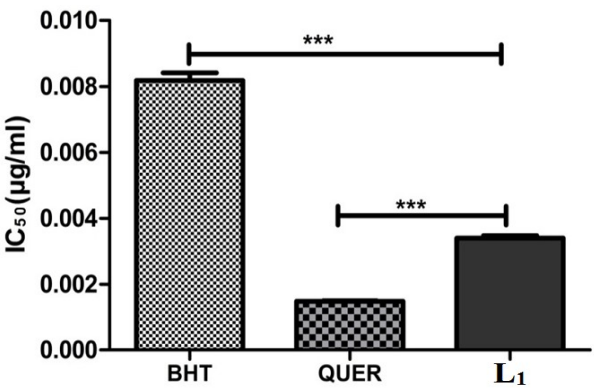
Figure 15: Scavenging activity of L1 on ABTS radical. Data were presented as IC50 means ± SD (n = 3); ***p < 0.001 was compared to BHT and QUER as standards.
According to the obtained results, a very important anti-lipid peroxidation activity was observed with L1. Fig. 16 shows stronger AA (80.22 ± 1.585%) than that of synthetic BHT (100 ± 2.890%), at the same Ct.
This activity may be due to the nature of antioxidants that inhibit C18H32O2 oxidation and neutralize free radicals, or simultaneously both 54,56. A product that delays or inhibits C40H56 bleaching can be described as a free radical scavenger and as a primary antioxidant 57-59.
QUER, Trolox and BHT standard antioxidants showed potent reducing power with an IC50 value of 0.002 ± 5.211E-05; 0.008 ± 9.142E-05 and 0.016 ± 0.000 µg/mL, respectively.
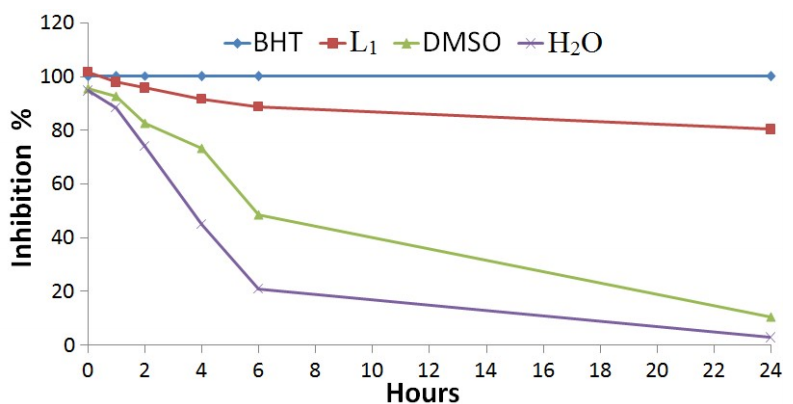
Figure 16: L1 AA (2 mg/mL, at 24 h IT) was measured by C40H56 bleaching method. BHT was used as reference antioxidant. Values are mean ± SD (n = 3).
According to Fig. 17, L1 has a strong reducing effect similar to Trolox, with IC50= 0.008 ± 0.000 µg/ mL, and moderate activity, in comparison with BHT and QUER.
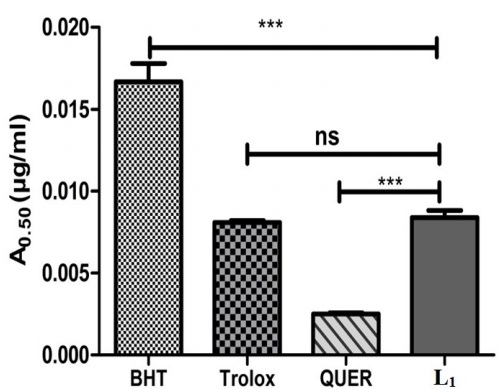
Figure 17: L1 reducing power. Values are as absorbance means ± SD (n = 3). (ns: no significant difference. *** p < 0.001 was compared to BHT, Trolox and QUER, as standards.
This power is due to the presence of electron-donating compounds that can inhibit chain reactions triggered by free radicals, and reduce oxidized intermediates of lipid peroxidation processes 60,63. L1 was additionally stabilized by an intramolecular hydrogen bond with the ortho-phenolic group. Moreover, the introduction of donor substituents (-CH 3) to phenol hydroxyls is known to reduce the bond dissociation enthalpy of the O-H bond, thereby stimulating the hydrogen abstraction process 64. The comparison of the Schiff base’s AA with Trolox and QUER provides valuable insights into its effectiveness. It should be noted that AA of L1 phenolic compound are mainly associated with their relatively high reactivity in hydrogen abstraction reactions. This circumstance may be explained by the stabilization of the formed phenoxyl radical by delocalization of the unpaired electron in an extended conjugated two aromatic systems. Enhancement of AA of L1 is usually associated with the introduction of additional hydroxyl groups into their chemical structure, as well as with a decrease of sterical hindrance at the hydrogen abstraction site 65.
Conclusion
In this paper, an original non-symmetrical tridentate Schiff base (L1) was synthesized by a condensation reaction of an aldehyde and an amine, for electrochemical and biological study. This product was produced in a well-defined crystalline form.
The polarization curves, which were carried out using GCE as WE, showed the presence of reduction peaks, due to O reduction.
The inhibition study of MS, in a 0.8 M Cl- simulated solution of concrete water pores, obtained good results at diverse Ct of L1, with a rate of around 98%. The in vitro AA was evaluated.
O and N were the atoms responsible for physicochemical interaction and AA. Thus, the density and morphology of this organic product may influence AA capacity.
L1 was a best scavenger of ABTS than DPPH, and the most active in C40H56/C18H32O2 test, with an inhibition percentage of 80.22%. The results showed that L1 displayed an important reducing effect similar to that of Trolox. L1 was additionally stabilized by an intramolecular hydrogen bond with the ortho-phenolic group. It should be noted that AA of L1 phenolic compound is mainly associated with its relatively high reactivity in hydrogen abstraction reactions. This circumstance may be explained by the stabilization of the formed phenoxyl radical by delocalization of the unpaired electron in an extended conjugated two aromatic systems. Enhancement of AA of L1 is usually associated with the introduction of additional hydroxyl groups into their chemical structure, and with a decrease of sterical hindrance at the hydrogen abstraction site.
Acknowledgments
The authors gratefully acknowledge the support of the Directorate General for Scientific Research and Technological Development (DGRSDT) of Algeria, and Mr. Fateh Mayouf from Research Center in Industrial Technologies, for his help.
Authors’ contributions
Youcef Bellal: conceptualized ideas; wrote the paper; review and editing; synthesis and caracterization; methodology; voltammetry experiment; analyzed data; interpretation; corresponding author. Meriem Hamoudi: biological experiment; interpretation; developed some sections of the manuscript. Samira Ghedjati: biological experiment; interpretation; developed some sections of the manuscript.
Abbreviations
AA: antioxidant activity
ABTS: ethylbenzothiazoline-6-sulfonic acid/C18H18N4O6S4
AE: auxiliary electrode
(a: Tafel’s anodic slope
(c: Tafel’s cathodic slope
BHT: butylated hydroxytoluene
C2HCl3O2: trichloroacetic acid
C18H32O2: linoleic acid
C40H56: β-carotene
CH3OH: methanol
CI: corrosion inhibition/inhibitor
CIF: crystallographic information file
CR: corrosion rate
Ct: concentration
CV: cyclic voltammetry
DHA: dehydroacetic acid
DMSO: dimethyl sulfoxide
DPPH: 2,2-diphenyl-1-picrylhydrazyl/C18H12N5O6
Ecorr: corrosion potential
FeCl3: iron (III) chloride
Fe(OH)₂: iron hydroxide
FeOOH: iron(III) oxide-hydroxide
FRAP: ferric reducing antioxidant power
GCE: glassy carbon electrode
H2O2: hydrogen peroxide
Hg2Cl2: mercury(I) chloride
icorr: corrosion current density
IE(%): inhibition efficiency
IT: immersion time
K2S2O8: potassium persulfate
[K3Fe (CN6)]: potassium ferricyanide
KCl: potassium chloride
KOH: potassium hydroxide
L1: 4-hydroxy-3-[1-(3-hydroxy-naphthalene-2-ylimino)-ethyl]-6-methyl-pyran-2-one
MS: mild steel
NaCl: sodium chloride
OCP: open circuit potential
PBS: phosphate buffer solution
PDP: potentiodynamic polarization
QUER: quercetin
RE: reference electrode
Rp: polarization resistance
Rpm: rotation per minute
SCE: saturated calomel electrode
SD: standard deviation
SEM: scanning electron microscope
SiC: silicon carbide
T: temperature
WE: working electrode
XRD: X-ray diffraction

