Introduction
Being aware of our world’s environmental problems, today’s consumers are more interested in knowing the impact that products have on the environment. Sustainable products development related to this production is needed and very important to minimize environmental impacts and contribute to circular economy.
More than ever, the world is focused on consumption. Unprecedented levels of material output are being registered, and those create unprecedented levels of environmental challenges.
As the current society is much more aware of the environment there are an increasing number of environmental regulations which very often challenge the waste management and this makes the recycling as means of reducing waste to the landfill (Kassim et al 2012). Recycling is seen as an important way to mitigate the environmental impacts from the ever-increasing production and use of commodity materials. For some materials, such as many metals, recycling is already a vital part of the supply chain (Geyer et al 2016).
As people strive to understand what is sustainable from an environmental perspective, credible, comprehensive scientific tools are necessary to understand the system that needs changes. Life Cycle Assessment (LCA) is a powerful tool that allows us to study the system, measure impacts, and understand tradeoffs (Laurin et al 2017). Having this kind of information allow people in charge to make better decisions. With the application of LCA, is possible to optimize the production aspects, from the material’s extraction to the waste disposal (Heijungs et al 2010). The focus of this study was to apply LCA to the management of wastes resulted from a countertop production following the ISO 14040:2006 (ISO a) (Environmental management - Life cycle assessment-principles and framework) and ISO 14044:2006 (ISO b) (Environmental management - Life cycle assessment-requirements and guidelines) standards, which are the main standards for LCA. The goal is to assess the potential life cycle environmental impacts associated with the waste generated by the manufacturing of a countertop product intended to be used in bathrooms and kitchens, produced by a company from Portugal, comparing two different waste management scenarios, where the waste generated is landfilled and recycled. The countertop panel is made of a ceramic sheet on a panel substrate, formed by glassliner (glass fiber reinforced polyester) and Polyvinyl Chloride (PVC), which is intended to be water, scratch, and impact resistant. The product produces three main types of waste: PVC, glassliner and ceramic waste, and research shows that those types of waste can be recycled. Studies suggested that PVC can be successfully recycled into a variety of products such as bottles, various pipes, pipe fittings and other profiles with good appearance and properties. They also claimed that the profiles properties were unaffected when virgin PVC was replaced by PVC recyclates (Sadat-Shojai et al 2011). Another example is window frames, as shown by Stichnote et al (2013). When it comes to the glass reinforced polyester waste, Job (2013) states that it can be added to cement kilns, and Asokan et al (2009) stated that it can be used as replacement for fine aggregate in foamed concrete. As for the ceramic component, it can be reused in the construction sector, as part of concrete mixtures (Campos et al 2013).
1. Methods
The LCA methodology following the ISO 14040:2006 (ISO a) and ISO 14044:2006 (ISO b) standards was used to quantify the environmental impacts of wastes management.
1. 1 Functional unit and system description
The functional unit chosen for this study was the waste generated in the production of 1 m2 of finished panel (countertop). This panel has 24 mm thickness and 34.54 Kg weight.
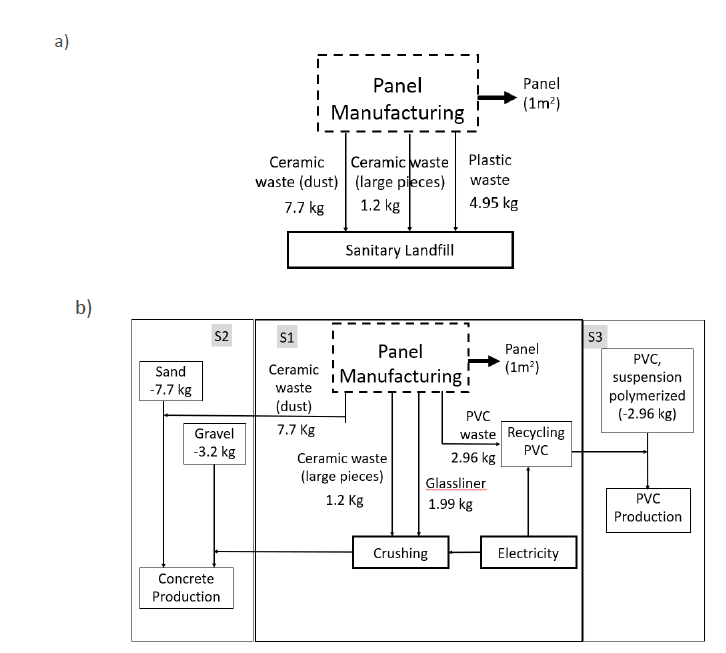
The system studied is presented in Figure 1. In Figure 1a, the first scenario is represented, and it can be observed that all the waste generated in the panel’s production is sent to landfill. In Figure 1b, the second scenario is represented, considering that all the wastes are recycled. PVC waste is recycled into PVC production avoid the same quantity of PVC suspension polymerized. glassliner and ceramic waste are recycled into concrete production avoid the same quantity of gravel and sand respectively.
1. 2 Inventory analysis
Data on waste production was provided by the panels manufacturer and relate to the year 2020. The data for the background processes were obtained on the Ecoinvent 3 databases. Transport of the waste to the recycling facilities and recycling methods for the PVC are considered in the equivalent process chosen and not specified.
Table 1 Waste data for both scenarios considered.
| Waste | Equivalent process in the Ecoinvent database | Unit | Quantity | |
|---|---|---|---|---|
| Landfill Scenario | Recycling Scenario | |||
| Glassliner waste | Waste plastic, mixture {GLO}| treatment of waste plastic, mixture, unsanitary landfill, dry infiltration class (100mm) | APOS, U | Mixed plastics (waste treatment) {GLO}| recycling of mixed plastics | APOS, U | [kg] | 1.99 |
| PVC waste | Waste polyvinylchloride {GLO}| treatment of waste polyvinylchloride, unsanitary landfill, dry infiltration class (100 mm) | APOS, U | PVC (waste treatment) {GLO}| recycling of PVC | APOS, U | [kg] | 2.96 |
| Ceramic waste - dust | Inert waste, for final disposal {RoW}| treatment of inert waste, inert material landfill | APOS, U | Sand {RoW}| market for sand | APOS, U (avoided) | [kg] | 7.7 |
| Ceramic waste - larger pieces | Inert waste, for final disposal {RoW}| treatment of inert waste, inert material landfill | APOS, U | Gravel, crushed {RoW}| market for gravel, crushed | APOS, U (avoided) | [kg] | 1.2 |
1. 3 Lifecy cleimp act assessment (LCIA)
The method chosen for impact assessment was EPD (2018) ready to use in SimaPro PhD software (PRé Consultants 2020). EPD is one of the many available methods for impact assessment, and considers the categories that must be evaluated in an Environmental Product Declaration. All impact categories are taken directly from CML-IA baseline method (eutrophication, global warming, photochemical oxidation, ozone layer depletion and abiotic depletion) and CML-IA non baseline method (acidification).
2. Results and discussion
Using the method EPD (2018) through SimaPro PhD software (PRé Consultants 2020), the results obtained for the waste management systems are discussed in this section. Firstly, the results for the Landfill Scenario are shown in Table 2 and Figure 3. Next, the results for the Recycling Scenario are shown in Table 3 and Figure 2. Finally, comparisons between the scenarios are made in Tables 4 and 5.
Table 2 LCIA results for the waste generated, regarding the landfill scenario, for the functional unit. Acronyms: AC (acidification-fate not incl.); EU (eutrophication; GW (global warming - GWP100a); PO (photochemical oxidation); AD (abiotic depletion); AD(FF) (abiotic depletion - fossil fuels); WS (water scarcity); OD (ozone layer depletion); NMVOC (non-methane volatile organic compounds).
| Category | Unit | Total | Glassliner waste | PVC waste | Ceramic waste |
| AC | [g SO2 eq] | 1.02 | 0.26 | 0.54 | 0.22 |
| EU | [g PO4 eq] | 34.19 | 17.14 | 17.01 | 0.04 |
| GW | [kg CO2 eq] | 0.34 | 0.15 | 0.16 | 0.03 |
| PO | [g NMVOC] | 0.53 | 0.12 | 0.15 | 0.27 |
| AD | [g Sb eq] | 2.65 x 10⁻⁴ | 8.06 x 10⁻⁶ | 1.20 x 10⁻⁵ | 2.44 x 10⁻⁴ |
| AD(FF) | [MJ] | 0.87 | 0.06 | 0.10 | 0.71 |
| WS | [m3 eq] | 3.31 x 10⁻² | 1.00 x 10⁻⁴ | 1.49 x 10⁻⁴ | 3.29 x 10⁻² |
| OD | [mg CFC-11 eq] | 1.04 x 10⁻² | 8.16 x 10⁻⁴ | 1.21 x 10⁻³ | 8.36 x 10⁻³ |

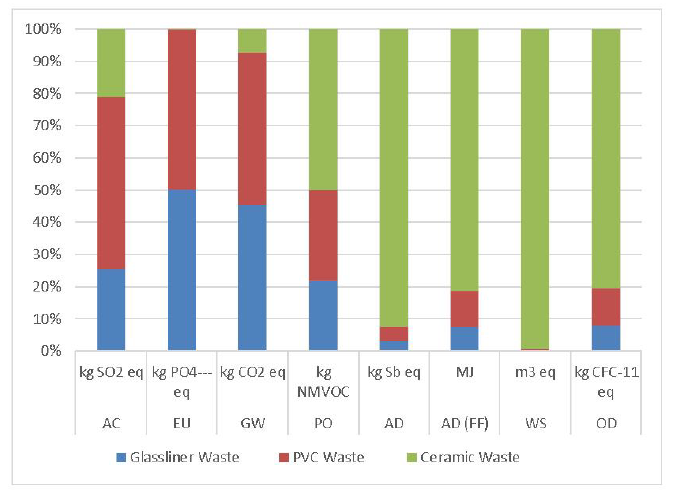
Figure 2 LCIA results for the waste generated, regarding the landfill scenario, for the functional unit. Acronyms: AC (acidification - fate not incl.); EU (eutrophication; GW (global warming - GWP100a); PO (photochemical oxidation); AD (abiotic depletion); AD(FF) (abiotic depletion - fossil fuels); WS (water scarcity); OD (ozone layer depletion).
Overall, considering the landfill scenario, the plastics wastes had a negative impact in all categories analyzed, ceramic waste did not show influence for the Eutrophication impact. For the first three categories (Acidification, Eutrophication and Global Warming), the wastes from the two plastic components are the main contributors. The impacts from the glassliner range from 25% on the Acidification to 50% on the Eutrophication. The impacts from the PVC range from 47% of the impact on the Global Warming to 53% of the total impact on the Acidification. However, for the other categories analyzed, the waste for the ceramic component is the main contributor, with this contribution ranging from 50% on the Photochemical Oxidation category to 99% on the Water Scarcity category.
Table 3 LCIA results for the waste generated, regarding the recycling scenario, for the functional unit. Acronyms: AC (acidification-fate not incl.); EU (eutrophication; GW (global warming - GWP100a); PO (photochemical oxidation); AD (abiotic depletion); AD(FF) (abiotic depletion - fossil fuels); WS (water scarcity); OD (ozone layer depletion ); NMVOC (non-methane volatile organic compounds).
| Category | Unit | Total | Glassliner waste | PVC waste | Ceramic waste |
| AC | [g SO2 eq] | -5.46 x 10⁻¹ | -5.20 x 10⁻³ | -5.18 x 10⁻¹ | -2.29 x 10⁻² |
| EU | [g PO4 eq] | -2.12 x 10⁻¹ | -1.78 x 10⁻³ | -2.04 x 10⁻¹ | -5.54 x 10⁻³ |
| GW | [kg CO2 eq] | -1.40 x 10⁻¹ | -7.97 x 10⁻⁴ | -1.36 x 10⁻¹ | -3.01 x 10⁻³ |
| PO | [g NMVOC] | -4.31 x 10⁻¹ | -4.63 x 10⁻³ | -4.01 x 10⁻¹ | -2.52 x 10⁻² |
| AD | [g Sb eq] | -4.74 x 10⁻³ | -6.25 x 10⁻⁵ | -4.56 x 10⁻³ | -1.20 x 10⁻⁴ |
| AD(FF) | [MJ] | -3.64 | -9.82 x 10⁻³ | -3.59 | -3.95 x 10⁻² |
| WS | [m3 eq] | -2.67 x 10⁻¹ | -9.09 x 10⁻⁴ | -2.55 x 10⁻¹ | -1.10 x 10⁻² |
| OD | [mg CFC-11 eq] | -1.01 x 10⁻¹ | -8.64 x 10⁻⁵ | -1.01 x 10⁻¹ | -3.87 x 10⁻⁴ |

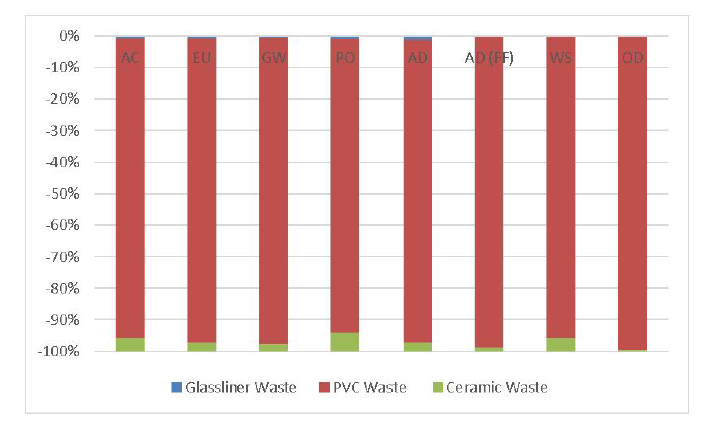
Figure 3 LCIA results for the waste generated, regarding the recycling scenario, for the functional unit. Acronyms: AC (acidification-fate not incl.); EU (eutrophication; GW (global warming - GWP100a); PO (photochemical oxidation); AD (abiotic depletion); AD(FF) (abiotic depletion - fossil fuels); WS (water scarcity); OD (ozone layer depletion).
When a recycling scenario is considered, all wastes registered a negative value, which means that the impacts caused are positive for the environment. The PVC component recycling had the most positive impacts. This is possibly due to the fact that for the recycling of the glassliner and ceramic components, it was necessary to consider a crushing stage, and that has high impacts. For the PVC, there was no need to consider this stage, since it is already considered in the chosen equivalent process. Adding to that, according to Stichnothe et al (2013), the environmental and health impacts of PVC have been under intense scrutiny over the years, largely due to the use of heavy metals and phthalates in the manufacturing process and emissions of dioxins from incineration of PVC waste. Recycling this material would avoid all these impacts associated with this polymer production.
For a better understanding of the effect of the wastes recycling effect comparing with landfilling, the respective proportion was calculated (Table 4).
Table 4 Comparison of LCIA results for two waste scenarios. Acronyms: AC (acidification-fate not incl.); EU (eutrophication); GW (global warming - GWP100a); PO (photochemical oxidation); AD (abiotic depletion); AD(FF) (abiotic depletion - fossil fuels); WS (water scarcity); OD (ozone layer depletion); ); NMVOC (non-methane volatile organic compounds).
| Category | Unit | Landfill Scenario | Recycling Scenario | Environmental Gain | % |
| AC | [kg SO2 eq] | 1.02 x 10⁻³ | -5.46 x 10⁻⁴ | 1.57 x 10⁻³ | 154 |
| EU | [kg PO4 eq] | 3.42 x 10⁻² | -2.12 x 10⁻⁴ | 3.44 x 10⁻² | 101 |
| GW | [kg CO2 eq] | 3.39 x 10⁻¹ | -1.40 x 10⁻¹ | 4.79 x 10⁻¹ | 141 |
| PO | [kg NMVOC] | 5.33 x 10⁻⁴ | -4.31 x 10⁻⁴ | 9.64 x 10⁻⁴ | 181 |
| AD | [kg Sb eq] | 2.65 x 10⁻⁷ | -4.74 x 10⁻⁶ | 5.01 x 10⁻⁶ | 1894 |
| AD (FF) | [MJ] | 8.68 x 10⁻¹ | -3.64 | 4.51 | 519 |
| WS | [m3] eq | 3.31 x 10⁻² | -2.67 x 10⁻¹ | 3.00 x 10⁻¹ | 905 |
| OD | [kg CFC-11eq] | 1.04 x 10⁻⁸ | -1.01 x 10⁻⁷ | 1.12 x 10⁻⁷ | 1076 |
When the two scenarios are compared, is noticeable recycling the waste reduces the impacts in every category. The difference ranges from 101% on the Eutrophication category to 1894% on the Abiotic Depletion category. These results concern only the impacts caused by the waste generated in the production.
In the table 5 are presented the results obtained in previous studies by the authors regarding the environmental profile for the panel production, considering the landfilling of the wastes (Silva et al, 2020), as well as the environmental gain achieved by recycling the waste.
Table 5 Comparison of between environmental profile results and the environmental gain. Acronyms: AC (acidification-fate not incl.); EU (eutrophication); GW (global warming - GWP100a); PO (photochemical oxidation); AD (abiotic depletion); AD(FF) (abiotic depletion - fossil fuels); WS (water scarcity); OD (ozone layer depletion).
| Category | Unit | Environmental Profile f 1m panel2 production (Silva et al2021) | Environmental Gain (from Table 4) | % |
| AC | [kg SO2 eq] | 0.30 | 1.57 x 10⁻³ | 0.52 |
| EU | [kg PO4 eq] | 0.13 | 3.44 x 10⁻² | 27.09 |
| GW | [kg CO2 eq] | 69.56 | 4.79 x 10⁻¹ | 0.69 |
| PO | [kg NMVOC] | 0.26 | 9.64 x 10⁻⁴ | 0.37 |
| AD | [kg Sb eq] | 1.7 x 10⁻³ | 5.01 x 10⁻⁶ | 0.29 |
| AD (FF) | [MJ] | 1206.60 | 4.51 | 0.37 |
| WS | [m3] eq | 13.84 | 3.00 x 10⁻¹ | 2.17 |
| OD | [kg CFC-11 eq] | 1.7 x 10⁻⁵ | 1.12 x 10⁻⁷ | 0.66 |
It is possible to observe that recycling of the waste generated in the panel’s production positive effect would not be very significative, with the exception of the Eutrophication category, where the difference was of 27.09%. For all the other categories, the difference ranges from 0.29% on the Abiotic Depletion category to 2.17% on the Water Scarcity category.
Observing these results, the Eutrophication category stands out. In an attempt to understand the reason for this considerable environmental gain, the results on this category for both scenarios were further analyzed. It was noticed that the levels of Phosphates, Chemical Oxygen Demands, Nitrogen Oxides and Nitrates emissions were considerably larger in the Landfill Scenario. According to Chislock (2013), the presence of Nitrogen and Phosphorus, along with Nitrates and Phosphates are known causes of Eutrophication, and according to Benson et al (2007) these elements are found as components of landfills leachate.
Conclusion
On this paper, a LCA study on a countertop material has been conducted and the results obtained for the waste generated in the panels manufacturing have been presented, considering two different waste scenarios. The results were compared, and it was observed that recycling the waste generated by the panel’s production decreases the environmental impacts in every category, with the variation ranging from 101% to 1894%. However, when the total impacts on the 1 m2 of panel production are observed, this reduction is not very significative, ranging from 0.29% to 27.09%.
Acknowledgements
This work was financially supported by the Portuguese Foundation for Science and Technology (FCT) through Polytechnic Institute of Viseu by the CERNAS (Research Centre for Natural Resources, Environment and Society) project UIDB/00681/2020 and by FCT within the scope of the project Refª UIDB/05583/2020. Furthermore, we would like to thank the Research Centre in Digital Services (CISeD) and the Polytechnic of Viseu for their support.


