


 Inglês (pdf)
 Artigo em XML
 Referências do artigo
 Enviar este artigo por email
 Citado por SciELO
  Similares em
SciELO
Similares em
SciELO 
 Permalink
In recent years, the study of loneliness in adulthood has been driven by the recognition of its high prevalence and its broad impacts on physical and mental health (Park et al., 2020), both for individuals and communities. The prevalence of loneliness has been increasing across age groups and in different countries (Cacioppo et al., 2015; Manoli et al., 2022; Surkalim et al., 2022), such as Portugal (under 30 years: 6.5%; 30-59 years: 9% and 60 years or older: 14.9%), the United Kingdom (under 30 years: 6.3%; 30-59 years: 5.5% and 60 years or older: 7.4%), Poland (under 30 years: 5.5%; 30-59 years: 11% and 60 years or older: 20.1%), and Russia (under 30 years: 11.3%; 30-59 years: 15.4% and 60 years or older: 24.4%;Rodrigues, 2018). McQuaid et al. (2021) report that loneliness levels seem to have increased even further during the COVID-19 pandemic.
Loneliness refers to a subjective feeling involving the evaluation of each person's social interactions and relationships, where a person experiences negative feelings related to a discrepancy between the person’s desired and actual levels of social connection (Cacioppo et al., 2015; Gale et al., 2018; Sipowicz et al., 2021). Isolation is more objective and is described as a lack of social connection (Nicholson et al., 2020), representing a psychological or physical distance between the individual and other people (Hsu, 2020).
In general, these two concepts are related, but loneliness refers to the perception of social disconnection, while isolation focuses on the physical absence of social interactions (De Jong Gierveld & Van Tilburg, 2010). A person can feel lonely even in the presence of others (Bandari et al., 2019).
Loneliness represents a risk factor for physical health, including increased vulnerability to cardiovascular diseases (Valtorta et al., 2016), namely stroke, coronary heart disease, and hypertension and, ultimately, an increased risk of mortality (Cacioppo & Cacioppo, 2018). Loneliness is also associated with mental health problems (for a review see Valtorta et al., 2018), including anxiety (Horigian et al., 2021) and depression (Hwang et al., 2020). Loneliness has been also associated with reduced physical activity (Diehl et al., 2018) which is a risk factor for poorer mental and physical health.
Some sociodemographic characteristics appear to increase the risk of loneliness. Regarding age, loneliness is often considered more prevalent among older persons (e.g., Hawkley et al., 2019). However, increasing evidence has suggested that young adults are also considered a high-risk group for loneliness (Matthews et al., 2019; Hawkley et al., 2022). Hawkley et al. (2022) report that both young (under 30 years old) and oldest adults (over 80 years old) perceived similar levels of loneliness, the highest levels across lifespan. In this study, the lowest levels of loneliness were around age 40 and around age 70. Both young and oldest adults seem to report more loneliness but the factors underlying higher levels of loneliness in these two age groups seem to differ as pointed out by Hawkley et al. (2022). For young adults, the experience of life transitions, difficulties in social relationships and romantic connections, the excessive use of social media, and their identity still in development seem to contribute to the higher levels of perceived loneliness. Concerning older adults, the loss of spouses, friends, and family, difficulties in retirement adaptation, increased health and mobility issues, and more social isolation seem to underly their higher levels of perceived loneliness. Regarding gender, results are not consistent, as some studies find that women have higher levels of loneliness (e.g., Cohen-Mansfield et al., 2016), while others find a higher proportion of loneliness in men (e.g., Lauder et al., 2006). Loneliness is positively associated with less contact with family, friends, or neighbors (Hutten et al., 2021). Single individuals tend to have higher levels of loneliness compared to married individuals (Hawkley & Capitanio, 2015). Living in rural areas has been pointed out as a risk factor for loneliness (Kelly et al., 2019). Low socioeconomic status and lower levels of education (Cohen-Mansfield et al., 2016) are also associated with higher levels of loneliness. Social support is a protective factor against the phenomenon of loneliness (Chen et al., 2019), and seems to contribute also to the reduction of anxiety and depression symptoms (Mackenzie et al., 2011).
For the development of effective strategies and interventions to prevent and/or reduce loneliness-related health problems, more studies are needed for a further understanding of the impact of loneliness on health and its associated risk factors.
Concerning loneliness assessment, the UCLA Loneliness Scale (UCLA-LS; Russell, 1996) is the most used scale. To address gaps in existing versions of the UCLA-LS, such as high correlation with other constructs (e.g., depression) and inconsistent factorial structure, a 3rd version of the UCLA-LS (UCLA-LS-3) was developed with two parts, one with positive items or non-loneliness items, and another with negative items or loneliness items. This new version demonstrated better validity evidence and good internal consistency across different populations (Russell, 1996).
The UCLA-LS-3 has been adapted and validated for English-speaking populations (Russell, 1996), Irish population (Shevlin et al., 2015), Franco-Canadian and French populations (DiTommaso et al., 2007), Italian population (Boffo et al., 2012), Persian-speaking population (Zarei et al., 2016), Spanish population (Sancho et al., 2020), Korean population (Lee et al., 2021), German population (Hudiyana et al., 2022), Indonesian population (Hudiyana et al., 2022), Turkish population (Durak & Senol-Durak, 2010), and Japanese population (Arimoto & Tadaka, 2019).
Some authors theoretically assert loneliness as a single dimension/factor (unidimensionality;e.g., Lin et al., 2022). However, among the validation studies conducted, an inconsistent factorial structure has been found for data collected with UCLA-LS-3 (see Table 1). Unidimensionality has been found (Arimoto & Tadaka, 2019) but some studies suggested a two-related factors structure: negative and positive (Dodeen, 2014). Others even support a three-related factors structure for the data collected with UCLA-LS-3: "Isolation", "Relational Connection", and "Collective Connection" (Shevlin et al., 2015).
Recently, an adaptation to the European Portuguese population was also performed (Zeas-Sigüenza et al., 2023), but the sample size in this study is small and the data were collected during the COVID-19 pandemic, a period in which higher levels of loneliness were experienced due to pandemic containment measures (Strizhitskaya et al., 2021). Measurement invariance is necessary to future examination of the use of UCLA-LS-3 in different contexts and for different participants. Specifically, considering the influence of some sociodemographic variables on the levels of perceived loneliness, it is necessary to establish UCLA-LS-3’s applicability to different age groups and genders.
To address the limitations of the study developed by Zeas-Sigüenza et al. (2023) with the Portuguese population, this study aims to conduct a more robust psychometric analysis of the UCLA-LS-3, specifically, we intend to: (1) characterize loneliness among Portuguese adults, (2) analyze the reliability and factorial structure of the scale for the Portuguese population (in a larger and heterogeneous sample of adults, including from young to older adults), and (3) assess the invariance of the factorial structure of UCLA-LS-3 across age groups and gender.
Table 1 Factor structures of the UCLA-LS-3, included items, and theoretical description of the factors
| Factor Structure | Factors | Number of items | Included items |
|---|---|---|---|
| Two-factor structure (Dodeen, 2014) | Negative | 10 items (2, 3, 7, 8, 11, 12, 13, 14, 17 e 18) | Items that describe negative feelings of loneliness. |
| Positive | 10 items (1, 4, 5, 6, 9, 10, 15, 16, 19 e 20) | Items that describe lack of experiences of non-loneliness or positive feelings. | |
| Unidimensional (Arimoto & Tadaka, 2019) | Loneliness | 20 items | Items that capture loneliness as a single dimension, without specific subdivisions. |
| Three-factor structure (Shevlin et al., 2015) | Isolation | 11 items (2, 3, 4, 7, 8, 11, 12, 13, 14, 17 e 18) | Items that reflect feelings of loneliness, rejection, and withdrawal. |
| Relational Connection Collective Connection | 5 Items (10,15, 16, 19 e 20) 4 Items (1, 5, 6 e 9) | Items related to the lack of deep emotional connections. Items related to the lack of belonging to a group or community. |
Method
Participants
This study involved 802 individuals, aged between 18 and 82 years, with a mean age of 35.12 years (SD = 15.67). Of the participants, 222 (27.7%) were male and 580 (72.3%) were female. Regarding education, most of the sample had a college degree (67.7%), were single (58%), 51% were employed and 39.4% were students. Regarding perceived socioeconomic status, most of the sample rated it as medium (79.2%). Most participants resided in the North and Central regions of Portugal (73.7%), and 40.3% of individuals lived in moderately urban areas (see Table 2).
Table 2 Demographic Characteristics of the Sample (N = 802)
| Variables | Participants | |||
|---|---|---|---|---|
| N | % | |||
| Gender | ||||
| Male Female | 222 580 | 27.7% 72.3% | ||
| Education level 0-4th grade 5-9th grade 10th-12th grade Undergraduate degree Bachelor's degree Master's degree Doctorate | 8 28 223 20 337 153 33 | 1.0% 3.5% 27.8% 2.5% 42.0% 19.1% 4.1% | ||
| Marital status* | 465 55 219 42 11 9 | 58.0% 6.9% 27.3% 5.2% 1.4% 1.1% | ||
| Single Cohabiting Married Divorced Widowed Other | ||||
| Geographical Area North Central Lisbon Metropolitan Area Alentejo Algarve Azores Autonomous Region Madeira Autonomous Region | 221 370 44 11 11 39 106 | 27.6% 46.1% 5.5% 1.4% 1.4% 4.9% 13.2% | ||
| Residence* Predominantly rural area Moderately urban area Predominantly urban area | 179 323 299 | 22.3% 40.3% 37.3% | ||
| Socioeconomic status* Low Medium Medium-High High | 15 363 142 9 | 1.9% 79.2% 17.7% 1.1% | ||
| Current employment status Employed Retired Student Working student | 409 44 316 33 | 51% 5.5% | 39.4% 4.1% | |
Note: * missing (n = 1)
Instruments
Loneliness Scale -version 3 (UCLA-LS-3)
UCLA-LS-3 (Russell, 1996) is a self-report measure that assesses the subjective perception of loneliness and the experience of social isolation, adapted for the European Portuguese population by Zeas-Sigüenza et al. (2023). All items are assessed on a Likert-type response scale ranging from 1 (never) to 4 (always). Total scores range between 20 and 80, with higher scores indicating higher levels of perceived loneliness and social isolation (Zeas-Sigüenza et al., 2023). Of the 20 items in the UCLA-LS-3, nine items (1, 5, 6, 9, 10, 15, 16, 19, and 20) need to be reversed before any analysis (value 1 becomes 4, value 2 becomes 3, value 3 becomes 2, and value 4 becomes 1), as they measure the absence of loneliness rather than its presence. Before performing any analysis, the responses of the participants on the nine previously mentioned items were reversed, so that all items contributed equally to the total scale score. Considering the cutoff points for loneliness severity proposed by Cacioppo and Patrick (2008), UCLA-LS-3 scores were recoded into three categories: 1 = (0-27) “none/low loneliness”; 2 = (28-43) “moderate loneliness”; and 3 = (44-80) “high loneliness”.
The European Portuguese version of the UCLA-LS-3 showed excellent internal consistency for the total score (α = .91; ω = .91; Zeas-Sigüenza et al., 2023).
Multidimensional Scale of Perceived Social Support (MSPSS)
The Multidimensional Scale of Perceived Social Support was developed by Zimet et al. (1988) and translated and validated for the Portuguese population by Carvalho et al. (2011). This scale consists of 12 items and uses a Likert-type response scale ranging from 1 (strongly disagree) to 7 (strongly agree), with a total score ranging from 12 to 84 points (Carvalho et al., 2011; Zimet et al., 1988). It consists of twelve items and aims to subjectively assess individuals' perceived social support across three domains: Friends (items 6, 7, 9, and 12; e.g., I can count on my friends when something goes wrong.); Family (items 3, 4, 8, and 11; e.g., I can talk about my problems with my family.); and Significant others (items 1, 2, 5, and 10; e.g., There is one special person with whom I can share my joys and sorrows). Although there is no absolute consensus, the total score cutoff points are generally interpreted as follows: 12 to 35 points (Low perceived social support), 36 to 60 points (Moderate perceived social support) and 61 to 84 points (High perceived social support). Regarding the MSPSS subscales, scores range from 4 to 28 points, where a higher score in each subscale indicates a greater perception of social support in the respective domain. In the present study, the MSPSS demonstrates excellent internal consistency for the total factor (α = .93; ω = .93) and for each of its three dimensions: family (α = .94; ω = .94), friends (α = .93; ω = .93), and significant others (α = .94; ω = .94). It was included to support construct validity of the UCLA-LS-3, since social support is expected to highly and negatively correlated with loneliness.
Sociodemographic questionnaire
The Sociodemographic Questionnaire included the following variables that have been associated with the levels of experienced loneliness: gender, education level, marital status, geographical area, residence, socioeconomic status, and current employment status.
Procedures
This study is part of the [anonymized for review] project approved by the Ethics Committee of [anonymized for review]. Inclusion criteria for the study included being 18 years of age or older and providing informed consent to participate. Social media was used to promote the study, and data was also collected through contacts with acquaintances, using the Google Forms platform, which allows for the creation, sharing, and collection of data through online forms. Participation was entirely voluntary, and there were no incentives for individuals who participated in this study. The data collection took place in early February and ended in May 2022, during a period already without any COVID-19-related measures in Portugal.
Data analysis
The data collected were analyzed using JASP (Version 0.18.1.0) [Computer software] (JASP team, 2022). Descriptive statistics (mean, standard deviation, frequencies, and percentages) were conducted to characterize the sample and analyze loneliness levels. Across respondents’ gender (two levels: men and women) and respondents’ age (three levels: 18-30, 31-59, 60 or more years old). Considering the cutoff points for loneliness severity proposed by Cacioppo and Patrick (2008), UCLA-LS-3 scores were recoded into three categories: 1 = (0-27) “none/low loneliness”; 2 = (28-43) “moderate loneliness”; and 3 = (44-80) “high loneliness”. Skewness (Sk) and kurtosis (Ku) values for all variables were analyzed to assess the assumptions of normality. Internal consistency analysis of each scale was performed by calculating Cronbach's alpha coefficient (α) for comparison with other studies, as well as McDonald's Omega (ω), considered the better option (Dunn et al., 2014). Values above .80 indicate good internal consistency and values above .90 and below .96 correspond to excellent internal consistency (Pallant, 2011).
To assess the relationship between scale variables, Pearson's correlation coefficient (r) was calculated. For non-linear relationships, the Spearman coefficient (ρ) was calculated. Kendall's coefficient (τ) was used to assess the relationship between scale variables and ordinal variables with less than 6 response levels or which did not follow a normal distribution. Dummy variables (dichotomous nominal variables) were created to assess the relationship of a scale variable with each category of nominal variables. Then, point-biserial correlation (rpb) was calculated to obtain the correlation value between the dichotomous nominal variable and the scale variable. All correlation coefficients were interpreted according to Cohen (1988), who indicates that between .10 and .29 the correlation is weak, between .30 and .49 the correlation is medium and between .50 and 1.0, the correlation is strong.
Subsequently, Confirmatory Factor Analysis (CFA) was conducted to test the factorial structure of the UCLA-LS-3, to determine which model provided the best fit. The four models found in the literature review were tested: a) Unifactorial Model: one factor; b) Two-Factor Model: "social others" and "intimate others"; c) Two-Factor Model: "Negative" and "Positive"; and d) Three-Factor Model: Isolation, Relational Connectivity, and Collective Connectivity. The CFA models were adjusted using the Robust Diagonally Weighted Least Squares (RDWLS) estimator, which takes into account polychoric correlation matrices of Likert-type scales (Li, 2016). To determine model fit, multiple fit indices were used: the chi-square test (χ2; ideally not significant); the Critical Chi-Square Ratio (χ2/df < 5, ideally < 3); the Comparative Fit Index (CFI) and Tucker-Lewis Index (TLI), both above .95; and the root mean square error of approximation (RMSEA < .09). The four competing models were compared using the chi-square difference test (Δχ2) and the Akaike Information Criterion (AIC), with preference given to the model with the lowest AIC value. Finally, we conducted multigroup CFA to determine whether the best-fitting model was invariant across age groups (three levels: 18-30, 31-59, 60 or more years old) and gender (two levels: men and women). Previous studies identified differences across age groups (e.g., Hawkley et al., 2022) and gender (e.g., Lauder et al., 2006), only by measuring invariance we can ascertain if UCLA-LS-3 assesses perceived loneliness in the same way in these different groups. Configural, metric, and scalar invariance were tested. The existence of invariance was established by comparing each model to the less-restrictive model based on the chi-square difference test (Δχ2) and the difference between models concerning the CFI and TLI (ΔCFI and ΔTLI ≤ .010), and RMSEA (ΔRMSEA ≤ .015;Chen, 2007).
Results
Characterization of Loneliness levels and its relationship with sociodemographic variables
In the studied adult population, the mean score for the overall UCLA-LS-3 was 43.86 (SD = 9.11; see Table 3). Considering the cutoff points for loneliness severity proposed by Cacioppo and Patrick (2008), UCLA-LS-3 scores were recoded into three categories: 1 = (0-27) "none/low loneliness"; 2 = (28-43) "moderate loneliness"; and 3 = (44-80) "high loneliness". Out of 802 participants, 51,1% (n = 410) of participants reported moderate loneliness, with scores between 28 and 43 on the scale. Another significant portion, 39,9% (n = 320) reported high loneliness, with scores ranging from 44 to 80 on the UCLA-LS-3. Finally, only 4% (n = 32) reported "none/low loneliness" (scores between 0 and 27).
Table 3 Descriptive statistics of the study variables
| Variables | N | M (SD) | Minimum-Maximum | Sk | Ku |
|---|---|---|---|---|---|
| UCLA-LS-3 | 802 | 41,23 (8.64) | 19-74 | .229 | .175 |
| MSPSS | 802 | 69.23 (13.34) | 12-84 | -1.41 | 2.19 |
Note: UCLA-LS-3 = University of California, Los Angeles Loneliness Scale (version 3); MSPSS= Multidimensional Scale of Perceived Social Support
Regarding the relationships between the UCLA-LS-3’s total score and sociodemographic characteristics, significant weak negative correlations were found with age (ρ = -.142, p < .001), being married (rpb = -.159, p < .001), education level (r = -.137, p < .001), socioeconomic status (τ = -.121, p < .001), and residence (τ = -.060, p < .05). These results suggest that being older, married, with higher education levels, higher levels of socioeconomic status and living in more rural areas is associated with lower levels of perceived loneliness. A weak positive correlation was found between UCLA-LS-3’s total score and being single (rpb = .152, p < .001), suggesting that being single is associated with higher levels of perceived loneliness.
Internal consistency
McDonald's omega indicated excellent internal consistency for the total score of the UCLA-LS-3 (α = .92 and ω = .93, see Table 4). The item correlation analysis was conducted after the score of each of the nine items was reversed, so that all items contributed equally to the total scale score. In turn, the item-total correlation analysis showed values equal to or greater than .5 (ranging from .5 to .74), except for items 8, 9, and 17 (< .5). The removal of any item did not improve the internal consistency of the UCLA-LS-3.
Table 4 UCLA-LS-3’s internal consistency
| Item Description | Corrected item-total correlations |
| How often do you feel "in tune" with the people around you?* | .503 |
| How often do you feel a lack of companionship? | .538 |
| How often do you feel that you have no one to turn to? How often do you feel lonely? | .666 .650 |
| How often do you feel part of a group of friends?* | .521 |
| How often do you feel that you have a lot in common with the people around you?* | .638 |
| How often do you feel that you are no longer close to someone? | .590 |
| How often do you feel that your interests and ideas are not shared by the people around you? | .481 |
| How often do you feel outgoing and friendly?* | .429 |
| How often do you feel close to others?* | .640 |
| How often do you feel excluded? | .675 |
| How often do you feel that your relationships with others people are (deep or genuine)? | .610 |
| How often do you feel that no one really knows you well? | .614 |
| How often do you feel isolated from others? | .743 |
| How often do you feel that if you wanted to, you could have companionship?* | .555 |
| How often do you feel that there are people who truly understand you?* | .610 |
| How often do you feel shy? How often do you feel that people are around you but not with you? | .412 .651 |
| How often do you feel that there are people you can talk to?* | .621 |
| How often do you feel that there are people you can rely on?* | .649 |
Note: *Reverse scoring items
Confirmatory factor analysis (CFA): UCLA-LS-3’ factorial structure
A Confirmatory Factor Analysis (CFA) was conducted to analyze the factorial structure of the UCLA-LS-3, comparing three models (M1 = Unifactorial Model - Loneliness; M2 = Positive or Non-Loneliness and Negative or Loneliness; M3 = Isolation, Relational Connectivity, and Collective Connectivity). The fit indices for each model are presented in Table 5. Based on the chi-square difference test, Model M3 (see Figure 1) showed a significantly better fit, with the smallest difference found between M3 and M2, still with an advantage for M3.
Table 5 Fit índices of the models tested in the confirmatory factor analysis
| Model | χ² | p | χ²/df | CFI | TLI | RMSEA (90% CI) | AIC |
|---|---|---|---|---|---|---|---|
| M1 (Unifactorial - Loneliness) | 640.578 | <.001 | 3.76 | .97 | .97 | .059 (.054; .064) | 28569.209 |
| M2 (Negative or Loneliness and Positive or Non-Loneliness) | 313.076 | <.001 | 1.85 | .99 | .99 | .033 (.027; .038) | 27905.808 |
| M3 (Isolation, Relational Connectivity, and Collective Connectivity) | 303.616 | <.001 | 1.81 | .99 | .99 | .032 (.026; .038) | 27852.196 |
Note. χ² (Chi-square test), χ²/df (Chi-square per degrees of freedom), CFI (Comparative Fit Index), TLI (Tucker-Lewis Index), RMSEA (Root Mean Square Error of Approximation) and AIC (Akaike Information Criterion)
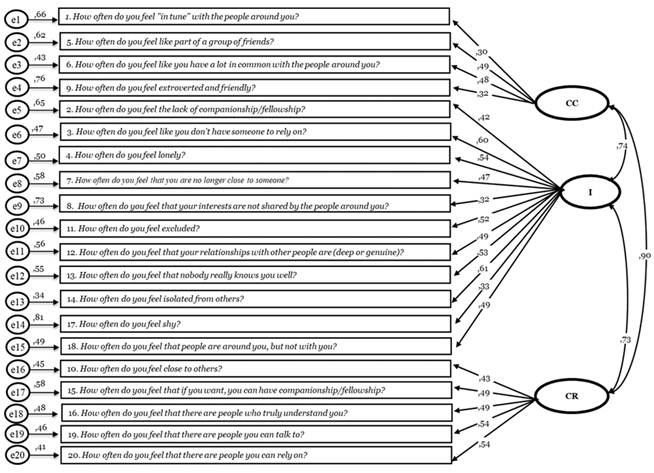
Figure 1 Factorial structure of the UCLA-LS-3 with three related factors: collective connectivity (CC); isolation (I); and relational connectivity (CR)
Internal consistency measures were calculated for each of the dimensions derived from the three-factor model of the UCLA-LS-3 (see Table 6): Collective Connectivity - Factor 1 (α = .69; ω = .72), Isolation - Factor 2 (α = .89; ω = .90), and Relational Connectivity - Factor 3 (α = .84; ω = .85).
Table 6 Descriptive statistics and internal consistency of the three-factor model of the UCLA-LS-3
| Three-factor Model UCLA-LS-3 | Number of items | Minimum - Maximum of each dimension | M (SD) | M(SD) responses to items in each UCLA-LS-3 dimension |
|---|---|---|---|---|
| Collective Connectivity (1, 5, 6, 9) | 4 | 4 - 16 | 7.759 (1.912) | 1.94 (.48) |
| Isolation (2, 3, 4, 7, 8, 11, 12, 13, 14, 17, 18) | 11 | 11 - 44 | 26.97 (5.674) | 2.45 (.52) |
| Relational Connectivity (10, 15, 16, 19, 20) | 5 | 5 - 20 | 9.138 (2.72) | 1.83 (.54) |
UCLA-LS-3 total score relationship with its three subscales and with social support
The UCLA-LS-3 ’s total score was positively and strongly correlated with each of its dimensions: Collective Sense (r = .788, p < .001), Isolation (r = .937, p < .001), and Relational Connectivity (r = .841, p < .001). UCLA-LS-3’ total score and MSPSS’ total score showed a negative and strong correlation (r = -.607, p < .001).
Model Invariance
We conducted multiple group confirmatory factor analyses to examine whether the best fitting model for UCLA-LS-3 factorial structure, the three related-factors model, was invariant across respondents’ gender (two levels: men and women) and respondents’ age (three levels: 18-30, 31-59, 60 or more years old). Goodness-of-fit indexes supported configural invariance of the best fit model across gender (see Table 7).
Table 7 Measurement invariance of UCLA-LS-3 across gender: men (n = 222) and women (n = 580)
| Model comparison | ((2 ((df) | (CFI | (TLI | (RMSEA |
| Metric-Configural | 27.37 (17) | -.001 | -.001 | .003 |
| Scalar-Metric | 42.97 (20) | -.002 | -.002 | .004 |
Note. ((2 ((df) - Change in chi-square (Change in degrees of freedom), (CFI - Change in comparative fit index, (TLI - Change in tucker-lewis index and (RMSEA - Change in RMSEA (root mean square error of approximation)
Then, metric invariance or weak invariance was also tested and showed a good fit to the data. When comparing the configural and metric models, the chi-square difference test (((2) was non-significant, thus supporting metric invariance. Metric invariance was also supported by a minimal change on fit indices (ΔCFI = - .001; ΔTLI = - .001; ΔRMSEA = .003) in comparison with the configural invariance model. Lastly, scalar invariance or strong invariance was not supported by the chi-square difference test, despite model fit being good and the change on fit indices being minimal relative to the metric invariance model (ΔCFI = -.002; ΔTLI = - .002; ΔRMSEA = .004). Table 8 summarizes the results of this analysis.
Concerning respondent’s age, the best fitted model was compared across three recoded age groups (18-30; 31-51; 60 or more years old) and results supported only configural invariance.
Table 8 Measurement invariance of UCLA-LS-3 across age groups: 18-30 (n = 436); 31-51 (n = 298); and 60+ (n = 68)
| Model comparison | ((2 ((df) | (CFI | (TLI | (RMSEA |
| Metric-Configural | 157.3 (34) | -.006 | -.006 | .027 |
| Scalar-Metric | 174.5 (40) | -.007 | -.007 | .012 |
Note. ((2 ((df) - Change in chi-square (Change in degrees of freedom), (CFI - Change in comparative fit index, (TLI - Change in tucker-lewis index and (RMSEA - Change in RMSEA (root mean square error of approximation)
Discussion
The study analyzed the psychometric characteristics of the UCLA-LS-3 in a sample of the Portuguese general population, encompassing adults from different age groups (from 18 to 82 years). Compared to a previous study, including the adaptation and initial validation of the UCLA-LS-3 in Portugal (Zeas-Sigüenza et al., 2023), this study included a larger number of participants with diverse sociodemographic characteristics. It is also worth noting that the data were not collected during the COVID-19 outbreak, as in the study by Zeas-Sigüenza et al. (2023). Participants responded in a context without COVID-19 restrictive measures, regarding social distancing to control the pandemic, with an impact on reducing and even preventing physical contacts.
Regarding the total score of the UCLA-LS-3, weak and significant negative correlations were found with other sociodemographic variables, with lower perceived loneliness in married persons, with higher socioeconomic status and more years of formal education. Persons who are single in our study showed higher levels of perceived loneliness. These results support the findings of Hawkley and Capitanio (2015), suggesting that single individuals experience higher levels of loneliness than married individuals, and by Hyland et al. (2018), who found a higher risk of loneliness among divorced individuals.
In terms of reliability, this study's results demonstrated excellent internal consistency, consistent with previous studies (Hudiyana et al., 2022; Zeas-Sigüenza et al., 2023). Regarding the factorial structure of the scale, a three-factor related model (Isolation, Relational Connectivity, and Collective Connectivity) showed the best fit. This finding is consistent with previous validation studies of the UCLA-LS-3 in adolescent and adult samples (Hawkley et al., 2005; Shevlin et al., 2015). Isolation (the first factor) corresponds to the overall feeling of being isolated, representing individual social dissatisfaction (Hawkley et al., 2005). The second factor, Relational Connectivity, encompasses feelings of familiarity, proximity, and support, corresponding to a relational social self (Hawkley et al., 2005). These aspects of social support are vital for social connection with others and can mitigate the negative consequences associated with loneliness (Shevlin et al., 2015). Lastly, Collective Connectivity refers to group cohesion (collective social self;Hawkley et al., 2005).
In our sample, adults perceived a moderate to high level of loneliness. Considering the average response value per item in each dimension, in an exploratory manner, we observed a profile in which the participants reported more loneliness in the Isolation dimension than in the other dimensions. In other words, it is the Isolation dimension that contributes the most to the overall psychological experience of loneliness in our sample. Indeed, in this study, the value of Isolation is higher than that reported by Hawkley et al. (2005) in a study with a US population, while the Relational Connectivity and Collective Connectivity dimensions showed lower values in our sample. It is worth noting that this three-related factors model showed only configural and metric invariance across gender. In this regard, the model might not be fully invariant across genders and greater caution should be used when comparing mean scores between men and women. The uneven distribution of men and women in our sample could partially explain these findings since violations of invariance might not be detected. The group of women, with a larger sample, have more weight in determining the final solution, because the chi-square statistics include a weighting by sample size (Yoon & Lai, 2017). Only configural invariance was found when considering different age groups suggesting that the model is also only partially invariant across age groups. This seems to suggest that the European version of the UCLA-LS-3 does not assess the same loneliness dimensions across age groups. Nevertheless, model invariance across genders and age groups needs to be further investigated in future studies using groups with larger and balanced sample sizes.
Supporting the construct validity of the UCLA-LS-3, the total scores of the scale and MSPSS showed a strong negative correlation, indicating that as social support increases, loneliness levels decrease, and vice versa. Teater et al. (2020) found that individuals with a stable social network have more opportunities to avoid feeling lonely compared to those with a weak social network.
This research provides information on a topic that has received increased attention in Portugal and worldwide due to its potential implications for mental health. Our findings allow for a more robust and secure use of the European Portuguese version of UCLA-LS-3 compared to the data collected during the COVID-19 pandemic in the initial validation study. It facilitates integration and comparison of results with future studies, aiming for a better understanding of this topic.
Regarding the study limitations, a more representative sample concerning gender, age and other sociodemographic characteristics would be beneficial, as well as the possibility of better assessing the validity of the data collected with UCLA-LS-3 by comparing it to data collected with other already validated measures (e.g., other measures related to loneliness). Also, the development of normative data, for different age groups (i.e., adolescents, young, middle-aged and older adults) and gender could contribute to better identification of persons at risk due to high levels of loneliness. Finally, clinical validation studies are necessary, for example, by studying people with depression diagnosis and other relevant mental and physical health diseases in which loneliness should be addressed as a key psychological experience to better understand and intervene with those clinical populations.
Overall, the European Portuguese version of the UCLA-LS-3 has good psychometric properties for both research and clinical purposes and can be used for: a) assisting as a health indicator for health promotion programs and clinical interventions to alleviate loneliness; b) contributing to research development in the field; c) finding specificities of the psychological experience of loneliness considering its three related dimensions; d) by identifying the levels of loneliness it can contribute to better efficiency in the prevention and resolution of loneliness and related health problems.
Loneliness is a central construct in psychological functioning with health and social well-being implications. The UCLA-LS-3 can be confidently used in the Portuguese adult population and may serve as a relevant tool to other target groups (e.g., adolescents; clinical populations). Additionally, it allows for a more in-depth analysis of the results, including access to more complex data by incorporating the dimension scores contemplated in the UCLA-LS-3, beyond the total scale score. In the future, more explanatory or comprehensive studies on the psychological experience of loneliness will be key to understanding how loneliness is triggered and its relationship with other psychological constructs.
Loneliness has been referred to as a central construct in psychological functioning, with implications for health and social well-being. Future studies should investigate this issue by applying the UCLA-LS-3 to different populations. This study found excellent reliability and adequate evidence of construct validity for data collected with the European Portuguese version of the UCLA-LS-3.
Credit authorship contribution statement
Edna Moniz: Conceptualization, Methodology, Investigation, Writing - Original Draft. Luís Pires: Methodology, Formal Analysis, Writing - Original Draft, Review & Editing. Célia Barreto Carvalho: Conceptualization, Validation, Writing - Review & Editing. Rosa Marina Afonso: Conceptualization, Validation, Writing - Review & Editing.
Final considerations
Loneliness has been referred to as a central construct in psychological functioning, with implications for health and social well-being. Future studies should investigate this issue by applying the UCLA-LS-3 to different populations. This study found excellent reliability and adequate evidence of construct validity for data collected with the European Portuguese version of the UCLA-LS-3.

