INTRODUCTION
In sports, as in many other life situations, achieving success relies on many different factors. Football is a team sport where several different approaches, under different paradigms, have been used to analyse teams’ performance (Brito Souza, López-Del Campo, Blanco-Pita, Resta, & Del Coso, 2019; Del Coso, Brito de Souza, López-Del Campo, Blanco-Pita, & Resta, 2020; Gómez, Lago, Gómez, & Furley, 2019; Sarmento et al., 2018). Some of those factors have been categorised as key performance indicators, such as the number of shots, shot efficiency, and ball possession, among others (Lago-Peñas, Lago-Ballesteros, & Rey, 2011; Tenga, Holme, Ronglan, & Bahr, 2010). Nevertheless, and despite all the efforts to identify its promising and effective proxies, football success, eventually, will depend upon the ultimate measures of offensive end defensive effectiveness, which are scored and conceded goals (González-García & Martínez Martínez, 2019) and their distribution in each match, since points come from victories and ties which are determined by the (un)balance of these two (scored and conceded goals) in each match.
Bekris et al. (2013), analysing the Greek Superleague in the 2011-2012 season, found that the Champion team had better offence and defence performance indicators than its opponents, which included scored goals and number of shots against, among others. Reinforcing the importance of scored and conceded goals, Brito Souza et al. (2019) excluded these numbers from the multiple regression analysis they conducted to assess the influence that each match statistic had on the points obtained at the end of the Spanish league on eight seasons because the number of ranking points is primarily based on the number of goals obtained/received by the teams in each game. Vales, Casal López, Gómez, Pita and Olivares-Vázquez (2018) chose a different perspective to analyse the same six leagues that we will be studying in this paper. In their study, investigators aimed to compare the competitive profile of the best-ranked championships. The authors found different competitive profiles of the best-ranked championships, mainly in the indices related to the international prestige and the competitive quality of the teams, with Spain receiving prominence.
Del Coso et al. (2020) reported that the performance indicator that best explained the differences between the first and second-placed teams in the Spanish National Football Championship (LaLiga) for eight seasons (from 2010–2011 to 2017–2018) was a higher number of wins while playing away, instead of drawing or losing while away. Thus, the authors added that an offensive style of play might be crucial in winning the championship.
Lopez-Valenciano et al. (2022) reinforced this idea after studying the 2017/18 and 2018/19 Spanish league (LaLiga), stating that a compensated playing style combining high shooting efficacy with a high capacity to contain rival’s match play is needed for success in LaLiga. Nevertheless, an offensive game style that prioritises attack building and shooting on goal seems more important than establishing effective defensive strategies. In accordance with this, Schreiner and Elgert (2013) state that the most important football match event is scoring a goal. Oppositely, Çobanoğlu and Terekli (2018) stress the importance of good defence, as preventing the opposite team from scoring enhances their chance to win. Fofack (2020), analysing data related to the 513 clubs that took part in the Champions League between the 1955-1956 and 2018-2019 seasons, found that goals scored were positively and significantly associated with Champions League titles, whilst conceded goals were found to be (negatively) significantly associated with Champions League titles. In addition, it was found that scored and conceded goals had the same contribution to Champions League titles.
Filho, Basevitch, Yanyun and Tenenbaum (2013), although not focusing on champions’ performance, compared Brazilian with Italian teams (nationally and in respective leagues), trying to test the mythical belief that Brazilian football teams possess an offensive style of play while Italian teams rely on a more defensive one. Among other conclusions, they found that Brazilian teams scored more goals per game than Italian teams at national and league levels. Both the goals scored and conceded were determinants for getting points per game in the Brazilian and Italian national leagues.
Thus, the present study aims to identify and compare the top six European football leagues (Portugal, Spain, France, Italy, England and Germany), considered this way by UEFA (https://pt.uefa.com/nationalassociations/uefarankings/country/#/yr/2020) on the last of the analysed seasons (2019-2020), on scored and conceded goals internal rankings over the first twenty seasons of the 21st century. Analyses will be conducted to identify differences between attack (scored goals) and defence (conceded goals) positioning/ranking of its champions during the referred seasons. Besides this effort to see if attack or defence supremacy becomes evident in any of these six leagues, separate comparisons (attack and defence) between leagues will be run, searching for differences in attack or defence between any of the present leagues. To the best of our knowledge, this is the first study that tries to identify eventual differences in attack and defence ultimate indicators (scored and conceded goals’ internal ranking positioning) within the champions in each of the considered football leagues over such period (twenty seasons in the 21st century). Collected data may help to corroborate or deny any popular assumptions about what it takes to be a champion in these different leagues.
METHODS
Choice of data set
Data from twenty football seasons (retrieved from https://www.zerozero.pt/edition_stats) of the main championships of the considered top six European male football leagues (https://pt.uefa.com/nationalassociations/uefarankings/country/#/yr/2020) were used. In each season and league, the number of scored and conceded goals of all the teams involved in that season’s championship was registered, which allowed for a positioning/ranking of its respective champions on those indicators.
Positioning/ranking method
As an example, if a team that won the Portuguese championship in the season 2007-08 was the top scorer of that year but if two teams had conceded fewer goals, then the Portuguese champion of 2007-08 would receive a “1” for attack performance (scored goals) and a “3” for defence performance (conceded goals).
Statistical analysis
First, the Shapiro–Wilk test (n< 30) was used to analyse data distribution. Therefore, means and standard deviation were considered for all studied variables. In addition, several parametric tests were used to check the possible differences across variables under analysis. Specifically, related sample t-test was performed to analyse differences between attack and defence performances (scored goals vs conceded goals’ ranking) in each of the six analysed leagues, as well as a one-way ANOVA was performed to analyse differences in the same two parameters (separately) among the six countries. The ANOVA was complemented with the Tukey post-hoc because all variances are homogeneous (Levene’s Test> 0.05). For these tests, a p-value less than or equal to 0.05 was considered to reject the null hypothesis, as Ho (2014) suggested. In case of significant results, an effect size via Cohen d (related sample t-test) and partial eta square (one-way ANOVA) will be considered. Based on Cohen’s (1988) recommendations, the following effect sizes cut-off values were considered: trivial (0–0.19), small (0.20–0.49), medium (0.50–0.79) and large (0.80 and greater).
RESULTS
Preliminary analysis
An inspection of the data revealed no missing values. In addition, the normality test through the Shapiro–Wilk test demonstrated that all variables meet normal distribution (p> 0.05), ensuring the condition of conducting parametric tests.
Table 1 depicts champions’ combo (i.e., attack and defence) performances. Combo positioning was calculated as a starting point, the sum resulting from attack (i.e., number of scored goals) and defence (i.e., number of goals conceded) positioning within the respective leagues from 2002-2001 till 2019-2020. As an example, if a team in the 2003-2004 season were on the top of the most scorer teams and in 4th place on defence performance (i.e., three teams conceded fewer goals than that team), the combo result would be 4 (i.e., one point from attack positioning and 3 points from defence positioning). This was done for all the teams competing with the champion in that season, and the final combo result would come from the comparison of these sums. Thus, the team that would have a lower result on this attack and defence sum would be granted one (1) point (first place), the second with two (2) points, etc. France and Italy reveal standard deviations clearly higher than the other countries leagues. Speaking of the coefficient of variation, France and Italy were the only ones that overpassed 50% (71 and 59%, respectively, with the others presenting 44% - England – or less, with Portugal revealing a 0%, since its champions were always the first on this combo list). No significant differences were found between any of the six countries analysed. Therefore, all the champions have a mean combo result between 1 and 1.40, meaning quite close to the top maximum. These results reinforce the pertinence of having conducted the subsequent presented analysis.
Table 1 Champions mean ordinal positioning resulting from a combo of attack (scored goals) and defence (consented goals) over 20 seasons.
| Leagues | Combo (Mean± sd) | Square sum | df | Mean square | z | p-value | |
|---|---|---|---|---|---|---|---|
| Portugal | 1.00± 0.00 | Between groups | 2.642 | 5 | 0.528 | 1.396 | 0.231 |
| Spain | 1.10± 0.447 | ||||||
| France | 1.40± 0.995 | ||||||
| Italy | 1.40± 0.821 | Within groups | 43.152 | 114 | 0.379 | ||
| England | 1.20± 0.523 | ||||||
| Germany | 1.15± 0.366 | Total | 45.792 | 119 |
1: best combo positioning, 2: second, etc.
In Figures 1 to 6, attack (scored goals) and defence (conceded goals) performances on the analysed six leagues are presented. Visually, and once again, following preliminary inferences from Table 1 analysis, France and Italy are the countries where there seems to exist a bigger discrepancy between the attack and defence performance of its champions. In France, we can see that, in the 20 seasons, in only 8 of them (40%), the champions presented the best defence (conceded goals) performance. This defensive performance has oscillated between 10 (50%) and 16 (80%) throughout the other five countries’ leagues. On the contrary, in Italy, champions’ attack performance (scored goals) held the top performance in only 9 (45%) of the 20 seasons, whilst in the other five countries, champions were top scorers on 11 (55%) to 16 (80%) of those same 20 seasons.

Figure 1 Portugal’s Champions mean ordinal positioning on attack (scored goals) and defence (consented goals) over 20 seasons.
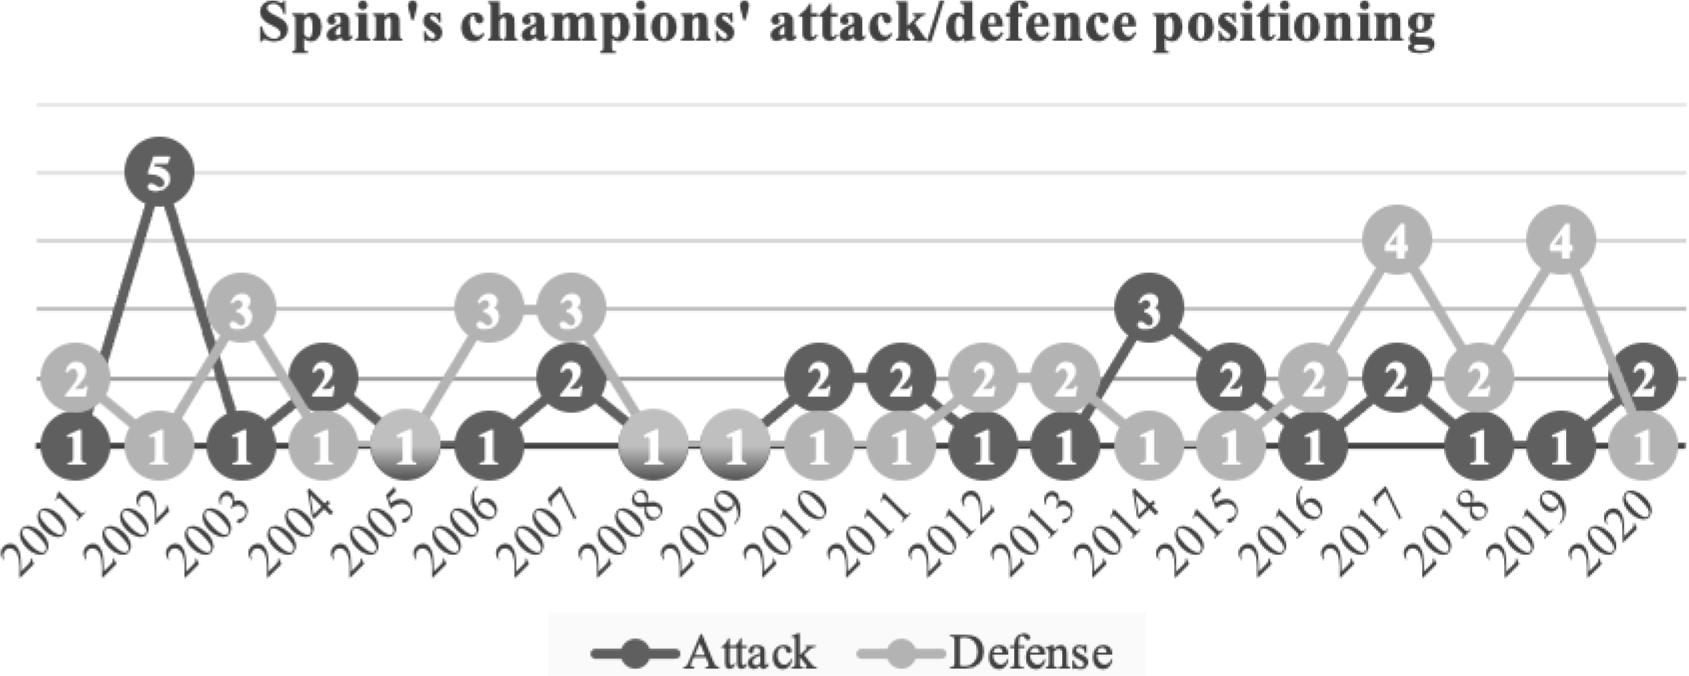
Figure 2 Spain’s Champions mean ordinal positioning on attack (scored goals) and defence (consented goals) over 20 seasons.
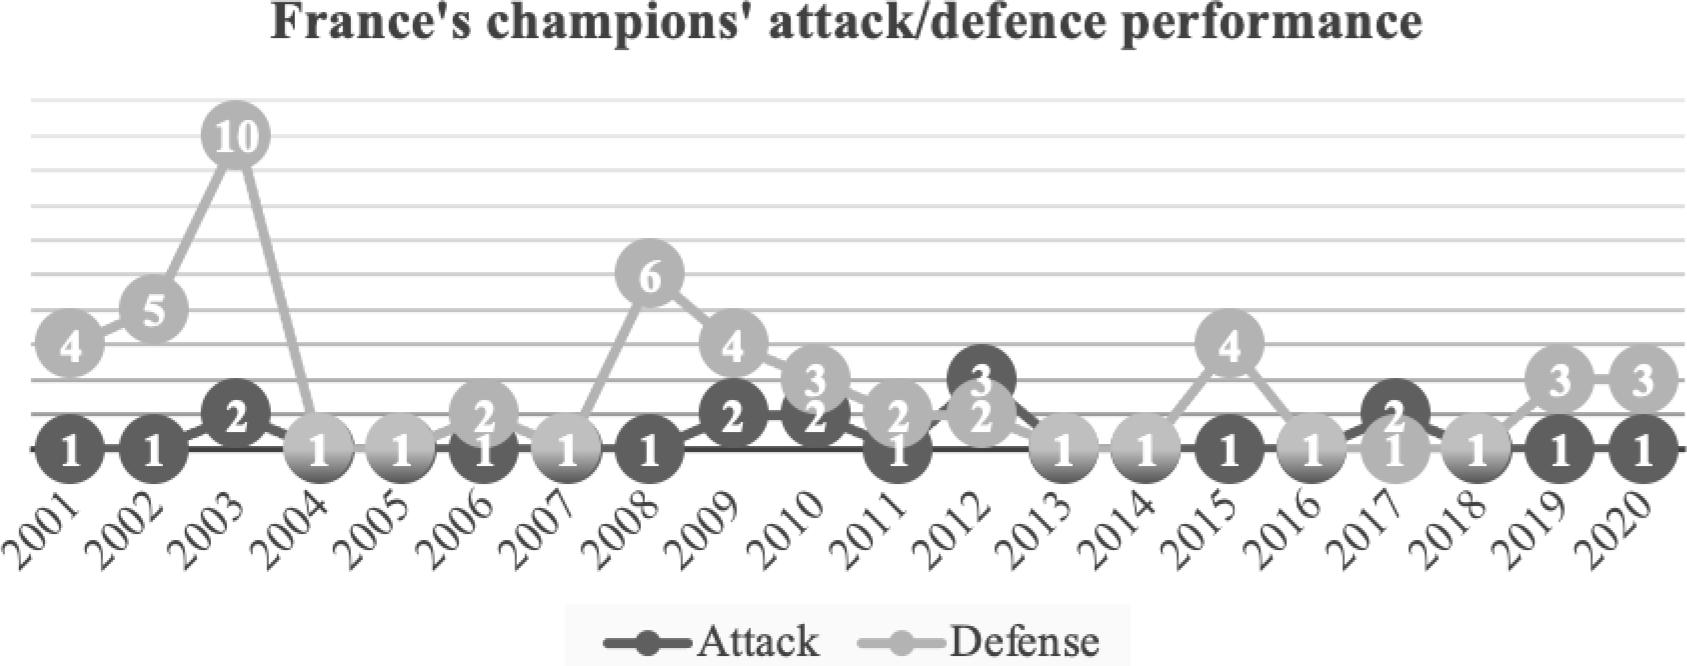
Figure 3 France’s Champions mean ordinal positioning on attack (scored goals) and defence (consented goals) over 20 seasons.
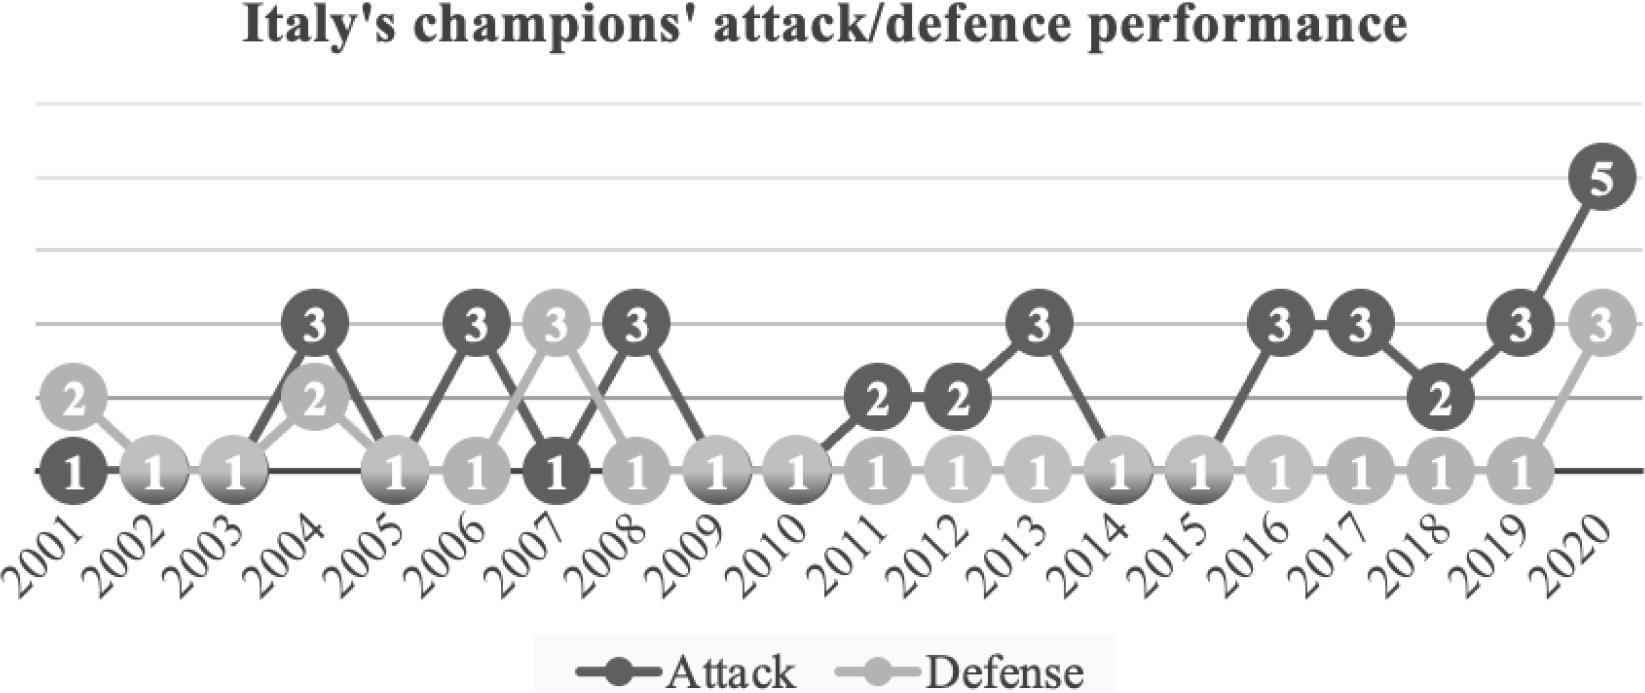
Figure 4 Italy’s Champions mean ordinal positioning on attack (scored goals) and defence (consented goals) over 20 seasons.
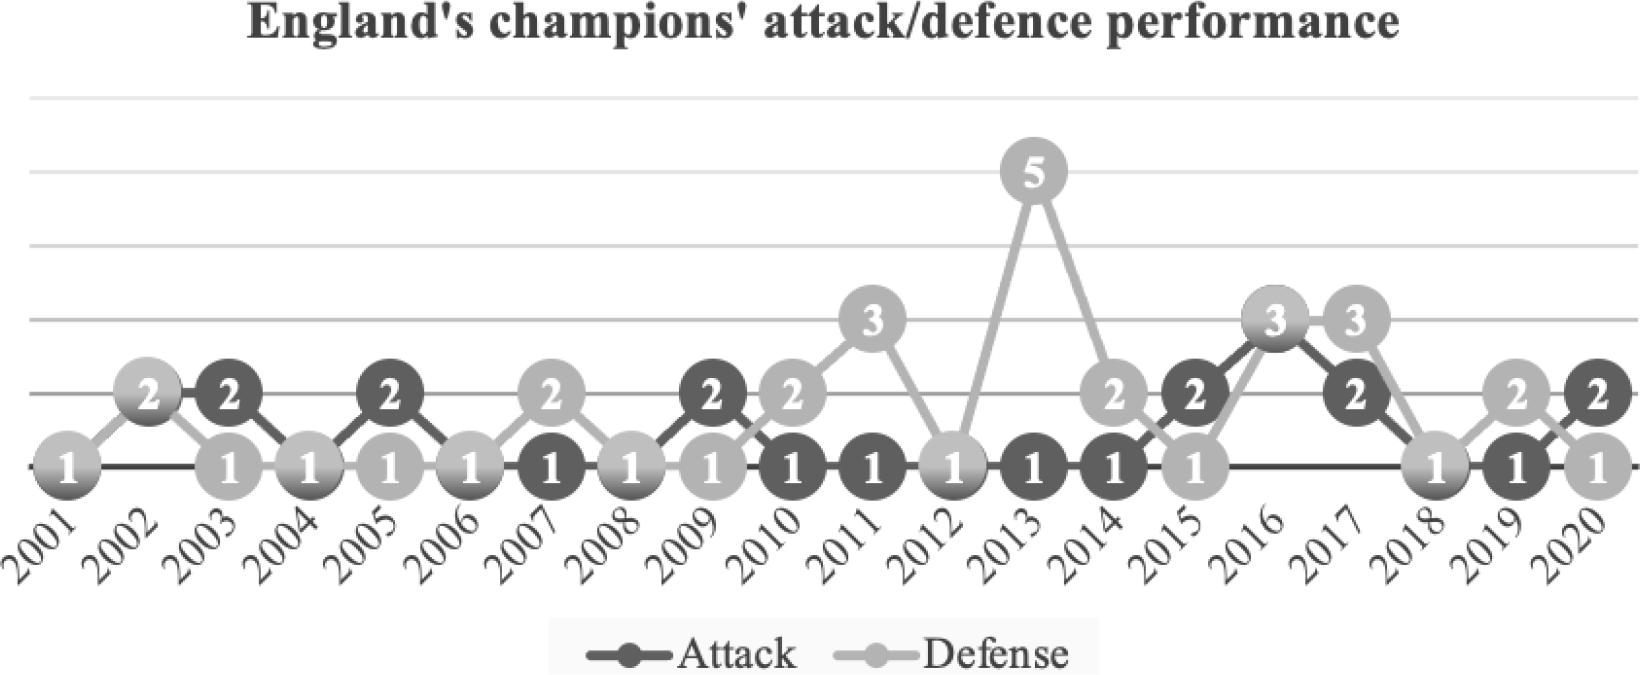
Figure 5 England’s Champions mean ordinal positioning on attack (scored goals) and defence (consented goals) over 20 seasons.
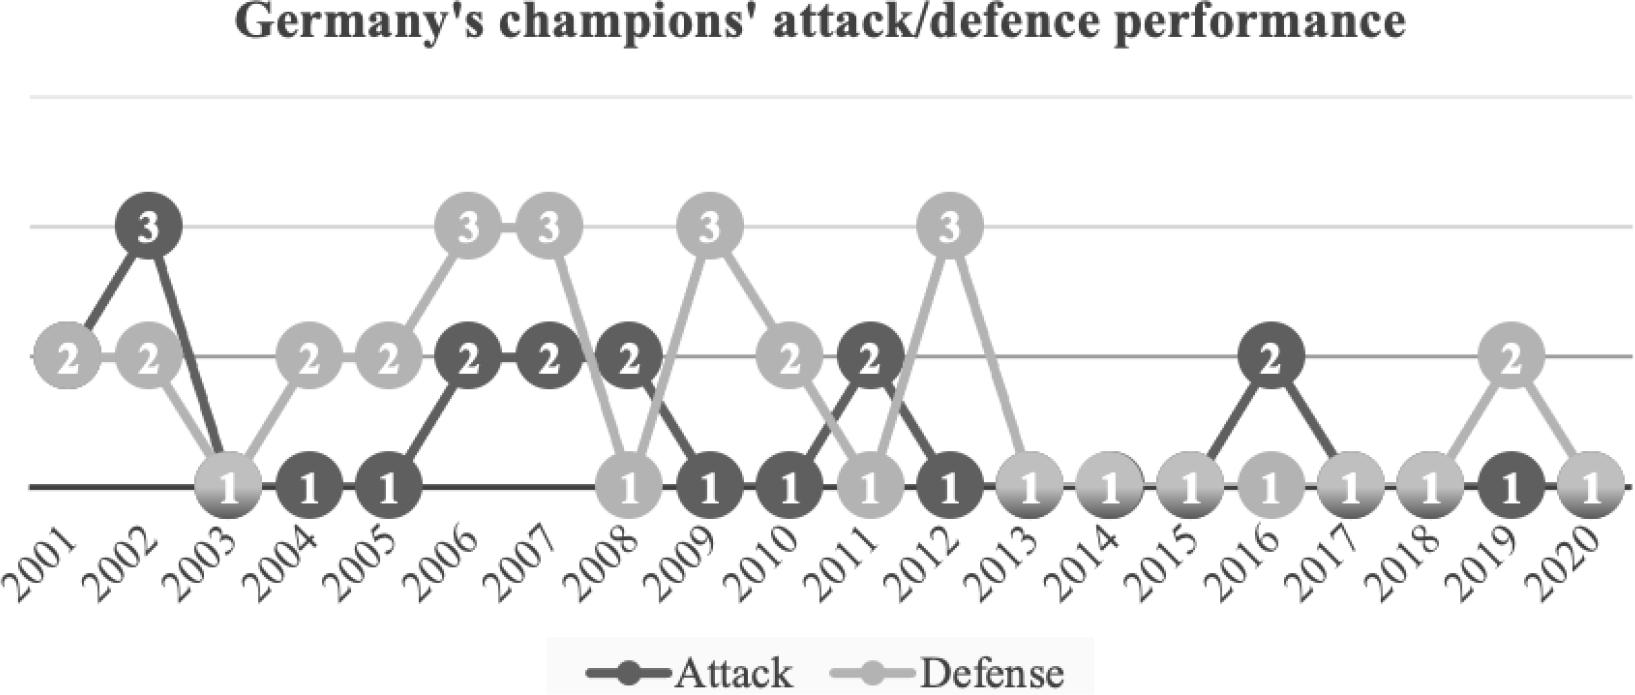
Figure 6 Germany’s Champions mean ordinal positioning on attack (scored goals) and defence (consented goals) over 20 seasons.
Beyond a visual impression, further analyses must be conducted to allow for conclusions. In Table 2, the Champions’ attack and defence performances are depicted. Focusing on attack performances, Italy is the only country in which the main league’s champions between the 2001 and 2020 seasons reached a mean value higher than two. On the other hand, France is the only country where the mean defence performance of the main league’s champions in the same seasons reached a value higher than two and quite close to three. Globally, this can be read as if in Italy, the champions are not the top scorers, and in France, the champions are not the least defeated defence. Unsurprisingly, these are the only of the six analysed countries with significant differences (p< 0.01) between attack and defence positioning performances (favouring champions’ attack in France and champions’ defence in Italy).
Table 2 Champions mean ordinal positioning on attack (scored goals) and defence (consented goals) over 20 seasons.
| Leagues | Attack (Mean± sd) | Defence (Mean± sd) | t | p-value | Effect size (Cohen d) |
|---|---|---|---|---|---|
| Portugal | 1.20± 0.410 | 1.40± 0.754 | -1.165 | 0.258 | |
| Spain | 1.65± 0.988 | 1.85± 1.040 | -0.545 | 0.592 | |
| France | 1.30± 0.571 | 2.80± 2.285 | -3.000 | < 0.01 | 2.236 |
| Italy | 2.05± 1.146 | 1.30± 0.657 | 2.881 | < 0.01 | 1.164 |
| England | 1.45± 0.605 | 1.75± 1.070 | -1.101 | 0.285 | |
| Germany | 1.40± 0.598 | 1.70± 0.801 | -1.453 | 0.163 |
1: best positioning, 2: second, etc.
Table 3 exposes comparisons between countries’ performance. There were significant differences between the six observed football leagues in attack and defence. In attack, Italian Champions had a significantly lower positioning compared to Portugal and France. In defence, French Champions had a significantly lower positioning compared to Portugal and Italy.
Table 3 Comparison (ANOVA and Tukey post-hoc tests) of attack and defence champions’ ordinal positioning between the six leagues.
| Factors | Analyses | Square sum | df | Mean square | Z | p-value | Effect size (eta square) |
|---|---|---|---|---|---|---|---|
| Attack | Between groups | 9.342 | 5 | 1.868 | 3.196 | 0.010 | 0.123 |
| Within groups | 66.650 | 114 | 0.585 | ||||
| Total | 75.992 | 119 | |||||
| Defence | Between groups | 28.500 | 5 | 5.700 | 3.763 | 0.003 | 0.142 |
| Within groups | 172.700 | 114 | 1.515 | ||||
| Total | 201.200 | 119 | |||||
| Attack | Leagues | p-value | Defence | Leagues | p-value | ||
| Portugal | Spain | 0.431 | Portugal | Spain | 0.856 | ||
| Italy | 0.008* | Italy | 1.000 | ||||
| England | 0.906 | England | 0.946 | ||||
| France | 0.998 | France | 0.006* | ||||
| Germany | 0.962 | Germany | 0.972 | ||||
| Spain | Italy | 0.565 | Spain | Italy | 0.719 | ||
| England | 0.962 | England | 1.000 | ||||
| France | 0.698 | France | 0.151 | ||||
| Germany | 0.906 | Germany | 0.999 | ||||
| Italy | England | 0.138 | Italy | England | 0.856 | ||
| France | 0.029* | France | 0.003* | ||||
| Germany | 0.086 | Germany | 0.908 | ||||
| England | France | 0.989 | England | France | 0.084 | ||
| Germany | 1.000 | Germany | 1.000 | ||||
| France | Germany | 0.998 | France | Germany | 0.060 | ||
DISCUSSION
The main aim of the present study was to identify and compare the top six European football leagues (Portugal, Spain, France, Italy, England, and Germany) over the first twenty seasons of the 21st century, focusing on attack (scored goals) and defence (conceded goals) positioning/ranking of its champions during the referred to seasons. It was also a goal of this paper to detect an eventual attack or defence supremacy on any of these six leagues.
Results allow the extraction of several pieces of information. Portuguese (1.20) and French (1.30) leagues differ significantly from Italy (2.05) in terms of the best attack position (ranking in the number of goals scored) of the champions over these 20 years. Thus, in Italy, the positioning of the champions in the ranking of scored goals is significantly worse than those in the referred to countries, with no differences to the other three countries analysed. In terms of position in the defensive ranking (goals conceded), Portugal (1.40) and Italy (1.30) present, over the last 20 years, significantly better results than France (2.80). Thus, in France, the positioning of the champions in the ranking of conceded goals is significantly worse than that of the referred countries, with no differences from the other three countries analysed.
Besides, the only two of these six countries with significant differences in champions’ positioning in scored and conceded goals were France (attack better than defence) and Italy (defence better than attack).
Altogether, the present results, in some way, can strengthen the idea of the more defensive character of the Italian league, at least as far as their champions are concerned (they will gain more by conceding fewer goals than their opponents than by scoring more than all of them). In France, results, on the contrary, can strengthen the idea of the more offensive nature of its league, at least as far as their champions are concerned (they will gain more by scoring more goals than their opponents than by conceding less than all of them). In other words, French league’s champions may assume that it doesn’t matter the goals you suffer if you score more than the opponent: the best defence is to attack. Differently, the Italian league’s champions bet on a solid defence, and that way, a single scored goal shall be enough to win: the best attack is to defend.
In what comes to the Italian league, Catenaccio may explain, at least partially, these results. Catenaccio is a tactical system that emphasises a defensive profile. Besides, as Filho et al. (2013) revealed, Brazilian teams scored more goals per game than Italian national and league teams. The authors tried to test the mythical belief that Brazilian football teams possess an offensive style of play while Italian teams rely on a more defensive one, and, in general, they concluded that those were correct beliefs. Thus, it could be that this more defensive Italian play style transfers to the Italian champions’ profile. This was reinforced by Çobanoğlu and Terekli (2018), who stressed the importance of a good defence, as preventing the opposite team from scoring enhances their own chance of winning.
Regarding French league Champions’, although the present study hasn’t bent over comparing first and second-placed teams but only on the champions (first-placed), results seem to corroborate Del Coso et al. (2020) illations while focusing attention on Spanish main league (Laliga). These authors proposed that an offensive style of play might be crucial in winning the championship and, thus, differentiate between first and second-placed teams. The same is true with Schreiner and Elgert (2013), who declared that scoring a goal is the most important event in a football match.
For the remaining 4 leagues studied (Portugal, Spain, England, and Germany), being a champion in the first 20 seasons of the 21st century was associated with a greater balance between scoring more and conceding fewer goals. This is something that was proposed by Fofack (2020), who stated that scored and conceded goals had the same contribution to Champions League titles. Lopez-Valenciano et al. (2022), focusing on the Spanish league, highlighted that a combo playing style that combines high shooting efficacy with a high capacity to contain rival’s match play was needed for success in La Liga. These authors also said that an offensive game style that prioritises attack building and shooting on goal seems more important than establishing effective defensive strategies. Although Lopez-Valenciano et al. (2022) study was conducted and restricted to Spain, interestingly, in the present study, in all these 4 leagues, even if with no significant differences, the Champions’ mean ranking attack position was always higher than the mean ranking defence position.
In sum, it can be said that, in Italy, the “defence” (goals conceded) wins championships, in France it is the “attack” (goals scored) that wins them and in the other 4 leagues it is the balance between one and the other feature.
Interestingly, these differences were not something that could be detected in Vales et al. (2018) study while analysing these same six championships. In fact, only the Spanish main football league, La Liga, presented a remarkable competitive profile. Nevertheless, in the present study, Spanish, English, German, and Portuguese main football leagues did not differentiate among themselves on the attack/defence ranking “profile”, with only Italian and French, as seen, showing contrasting behaviours. Therefore, this reinforces the importance of using different indicators and paradigms to analyse championship characteristics as recently suggested by Matos et al. (2021).
CONCLUSION
Italian, French, and Portuguese male main football leagues revealed significant differences when considering their champions’ offensive and defensive rankings (based, respectively, on scored and conceded goals ordering, compared with internal competitors) across twenty seasons in this 21st century.
Thus, in the French football league, to be a champion seems to be more dependent upon a better attack performance (ordering positioning on scored goals) than a better defence (to be top positioned on less conceded goals). Oppositely, in the Italian football league, champions traditionally occupy top positioning on defence efficacy (fewer goals conceded among all internal competitors), even if they do not occupy first place on scored goals.
Portuguese and French football league champions tend to be better positioned on scored goals than Italian ones. Conversely, Portuguese and Italian football leagues’ champions occupy significantly higher positions on defensive rankings (less conceded goals) than French ones.


