INTRODUCTION
In cycling, drag is the force that opposes the motion of the cyclist and is caused by the interaction of the cyclist and their equipment with the air (Debraux, Grappe, Manolova, & Bertucci, 2011). The extent of drag that cyclists experience is significantly influenced by the surface area of the rider and their gear, including the bike and helmet (Defraeye, Blocken, Koninckx, Hespel, & Carmeliet, 2011). As expected, an increase in the surface area leads to an augmentation in drag, as well as air resistance due to the heightened exposure of the rider and their gear to the wind (Debraux et al., 2011). In pursuit of optimal aerodynamic performance, cycling equipment manufacturers try to maintain essential functionality while reducing the surface area of the cyclist and their equipment. Adopting a more tucked-in posture has effectively mitigated the surface area exposed to the wind, thus contributing to drag reduction (Forte, Marinho, Barbosa, Morouço, & Morais, 2020b). Furthermore, the incorporation of aerodynamic designs, such as teardrop shapes, can impact drag (Forte, Marinho, Barbosa, & Morais, 2020a). To comprehensively evaluate and optimise the cyclist’s aerodynamics, a variety of different methods and techniques exist to assess the cyclist’s aerodynamics based on experimental testing, numerical simulations, and analytical procedures (mathematical calculations) (Blocken & Toparlar, 2015).
The wind tunnel method is considered the gold standard for assessing aerodynamics (Forte, Barbosa, & Marinho, 2015). Still, CFD is less expensive and allows for a wider range of conditions to be simulated. Both CFD and wind tunnel testing have their advantages and limitations. The literature presents that CFD is a valid and precise method to assess cyclists’ aerodynamics in comparison to wind tunnel tests (Forte, Morais, Barbosa, & Marinho, 2021). However, it is dependent on the accuracy of the mathematical models used and the quality of the mesh used to discretise the geometry (Yi et al., 2022). Wind tunnel testing provides more accurate results, but it can be more expensive and may not be able to simulate all the conditions that a cyclist may encounter in the real world (Forte et al., 2015).
Accordingly, CFD is a simulation approach that examines the movement of fluids, such as air or water, using mathematical formulas and computer modelling (Beaumont, Taiar, Polidori, Trenchard, & Grappe, 2018; Blocken, Defraeye, Koninckx, Carmeliet, & Hespel, 2013; Forte et al., 2015; Forte et al., 2020b). The aerodynamics of a bicycle and rider and the impacts of wind resistance, turbulence, and drag may be studied in cycling using CFD (Mannion, Clifford, Blocken, & Hajdukiewicz, 2016). This methodology allows the study of the aerodynamics of amputee cyclists and how the amputations affect their performance in controlled conditions. By modelling the airflow for an able-bodied and amputee cyclist and examining the drag and turbulence created, it will be possible to compare the aerodynamics of cyclists with and without amputation. The outcomes of these simulations may be used to determine whether there are any aerodynamic differences between the two cyclists. CFD may also be used to calculate the energy expenditure of cycling for both able-bodied (Forte, Marinho, Silveira, Barbosa, & Morais, 2020d) and amputee cyclists (Forte et al., 2021). This methodology can determine the amount of energy needed to overcome wind resistance and maintain a specific speed. So far, no study has been identified assessing the Ec based on numerical simulations by CFD. Upon that, the aim of this study was to compare the Ec of an able-bodied and shoulder amputee cyclist based on numerical simulations by computer fluid dynamics. It was hypothesised that the able-bodied cyclist may deliver more Ec in comparison to the amputee cyclist for the same speed.
METHODS
Participant
A professional male cyclist who weighs 65 kg and is 1.72 m tall was recruited to participate in this study. The participant was 29 years old and had 15 years of experience at the data collection date. The contestant rides a bicycle with a mass of 7 kg while wearing competition clothing made of polyester, polyamide, polypropylene, and elastane fibres (KTM, Revelator Master 2017). The competitor was taking part in national contests. The Helsinki Declaration was followed at every step of the process, and written informed permission was obtained in advance. The Ethics Committee of the Higher Institute of Educational Sciences of the Douro granted approval.
Scanning
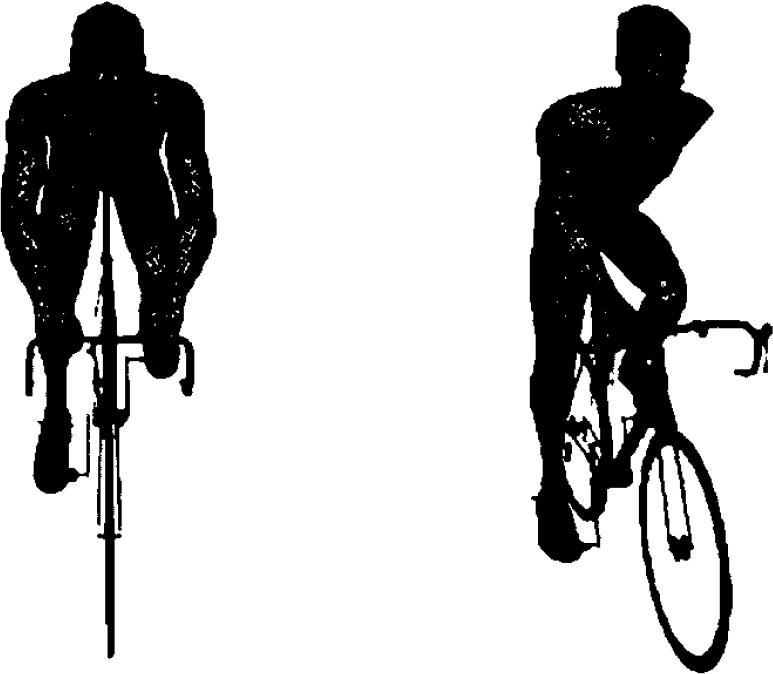
The geometry could be collected while the individual was standing up using a Sense 3D scanner (3D Systems, Inc., Rock Hill, SC, USA) and the appropriate software (Sense, 3D Systems, Inc., Canada) (Blocken, van Druenen, Toparlar, & Andrianne, 2018). The Geomagic Studio software (3D Systems, USA) was used to alter the geometry and convert it to a Computer Aided Design (CAD) model (Barbosa et al., 2017). Then, a new CAD model of a shoulder-amputee cyclist was produced using the same programme. For the able-bodied and shoulder-amputee, editions were to develop bicycle-cyclist system geometries (Figure 1).
Boundary conditions
In Ansys Workbench software (Ansys Fluent 16.0, Ansys Inc., Pennsylvania, PA, USA), the three-dimensional boundaries surrounding the bicycle-cyclist system were made, measuring 7 metres in length, 2.5 metres in width, and 2.5 meters in height for each configuration. To depict fluid flow in the opposite direction to the bicycle-cyclist systems at a distance of 2.5 m from the fluid flow input part, the Ansys meshing module permitted the generation of a grid with more than 42 million components (Blocken et al., 2013).
The average speed of trips is close to 11.1 m/s (around 40 km/h) (Bertucci, Betik, Duc, & Grappe, 2012; El Helou et al., 2010). The evaluated speeds were from 1 and 13 m/s with in increments of 1 m/s. At the inlet section of the enclosure surface (-z direction), the velocities were adjusted in the opposite direction from the orientation of the bicycle-cyclist models. In numerical simulations, the turbulence intensity was set to 1x10⁶%. Scalable wall functions were given once it was determined that the bicycle-cyclist system had a non-slip wall with zero roughness.
Numerical simulations
The Reynolds-averaged Navier-Stokes (RANS) equations are solved using the finite volume method by the Fluent CFD algorithm (Ansys Fluent 16.0, Ansys Inc., Pennsylvania, PA, USA). It was decided to use the Realisable k-e turbulence model.
The SIMPLE method was used for the pressure-velocity coupling (Forte, Marinho, Morais, Morouço, & Barbosa, 2018a). For the pressure interpolation, convection, and viscous terms, the discretisation techniques were specified as coming in second. The least-squares cell-based approach was used to calculate the gradients. Second-order and second-order upwind were used to determine pressure and momentum, respectively. The first order upwind was used to determine the kinetic energy and dissipation rate of the turbulent flow. Before 1,404 contacts, Ansys Fluent 16.0 automatically generated convergence.
Outcomes
Drag force
The coefficients of drag and effective surface were obtained from the numerical simulations (Ansys Fluent 16.0, Ansys Inc., Pennsylvania, PA, USA). The drag force was computed by Equation 1.
Fd is the drag force, Cd represents the drag coefficient, v is the velocity, A is the surface area, and ρ is the air density (1.292 kg/m3).
Energy cost
Knowing drag and rolling resistance, Equation 2 enables the assessment of the Ec (i.e., energy expenditure per unit of distance) (Forte, Marinho, Morais, Morouço, & Barbosa, 2018b).
In Equation 2, Ec is the energy cost, CR is the rolling coefficient, m is the body mass of the bicycle-cyclist system, g is the gravitational acceleration, v is the mean velocity over the race, ρ is the air density, A is the surface area, CD the drag coefficient and η the gross efficiency. The assumed gross efficiency of cyclists is 20% (Bertucci et al., 2012) and CR 0.00368 (Forte, Marinho, Morais, Morouço, & Barbosa, 2018a).
Statistical analysis
The normality and homoscedasticity assumptions were analysed using Kolmogorov–Smirnov and Levene tests, respectively. The t-test paired samples compared the two models (able-bodied vs. amputee) as in previous studies (Barbosa, Ramos, Silva, & Marinho, 2018). Cohen’s d effect size was set as without effect if d< 0.2, moderate effect if 0.8> d≥ 0.2, and strong effect if d> 0.5 (Buchheit, 2016).
Simple linear regression models using CFD and analytical procedures were computed for the dataset in SI units. The determination coefficient was computed (R2). Effect sizes were set as very weak if R2< 0.04, weak if 0.04≤ R2< 0.16, moderate if 0.16≤ R2< 0.49, high if 0.49≤ R2< 0.81, and very high if 0.81≤ R2< 1.0 (Barbosa et al., 2018; Forte et al., 2020c).
RESULTS
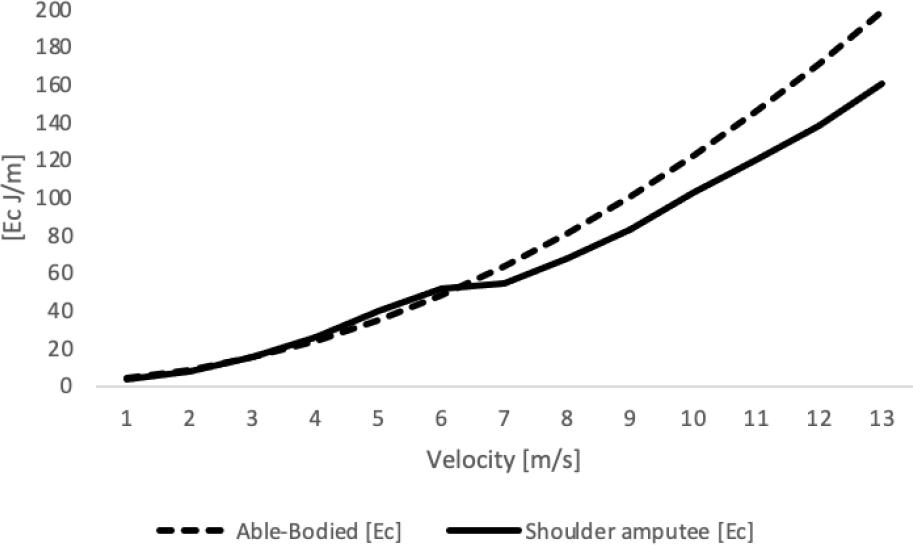
The Ec varied between 4.13 and 198.60 J/m for the able-bodied and 3.88 and 160.42 J/m for the shoulder amputee. Figure 2 depicts the energy cost of an able-bodied and a shoulder amputee cyclist.
The mean Ec at the different velocities was 78.44 (± 64.74) J/m for able-bodied and 67.14 (± 50.90) J/m for the shoulder amputee cyclist. Statistically significant differences were noted between the able-bodied and shoulder amputee (T= 2.814; p= 0.016; d= 0.78 [0.143–1.393]).
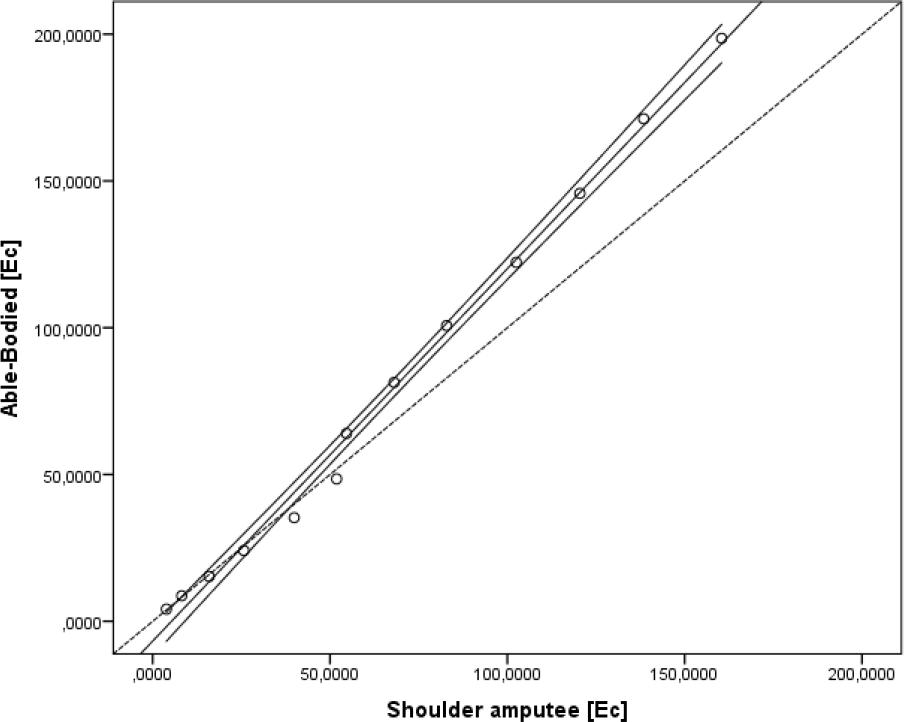
The linear regression models produced with able-bodied and shoulder amputee presented a significant relationship and very high effect sizes for Ec in absolute units (R2= 0.995; R2a= 0.997; SEE= 0.02; p< 0.001).
The trend line equation (Y= -6.735 + 1.269x) between methods was above the reference line (Y= x), as presented in Figure 3. Additionally, it was possible to observe that the able-bodied overestimates the shoulder-amputee Ec.
DISCUSSION
The aim of this study was to compare the Ec of an able-bodied and shoulder amputee cyclist based on numerical simulations by computer fluid dynamics. The defined hypothesis was that the able-bodied cyclist may deliver more Ec in comparison to the amputee cyclist for the same speed. The hypothesis was confirmed.
This study was conducted based on numerical simulations to assess the drag and analytical procedures to estimate the rolling resistance (resistive force) and Ec. This methodology has already been used in previous research on cyclists (Forte et al., 2020d; Forte et al., 2021).
The Ec exhibited a diverse range, spanning from 4.13 to 198.60 J/m for the able-bodied and 3.88 to 160.42 J/m for the shoulder amputee. Specifically, the mean Ec for the able-bodied amounted to 78.44 (± 64.74) J, while the shoulder amputee cyclist demonstrated a mean Ec of 67.14 (± 50.90) J. To contextualise these findings, a similar study presents the Ec of a transradial and transtibial cyclist with mean values of 86.17 (± 72.02) J/m and 82.67 (± 67.90) J/m, respectively (Forte et al., 2020d). It is worth noting that the presented values for the able-bodied align with the outcomes of a previous study that employed an identical three-dimensional model (Forte et al., 2020d). This consistency underscores the reliability and validity of the methodology and further strengthens the comparative analyses across diverse cyclist profiles. The differences may be related to individual characteristics of cyclists and bicycles.
Significant differences were noted for Ec between the able-bodied and the shoulder amputee. The study by Forte et al., 2020d) showed no significant differences between transradial and transtibial amputee cyclists in comparison to able-bodied cyclist, which could be explained by the drag differences. The amputee cyclists (transradial and transtibial) drag presented no statistically significant differences in comparison to the able-bodied. It is important to note that the surface area was smaller for amputee cyclists in comparison to the able-bodied cyclist. In these cases, the drag tends to be lower. However, the drag was higher for transradial and transtibial amputees. This could be explained by the possible fluid vorticity around the arm and thigh (Forte et al., 2020b). Another study presented the pressure maps of the respective amputees and able-bodied cyclist. It was possible to note that higher pressure was observed in amputee cyclists, resulting in higher drag and Ec (Forte et al., 2021). In the present study, the shoulder amputee presented lower drag in comparison to the able-bodied. We can argue that the vorticity was possibly lower in this case, and the pressure maps had smaller variations, contributing to lower drag (Forte, Morais, Neiva, Barbosa, & Marinho, 2020e) in the shoulder amputee. The drag coefficient variations with speed contribute to total drag and Ec variations (Forte et al., 2020c).
Additionally, the drag coefficient is susceptible to the object’s shape. This has been appointed as an important factor to explain the drag and Ec variations (Forte et al., 2020b; Forte et al., 2021). The differences between the able-bodied and shoulder amputees in the present study are the lack of symmetry and the differences in surface area (lower in the shoulder amputee). Altogether, these factors explain the statistically significant variations in the Ec between the shoulder amputee and the able-bodied cyclist in this study. Such knowledge contributes to understanding cycling performance and may inform training, equipment design, and energy optimisation strategies for diverse cyclist populations.
This study presents the following limitations: (i) only one participant was recruited; (ii) only one position was assessed; (iii) this is a passive (static) analysis; and (iv) only one specific condition was evaluated. However, it is important to highlight that this is the first study comparing the Ec based on CFD and analytical procedures, and the findings of this study showed how much the difference is between the Ec of a shoulder amputee and an able-bodied cyclist.
CONCLUSIONS
The estimated Ec was lower for a shoulder amputee in comparison to an able-bodied cyclist. Significant statistical differences and relationships were found between the cyclists for the 11 selected speeds. Altogether, this study empowers that, for the same conditions, an able-bodied cyclist delivers less Ec compared to a shoulder amputee.


