


 Inglês (pdf)
 Artigo em XML
 Referências do artigo
 Enviar este artigo por email
 Citado por SciELO
  Similares em
SciELO
Similares em
SciELO 
 Permalink
INTRODUCTION
The phenomenon of post-activation performance enhancement (PAPE) is characterised by a temporary improvement in physical capabilities, such as strength and power, resulting from a preceding conditioning activity (CA) (Blazevich & Babault, 2019; Boullosa et al., 2020). Several mechanisms, such as an increase in muscle temperature, fibre water content, and muscle activation, may account for this phenomenon (Boullosa et al., 2020). To enhance its performance, trainers employ a conditioning activity, which should involve the same muscle groups and movement patterns as the subsequent activity (Seitz & Haff, 2016).
It is widely acknowledged that potentiation and fatigue are the main determinants of PAPE induction (Rassier & MacIntosh, 2000; Seitz & Haff, 2016). The outcome of PAPE induction depends on the balance between these two determinants. If the CA induces a substantial level of fatigue, it may not lead to potentiation. On the other hand, if the CA stimulus promotes potentiation more than fatigue, some degree of potentiation may occur (Rassier & MacIntosh, 2000; Seitz & Haff, 2016). To address this issue, previous studies have examined the type of exercise for conditioning activity, intensity, volume, and rest intervals (Bogdanis et al., 2014; Esformes et al., 2011) to determine the optimal parameters for triggering PAPE. While there are no specific guidelines for the optimal volume to induce PAPE, it is known that a wide range of intensities can increase PAPE and CA, from plyometric body weights to supramaximal loads. Among these, high intensities (between 80 and 90% of 1 repetition maximum (RM) have been the most studied (Krzysztofik & Wilk, 2020; Krzysztofik, et al., 2020; Krzysztofik, Wilk, et al., 2021; Seitz & Haff, 2016; Wilson et al., 2013).
It is worth noting that individual characteristics of participants, such as muscle fibre type, training experience, rest time, muscle strength, and fatigue resistance, also have a significant influence on PAPE induction (Seitz & Haff, 2016; Wilson et al., 2013). Also, there are differences between men and women, with men having a larger cross-sectional area of type II fibres, a higher firing frequency of motor unit, and relatively lower oxidative capacity (Mihic et al., 2000; Pincivero, Coelho, & Campy, 2003; Pincivero, Gandaio, & Ito, 2003). These differences may lead to different times of PAPE increase, as induced fatigue may be superior in men. Additionally, Rixon et al. (2007) found a smaller PAPE effect on countermovement jump (CMJ) in women compared to men after an isometric squat with maximal intention of contraction. Krzysztofik, Kalinowski, et al. (2021) have also shown that performing a single set of 80% 1RM of back squat with 10% velocity loss (VL) in female amateur volleyball players does not result in PAPE. To our knowledge, there are no studies comparing CA with VL in active men and women.
Also, it seems that rest time between the CA and the subsequent exercise may impact the magnitude of PAPE (Wilson et al., 2013). Seitz and Haff (2016) have shown that PAPE effects may be greater after longer recovery periods (5-7 min, ES= 0.49; C8 min, ES= 0.44). Although, Krzysztofik, Kalinowski, et al. (2021) have shown that in female volleyball players the rest time between CA and PAPE is highly individualised. This might be due to an explanation from the work of Rassier and MacIntosh (2000), who proposed that fatigue and potentiation can coexist, and it is possible to enhance performance if the level of fatigue induced by CA does not dominate the levels of potentiation.
Velocity-based resistance training has been shown to be a practical approach to monitoring and quantifying the intensity and volume of resistance exercise. The real-time measurement of VL during multiple repetitions is a sensitive indicator of neuromuscular fatigue, making it a potentially useful tool for coaches to target PAPE by maintaining the optimal balance between potentiation and fatigue (Rodríguez-Rosell et al., 2020). To date, only four studies (Krzysztofik, Kalinowski, et al., 2021; Athanasios et al., 2021; Tsoukos et al., 2019) have investigated the use of VL during CA to optimise PAPE. The studies suggest that a greater PAPE is achieved after a 10 than a 30% VL and that heavy loads (80% 1 RM) are more effective than lighter loads (80 and 60% vs 40% 1 RM). However, the effectiveness of CA seems to vary from person to person. Moreover, Krzysztofik, Kalinowski, et al. (2021) have analysed the effects of VL on the lower limb in female amateur volleyball athletes, showing that PAPE effects are highly individualised, with only 56% of the participants responding positively to the CA. It is unclear whether these effects are similar in other populations, such as resistance trained men and women, and the effects of different VL levels in the CA are unknown. Therefore, investigating the efficacy of VL CA in improving lower body performance in resistance trained men and women may provide new insights into the broader use of VL CA in different populations.
Since VL can induce the same level of fatigue, it might be an optimal strategy to induce PAPE. However, there are no studies comparing the effects of a CA in active men and women in the lower limb, nor the differences between men and women. Therefore, the aim of the present study was to evaluate the optimal rest interval during heavy parallel squats, the different VL in the CA on PAPE and the differences between men and women during the subsequent CMJ. We hypothesised that both VL would induce PAPE and that women would have the effect with a prolonged rest interval.
METHODS
Participants
Twenty active adults (10 men and 10 women) participated in this study, and complete participants’ characteristics are presented in Table 1. Participants had no previous training background in power training but had experience of at least 1 year of performing back squat. All participants had no musculoskeletal injuries prior to the study and were not taking any nutritional supplements or drugs/medications. The sample dimension analysis was performed using G*Power 3.1 software (Faul et al., 2007). Under a framework assuming an estimation error of α= 0.05, power= 95%, and an effect size of 0.357, having 6 measures (moments) x 3 interventions, an n of 18 was necessary. Written informed consent was obtained from each participant after a thorough explanation of the protocol involved, the possible risks associated with it, and the right to withdraw the participation. The study was approved by the Ethics Board of the University of Trás-os-Montes and Alto Douro (Doc64A-CE-UTAD-2021 and Doc64B-CE-UTAD-2021) and all procedures were in accordance with the Code of Ethics of the World Medical Association (Declaration of Helsinki of 1964, as revised in 2013).
Table 1 Participants characteristics*.
| MEN | WOMEN | |
|---|---|---|
| Age | 21.9± 3.7 | 20.7± 1.2 |
| Height | 1.8± 0.1 | 1.6± 0.1 |
| Body Mass | 78.5± 9.9 | 56.9± 4.7 |
| Body Fat | 18.6± 6.9 | 23.3± 8.1 |
| 1 Repetition Maximum | 111.5± 30.9 | 61± 9.1 |
| Relative Strength | 1.4± 0.3 | 1.1± 0.2 |
*Variables are presented with Means ± Standard Deviation.
Procedures
A randomised repeated measures design was used to examine PAPE of CMJ performance by squat exercise on two different occasions and one control session. The two different conditions included 80% of 1RM and two different VL percentages (10 and 30% of mean propulsive velocity).
Participants attended three preparatory sessions. At the first session, anthropometric data were collected, and familiarisation with the CMJ was provided. In the second session, participants were familiarised with the squat exercise and incremental loading protocol (1RM). On the third visit, participants performed the incremental loading protocol for the squat exercise. Participants were instructed to perform the eccentric phase at a controlled velocity (i.e., 0.45-0.65m.s-1) and to move as fast as possible during the concentric phase (Pareja-Blanco et al., 2017).
Three experimental sessions were performed 48 to 72 hours apart from each other after the preparatory sessions. The conditions for each session were as follows:
Control session, participants did not perform CA but only the CMJ;
80% of 1RM until the MPV dropped by 10%;
80% of 1RM until the MPV dropped by 30%.
In each session, participants rested for three minutes after the standardised general and specific warm-up and then performed a CMJ, which was recorded as baseline. After five minutes of rest, participants tested the load equivalent to 80% of 1RM; if the velocity value had a deviation of 0.02 m/s, the load was adjusted until it corresponded to 80% of 1RM. Then, participants performed the CA or rested for five minutes and 30 seconds. After the CA, CMJ height was reassessed at the following time points: immediately after, 2, 4, 6, 8 and 10 minutes.
General and specific warm-up
Before the preparatory or experimental session, participants performed a standardised warm-up consisting of five minutes of light cycling on a cycle ergometer (50-60 watts) and 5 minutes of dynamic stretching. After the general warm-up, participants performed a specific warm-up consisting of two sets of squats and CMJ repetitions, 10 and 5 repetitions, respectively, with a three-minute rest between sets.
Measurements
Anthropometric measurements
Anthropometric measurements were taken in the first preliminary session. Body height was measured with a stadiometer (seca 274). Body mass was measured using a scale (seca 274), and body fat was estimated from 7 skinfold thicknesses (Barreira et al., 2013) using an adipometer (Sanny AD1011-LDC).
Incremental loading test
In the third session, participants’ 1RM during the Squat exercise was determined according to the procedures described (Pallarés et al., 2020). The squat was performed with the free barbell, with participants starting from the upright position with knees and hips fully extended, stance approximately shoulder-width apart, and the barbell placed across the back at the level of the acromion. Each participant lowered in a continuous motion until they touched a bench, which was when the hips were parallel to the angle of the floor (Hartmann et al., 2013); the movement immediately reversed motion and ascended back to the upright position. Feedback was based on concentric velocity. For this purpose, a linear velocity transducer (Speed4Lift) was used (Martínez-Cava et al., 2020; Pérez-Castilla et al., 2019). Unlike the eccentric phase, which was performed at a controlled mean velocity (i.e., 0.45–0.65m.s-1) (González-Badillo et al., 2014), participants always had to perform the concentric phase of each repetition at maximum intended velocity, i.e. explosively. To motivate participants to exert maximum effort, they received strong verbal encouragement and feedback on speed during each repetition. The initial load was set at 20 kg for men and 10 kg for women and increased in 10 kg increments until velocity was 0.60 ms-1 (Sanchez-Medina et al., 2010); after that, the load was increased in 2.5–5 kg increments so that the 1RM could be accurately determined. Only the best repetition at each load was considered for subsequent analysis (Sanchez-Medina et al., 2010). Three repetitions were performed for light (< 50% 1RM), two for medium (50–80% 1RM), and only one for the heaviest loads (> 80% 1RM). Recovery times between sets ranged from three to five minutes for both light and heavy loads, respectively. The 1RM was considered the heaviest load each participant could lift with full range of motion (ROM) for each SQ without external help.
Vertical jump tests
CMJ were performed before and after the SQ exercise. After the general and specific warm-up, participants rested for 3 minutes and performed a CMJ. After the intervention with the SQ exercise, participants performed a CMJ immediately after, at 4, 6, 8 and 10 minutes. Jump height was determined using a jump mat system with open source Chronojump (Bosco-System, Barcelona, Spain). The test-retest reliability of this equipment was measured, with authors reporting intra-class correlation (Pueo et al., 2018).
Statistical analyses
All statistical analyses were performed using SPSS (version 25.0; SPSS, Inc., Chicago, IL, USA) and reported as means with standard deviations (SD). Repeated measures ANOVA was conducted for the 3 interventions × 6 moments × 2 sex model with Bonferroni post-hoc corrections, and to relativise the jump weight in CMJ height to body mass. The effect sizes were calculated using partial eta squared (ηp2). The small, medium, and large effect sizes (ES) would be reflected ηp2 in values greater than .0099, .0588, and .1379, respectively (Cohen, 2013). The dependent variables were CMJ height. The significance level was established at 5% (p< .05).
RESULTS
No effect was found between moment and intervention, moment x group and moment x intervention interactions. Differences were found between men and women in (Z(1,18)= 8.858; p= 0.008; ηp2= 0.330), suggesting that men scored significantly higher CMJ values (Mmen= 30.01, SE= 1.35; 95%CI 27.17–32.84, compared to women, Mwomen= 24.33, SE= 1.35, 95%CI 21.50–27.16).
CMJ values were significantly lower (p= 0.01) in women relative to men in every moment and every intervention. However, no statistical differences were found when CMJ values were relativised to body weight.
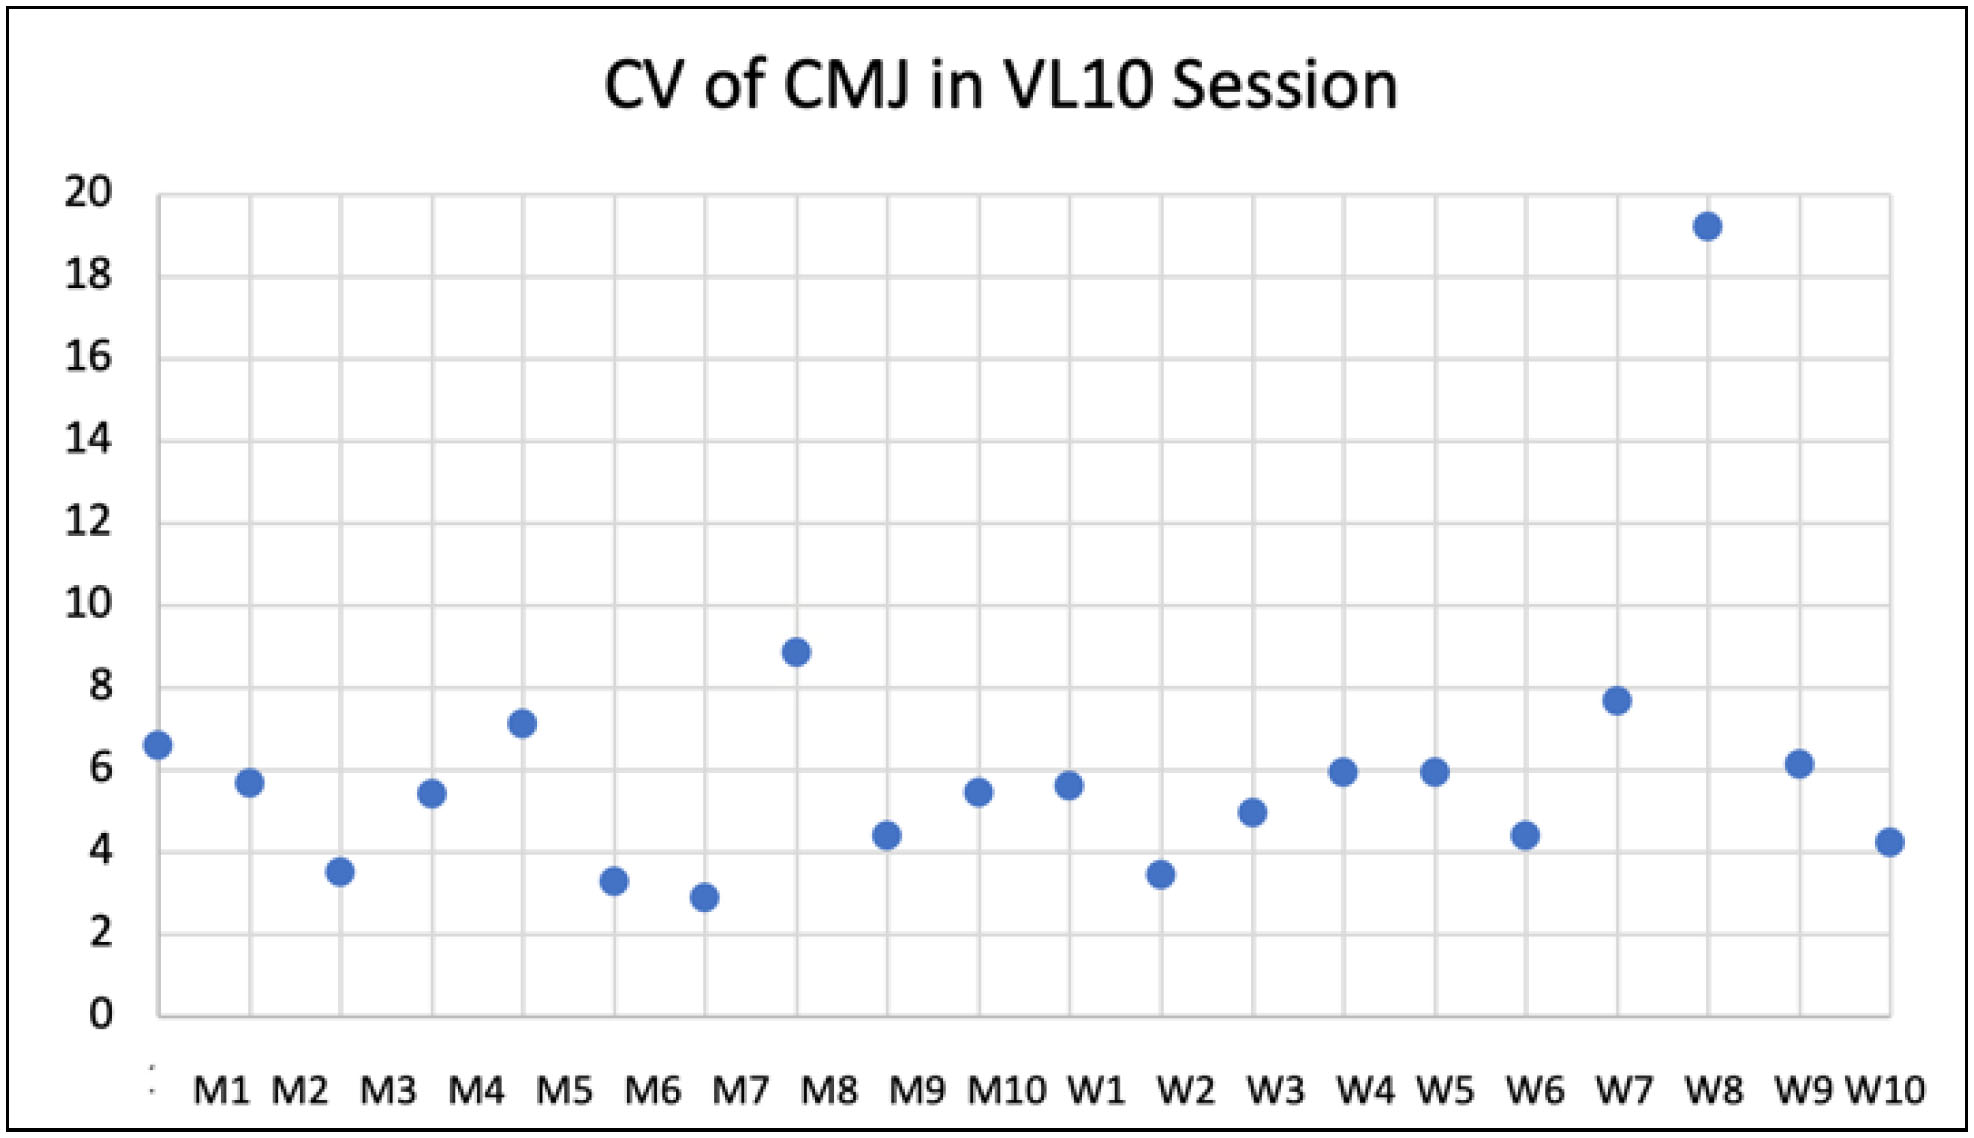
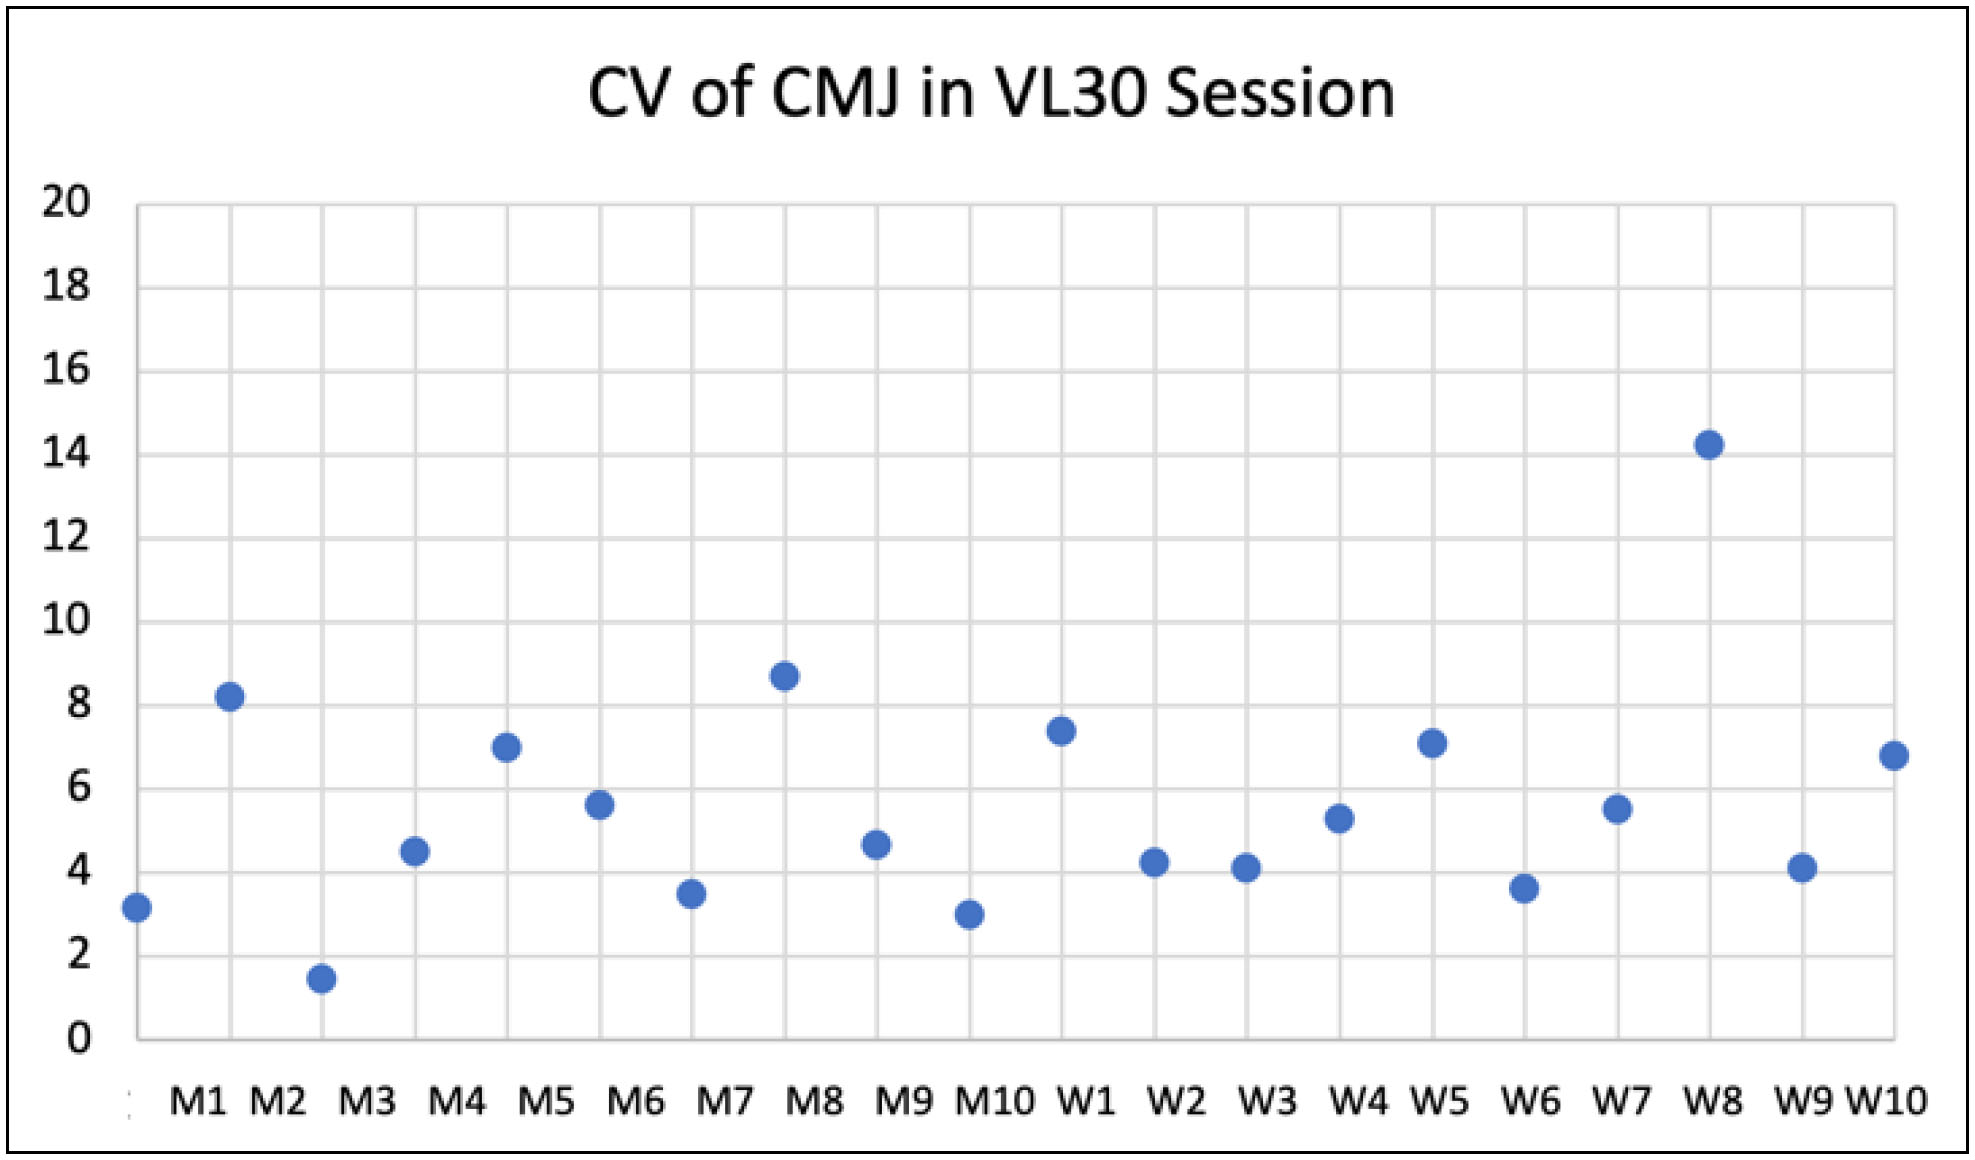
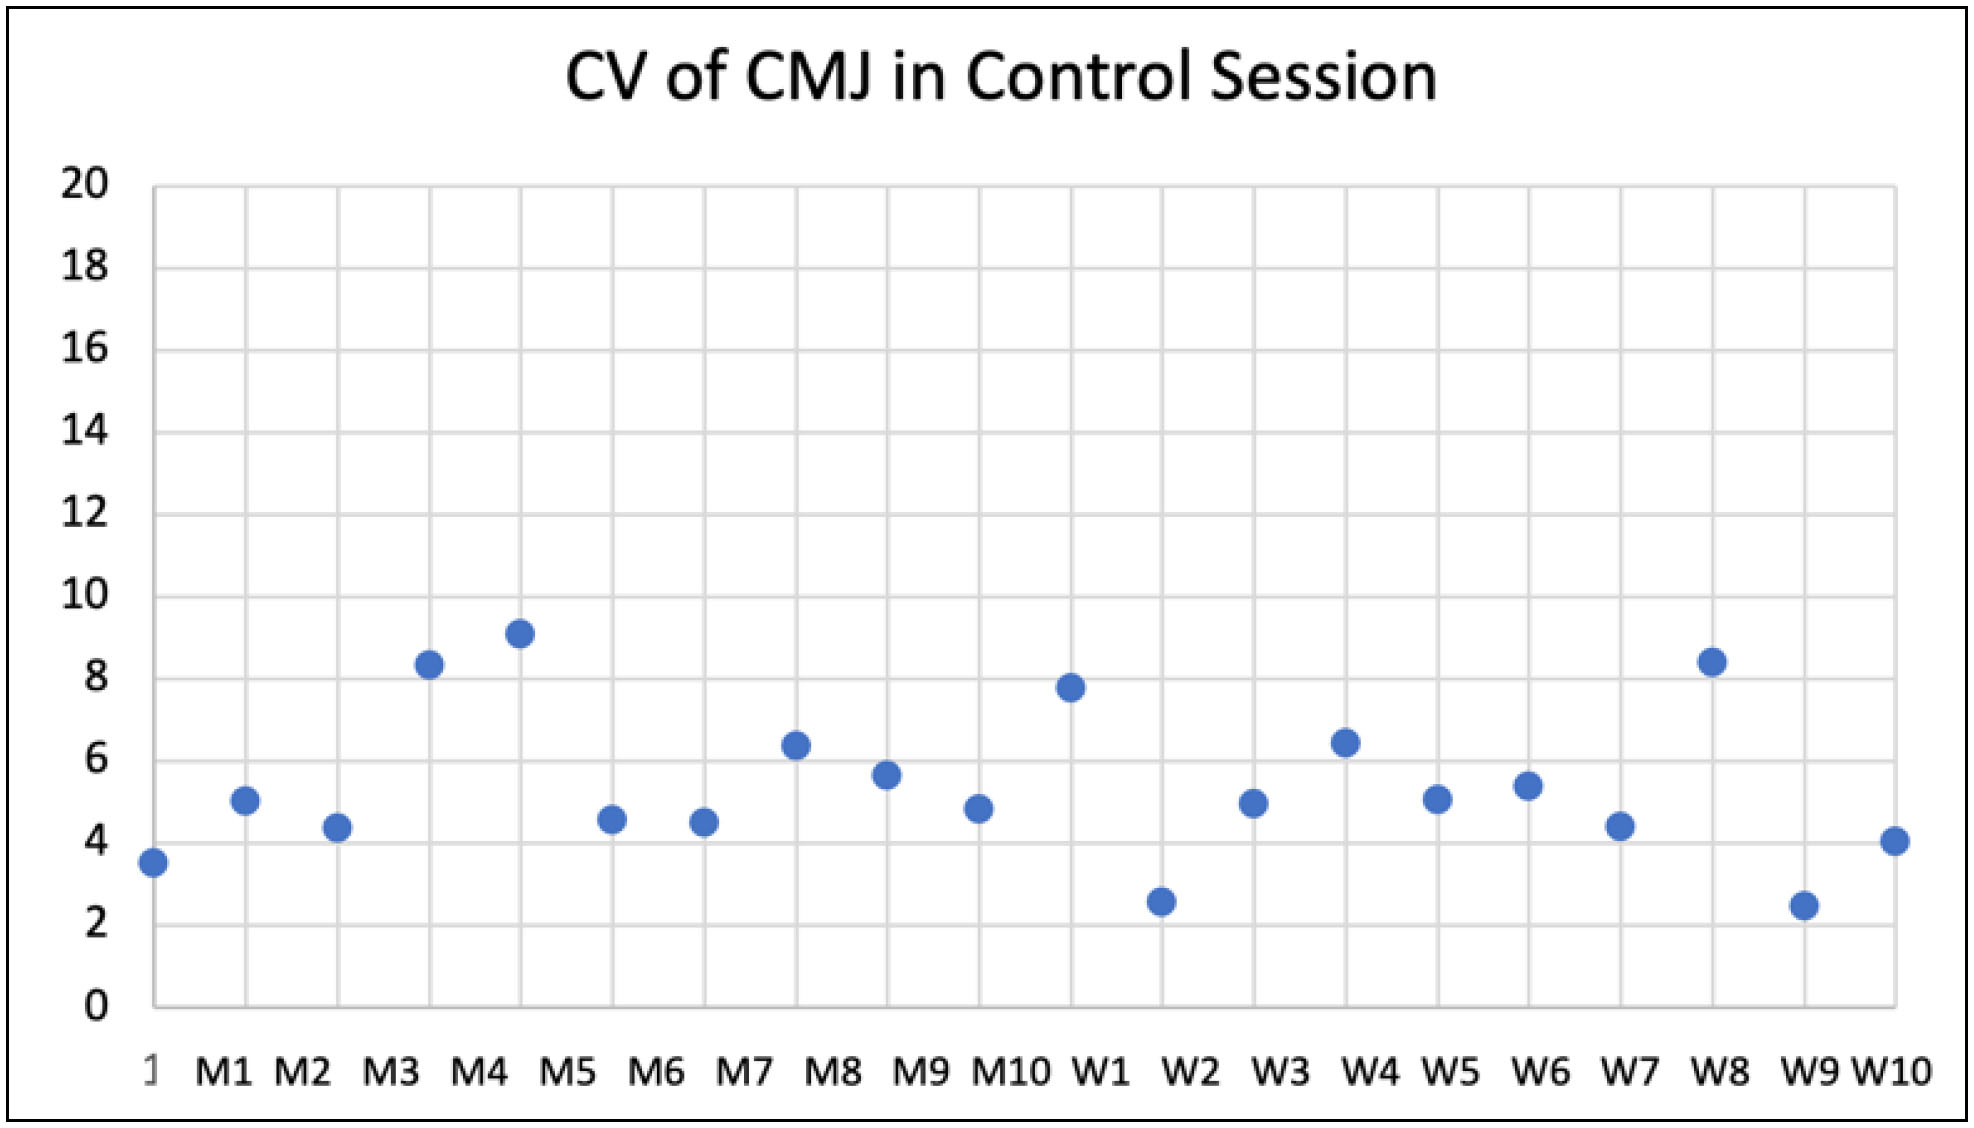
There was a high variability of inter-individual differences. For the CTRL sessions the percentage variation was 1.7± 8.7; 0.6± 8.5; 1.9± 10.8; 4.7± 10.6; 3.1± 9.2; 3.6± 7, for women and 1.1± 7.8; 0.6± 7.9; 3.9± 6.1; 0.8± 7.6; 2.3± 8.8; −0.7± 10.2 for men, for 0-, 2-, 4-, 6-, 8- and 10-minute post-intervention respectively. For the VL10 session the percentage variation was 5.1± 11.5; 0.18± 12.3; 4.7± 8.5; 4.8± 10.1; 0.11± 7.5; 4.0± 9.8 for women and 4.1± 6.9; 1.5± 6.5; 2.6± 8.6; 3.3± 9.1; −1.1± 10.1; −2.2± 8.4 for men, for 0-, 2-, 4-, 6-, 8- and 10-minute post-intervention respectively. And for VL30 session the percentage variation was 2.2± 8.7; 2.6± 10.3; 5.1± 8; −1.9± 13.3; −2.4± 9.2; −1.4± 9.4 for women and −1.7± 8.9; 1.33± 8.1; −0.42± 6.3; −0.7± 8.9; −1.5± 6.9 for men, for 0-, 2-, 4-, 6-, 8- and 10-minute post-intervention respectively.
Means± SD are presented in Tables 2 and 3. Figures 1, 2 and 3 show the coefficient variation for each individual and each session.
Table 2 Means and standard deviations of variables.
| MEN | WOMEN | |
|---|---|---|
| Number of Repetitions VL10 | 3.1± 1 | 3.8± 1.2 |
| Number of Repetitions VL30 | 9± 1.9 | 7.3± 3.0 |
| % of Velocity Loss VL10 | 10.6± 2.5 | 10.2± 3.6 |
| % of Velocity Loss VL30 | 32± 7.9 | 29.4± 6.8 |
VL10: Velocity loss 10% group; VL30: Velocity loss 30% group; Variables are presented with Means ± Standard Deviation.
Table 3 Means and standard deviation of countermovement jump from interventions.
| MEN | WOMEN | |||||
|---|---|---|---|---|---|---|
| CTRL (N= 10) | VL10 (N= 10) | VL30 (N= 10) | CTRL (N= 10) | 10VL (N= 10) | 30VL (N= 10) | |
| Mean± SD | Mean± SD | Mean± SD | Mean± SD | Mean± SD | Mean± SD | |
| Baseline | 29.8± 4.4 | 29.1± 4.5 | 30.9± 4.1 | 23.6± 5.3 | 23.7± 4.1 | 24.5± 3.6 |
| Post-CA | 30± 3.9 | 30.2± 4.5 | 30.2± 4.3 | 23.7± 4.4 | 24.7± 4 | 25.1± 4.7 |
| 2 min | 30± 5.1 | 29.5± 5.2 | 31.1± 3.6 | 23.6± 5.4 | 23.9± 6 | 25.3± 5.4 |
| 4 min | 30.9± 4.6 | 29.6± 3.8 | 30.7± 4.3 | 23.9± 5.3 | 24.8± 5 | 25.7± 4 |
| 6 min | 30± 4.6 | 29.8± 4 | 30.6± 4.4 | 24.4± 4.8 | 24.8± 4.9 | 24.2± 5.4 |
| 8 min | 30.6± 5.4 | 28.5± 3.3 | 30.3± 3.7 | 24.1± 4.9 | 23.8± 5 | 24± 4.7 |
| 10 min | 29.7± 6 | 28.4± 4.6 | 30.3± 4.4 | 24.2± 4.8 | 24.7± 5.2 | 24.3± 5 |
CTRL: control group; VL10: velocity loss 10% group; VL30: velocity loss 30% group; CA: conditioning activity; SD: standard deviation; Men 95%CI CTRL 26.7–33; 27.2–32.8; 26.4–33.6; 27.7–34.1; 26.7–33.3; 26.7–34.4; 25.5–33.7, VL10 25.88–32.26; 26.7–33.4; 25.8–33.2; 26.9–32.4; 27–32.7; 26.1–30.9; 25.1–31.7, VL30 27.9–33.8; 27.1–33.3; 28.5–33.7; 27.6–33.8; 27.4–33.7; 27.7–32.9; 27.1–33.5 for Baseline, Post-CA, 2-min; 4-min, 6-min, 8-min and 10-min respectively. Women 95%CI CRTL 19.8–27.4; 20.5–26.9; 19.8–27.5; 20.1–27.7; 21–27.9; 20.6–27.6; 20.8–27.7, VL10 20.8–26.6; 21.9–27.6; 19.6–28.2; 21.3–28.4; 21.3–28.3; 20.2–27.3; 21–28.4, VL30 21.9–27; 21.7–28.4; 21.4–29.2; 22.8–28.6; 20.3–28.1; 20.7–27.3; 20.7–27.8 for Baseline, Post-CA, 2-min; 4-min, 6-min, 8-min and 10-min respectively.
DISCUSSION
The main finding of the present study was that there were no differences in any intervention, and there was no optimal rest time to induce PAPE. Although the values were lower in women at any moment and with each intervention, no statistical differences were found when they were relativised to body weight. There was no difference between VL 10 and 30% for any interventions. Differences in CMJ were similar between the two interventions and CTRL, which ranged from −2.35 to 5.10% difference. In the present study, it does not seem to make a difference in performing a CA activity based on VL or no activity at all (CTRL). However, looking at the individual analysis, the variability at PAPE is very high. Some individuals achieved a 14.70% increase in CMJ and others an 11.19% decrease, suggesting that the PAPE effect may be individually dependent. Our results are consistent with previous research studies, that found that the response of PAPE is highly individualised (Chiu et al., 2003; Evetovich et al., 2015; Hamada et al., 2000; Krzysztofik, Kalinowski, et al., 2021; McCann & Flanagan, 2010). Therefore, implementations of these types of protocols in training programs should be used carefully and reviewed individually before application.
It has been suggested that the balance between fatigue and potentiation may be the main factor affecting the degree of PAPE, according to CA (Chiu et al., 2003; Hamada et al., 2000). Therefore, an individualised approach that adjusts the type of CA and the variables (volume and intensity) should be preferred. It seems weaker individuals are less resistant to fatigue than stronger individuals and may not show PAPE effect (Chiu et al., 2003; Hamada et al., 2000). Seitz and Haff (2016) classified stronger and weaker individuals by their relative strength, with ³ 1.75 being stronger for men and > 1.5 for women in the back squat. Because the individuals of the present study can be classified as weaker (1.4± 0.29 kg×kg-1; 1.1± 0.19 kg×kg-1, men and women, respectively), this may be one of the factors that influenced the results.
Since fatigue seems to be an important factor modulating PAPE, our hypothesis (Seitz & Haff, 2016; Seitz et al., 2014; Seitz et al., 2016; Stone et al., 2008) was that the VL30 condition would show an increase at a later time. Seitz and Haff (2016) have shown that athlete level influences PAPE performance, either in terms of an earlier increase in performance or the degree of increase, which agrees with the present study since there were no effects in PAPE in both interventions. González-Badillo et al. (2016) also showed that reaching failure produced a higher degree of fatigue, although the VL of reaching failure in the squat exercise was 44%, and in the present study, 10 and 30% were used as the degree of VL. So, it could be that the degree of fatigue between 10 and 30% is very low, which could be why there is no difference at PAPE.
Seitz and Haff (2016) showed in their systematic review that the depth of the squat has an influence on the degree of PAPE. This showed a better effect with a half squat (ES= 0.58) than with a deeper squat (ES= 0.25), and the hypothesis is that a parallel squat causes more fatigue. Therefore, there may be a worse relationship between fatigue and potentiation. This is consistent with the previous report by Place et al. (2005), which showed a higher degree of post-twitch potentiation after fatiguing contractions at short muscle length compared to long muscle length in the quadriceps muscle but with a similar degree of fatigue between conditions. Thus, the difference between 10 and 30% of VL may not be sufficient to cause fatigue, and the depth of exercise may be the main cause of fatigue.
High loads are usually recommended to promote PAPE when using traditional resistance exercise as CA because they elicit recruitment of higher threshold motor units that innervate Type II muscle fibres (Seitz & Haff, 2016). However, PAPE can also be induced by low to moderate loads and by plyometric exercises (Krzysztofik & Wilk, 2020; Krzysztofik et al., 2020; Rassier & MacIntosh, 2000; Seitz & Haff, 2016; Wilson et al., 2013) and PAPE can be observed earlier when plyometric exercises are used. Contrary to this, the present study showed no significant increase in CMJ over time. In practice, using strategies to induce PAPE in weaker populations may not be beneficial. However, future studies should be conducted comparing the effect of PAPE with a VL intervention with a plyometric, traditional high-intensity variable depth squat.
To the best of our knowledge, Krzysztofik, Kalinowski, et al. (2021) was the only study that used the squat as a CA activity with VL, although their study only used women. They found no significant differences in their intervention and noted that the PAPE effects are highly individualized. This is consistent with the present study in that there were no significant increases in the CMJ, and there were several differences between participants. However, no studies address differences in the PAPE effects between men and women. Also, Krzysztofik, Kalinowski, et al. (2021) had only one intervention with CA with VL (10% of VL, with 80% 1RM) and in the present study there were two groups (10 and 30% of VL, with 80% 1RM). Further studies should be conducted to study the relationship between VL, intensity and the effects of PAPE.
Previous studies (Rodríguez-Rosell et al., 2020; Tsoukos et al., 2019; Tsoukos et al., 2021) have shown that velocity-controlled CA is an effective method to induce PAPE, although this is contrary to the present study, individual difference was found. Similar to the study of Krzysztofik, Kalinowski, et al. (2021), low volume was not sufficient to induce PAPE and may not be sufficient to increase muscle activation and temperature and/or intramuscular fluid accumulation (Blazevich & Babault, 2019), nor was greater volume sufficient to induce PAPE. There is a consensus that a key point to induce PAPE is the balance between fatigue and potentiation (Seitz & Haff, 2016). Therefore, we hypothesised that by taking into account the fatigue profile of the participants and considering that the control of VL during multiple repetitions can serve as an indicator of neuromuscular fatigue (Rodríguez-Rosell et al., 2020), we could obtain a more homogeneous PAPE effect. However, this was not observed in the present study and is consistent with several studies (Chiu et al., 2003; Evetovich et al., 2015; Hamada et al., 2000; McCann & Flanagan, 2010), which may suggest that other factors are more important in triggering PAPE.
Seitz and Haff (2016) have shown that a multiple set of CA appears to be more effective in triggering PAPE in weaker individuals. Because participants in the present study were classified as weaker (< 1.75 and < 1.5 for men and women, respectively), a multiple-set intervention rather than a single set of CA should be preferred. This is a major limitation of our study. However, since this was the first study to analyse the effects of a CA using VL in PAPE with resistance-trained men and women, we decided to use only a single set of CA. However, future studies should examine the differences between single and multiple-set interventions in weaker individuals.
Also, it seems that there is no optimal rest time between CA and PAPE. Seitz and Haff (2016) have shown that there may be an optimal rest time between CA and PAPE (5-7 min, ES= 0.49; C8 min, ES= 0.44). However, they also showed that rest time seems to be dictated by the individual's strength level, showing that stronger individuals may express their greatest PAPE at 5-7 min and weaker only after 8 min (Seitz et al., 2014; Seitz & Haff, 2016). In the present study, there was no optimal rest time to induce PAPE, and these findings agree with the study of Krzysztofik, Kalinowski, et al. (2021), which, to the best of our knowledge, is the only study with a VL threshold has a CA in the lower body. It seems that the rest time is highly individualised, and in the present study, there were no differences in performing a CTRL or a VL threshold (VL10 and VL30) session as a CA. This may be because the participants in the present study were classified as weaker (< 1.75 and < 1.5 for men and women, respectively); a multiple-set intervention rather than a single set of CA should be preferred.
The present study has limitations because we used only one intensity level (80% of 1RM), and the thresholds of VL were not very different (10 vs. 30%). Other studies showed differences in fatigue when comparing 20 vs. 40% of VL in squat exercise. Furthermore, Evetovich et al. (2015) have shown that PAPE response is highly individualised, which is also evident in the present study. Therefore, a VL approach must be individualised for each participant to optimise a PAPE.
CONCLUSION
In conclusion, there is no optimal rest time to induce PAPE since there were no statistically significant effects in CTRL, VL10 and VL30. Also, in this population, performing no CA (CTRL) or a CA (VL10 and VL30) with a VL threshold is the same to induce PAPE since none of them induces PAPE. There is no difference in PAPE between men and women. However, the results are highly individualised, so trainers and coaches should analyse whether the CA is applicable to their clients.

