


 Inglês (pdf)
 Artigo em XML
 Referências do artigo
 Enviar este artigo por email
 Citado por SciELO
  Similares em
SciELO
Similares em
SciELO 
 Permalink
INTRODUCTION
Soccer is the most popular sport on the planet, and it is estimated that there are approximately 65,000 active professional players spread across the world (Baroni et al., 2020). In the last five years, women's soccer has increased approximately 4% in its popularity index (Pardos-Manier et al., 2021), in addition to an increase in physical demand during training and games (Covic et al., 2016). Thus, studies have begun to investigate the relationship between strength, muscle imbalances, and physical performance in female soccer players (Aktug et al., 2016; Bishop et al., 2019; Loturco et al., 2018).
The structure of a soccer match is predominantly intermittent, being characterised by synchronised and concomitant execution of low and high-intensity actions at different moments of the game (Lockie et al., 2019; Mohr et al., 2005; Mujika et al., 2009) such as jumping, performing successive sprints and change of direction (COD) (Ruas et al., 2015; Sangnier & Tourny-Chollet, 2007; Silva et al., 2015). Furthermore, the repetition of such actions can contribute to the development of lower limb strength asymmetry (Fort-Vanmeerhaeghe et al., 2020). Thus, in the field of football, great attention has been given to the relationship between lower limb strength asymmetry and physical performance; thus, lower limb strength asymmetry has been measured and analysed through vertical jump tests (Bishop et al., 2022; Coratella et al., 2018; Raya-Gonzales et al., 2020).
In fact, some scientific evidence shows that there may be a correlation between high scores of lower limb strength asymmetry and deleterious effects on physical performance and a higher incidence of injuries in soccer players (Chalmers et al., 2018; Loturco et al., 2018; Talovic et al., 2018). However, some recent studies have elucidated that lower limb strength asymmetry, regardless of the asymmetry score, may not interfere, either positively or negatively, with some physical abilities such as agility and the ability to jump and run at speed, in addition to not increasing the injury incidence in male and female soccer players (Bishop, Read, et al., 2021; Coratella et al., 2018; Loturco et al., 2019).
For example, Lockie et al. (2012) observed that there was no correlation between limb asymmetry in peak concentric torque (PTCON) of the hamstrings and quadriceps muscles at 60°/s with time in the 20-meter sprint and time in a COD test in amateur soccer players. Additionally, Coratella et al. (2014) clarified that there was no correlation between limb asymmetry in PTCON of the hamstrings and quadriceps muscles at 30°/s with time in the 30-meter sprint and time in a COD test in professional U21 soccer players. Furthermore, in a later study, Loturco et al. (2019) determined that there was no correlation between lower limb strength asymmetry, measured in the single leg countermovement jump (SLCMJ) and single leg squat jump (SLSJ), with time in the 20-meter sprint and time in a COD test in professional female soccer players. However, Bishop et al. (2019) observed a positive correlation between lower limb strength asymmetry, measured in the single leg drop jump (SLDJ) with time in the 30-meter sprint and time in a COD test in professional female soccer players.
Therefore, it seems that the use of different levels of competitiveness, genders, and tests to measure lower limb strength asymmetry may have a different influence on the correlation between lower limb strength asymmetry and physical performance, which is a highly relevant and still controversial variable. Additionally, to the best of our knowledge, no previous study has investigated the correlation between lower limb strength asymmetry, measured with the aid of an isokinetic dynamometer, and physical performance, measured through the repeated anaerobic sprint test (RAST), in professional female soccer players.
Thus, the main purpose of the present study was to investigate the correlation between limb asymmetry in PTCON of the hamstrings and quadriceps muscles at 60°/s with performance in the 20-meter sprint, RAST and COD test in professional female soccer players. We hypothesised that there would be no correlation between limb asymmetry in PTCON of the hamstrings and quadriceps muscles at 60°/s with performance in the 20-meter sprint, RAST and COD test.
MATERIALS AND METHODS
Participants
The sample consisted of twenty-two professional female soccer players (22.04+ 4.37 years of age; 62.24+ 5.68 kg of body mass; 1.66+ 0.05 meters of height; 22.64+ 2.47 kg/m2 of body mass index).
Inclusion and exclusion criteria
The following inclusion criteria were adopted: 1) being a professional soccer player and participating in club training; 2) absence of lesions that compromise the performance of the tests; 3) being 18 years of age or older. Likewise, the following were considered as exclusion criteria: 1) use anti-inflammatory drugs and to control blood pressure, anxiety, depression and pain.; 2) positive physical activity readiness questionnaire (PAR–Q); 3) having injuries that would compromise the performance of the experimental protocols; 4) not having authorisation from the club's medical department to perform the tests.
All subjects signed an informed consent form before participating in the study, which was carried out following the ethical standards provided in Resolution 466/12 (National Health Council, 2012).
Protocol
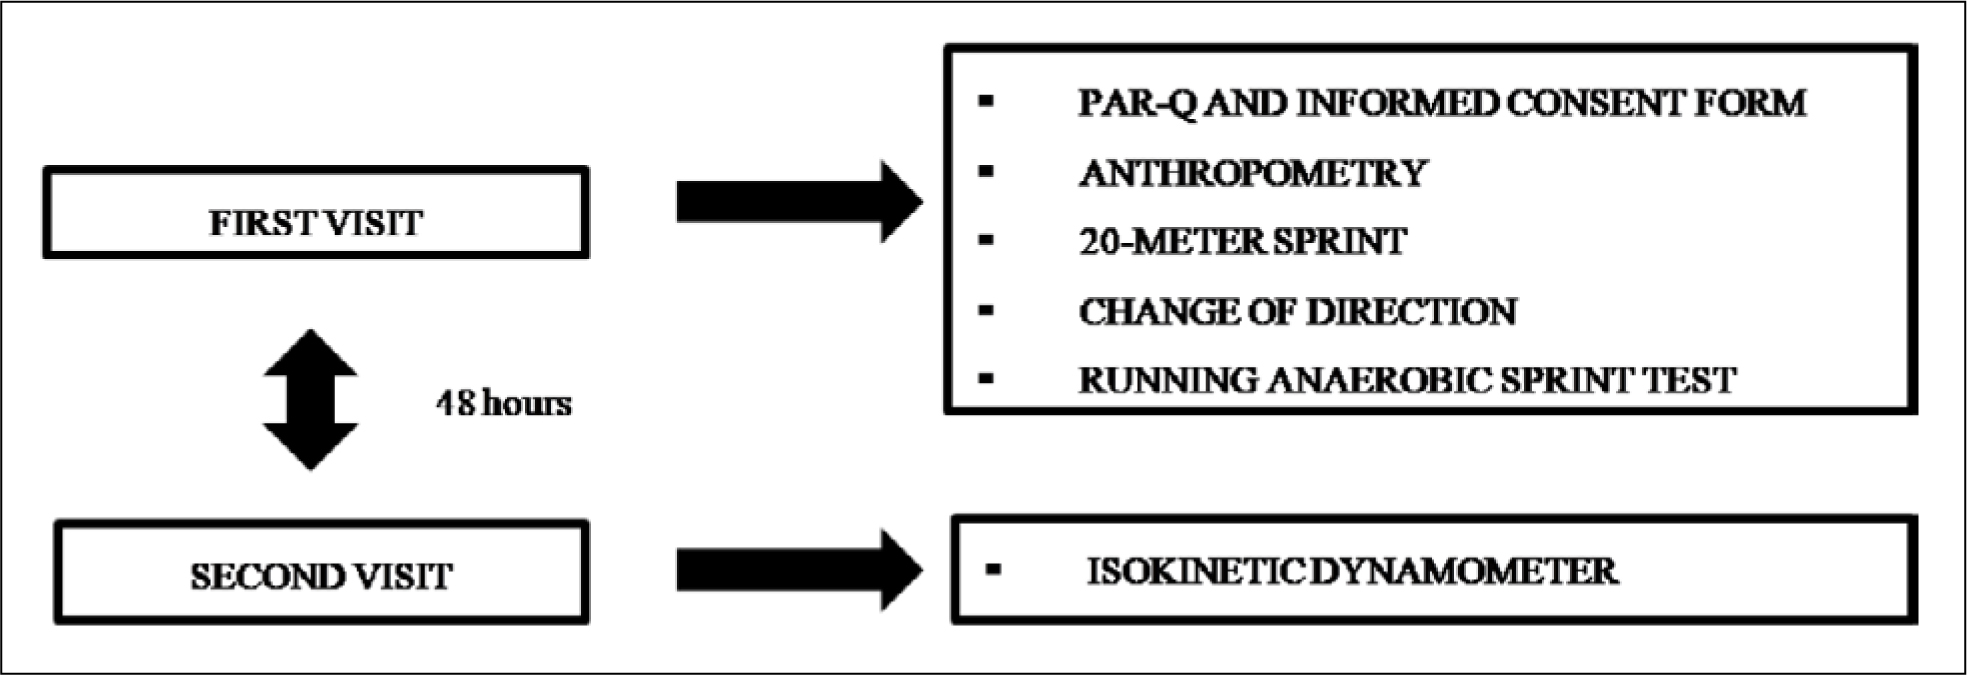
Two visits were carried out with an interval of 48 hours between them. On the first visit, procedures were performed in this order: 1) completing the informed consent form and the PAR-Q; 2) anthropometric measurements; 3) 20-meter sprint test; 4) COD test; 5) RAST. On the second visit, tests were performed on the isokinetic dynamometer (see Figure 1). Furthermore, it is important to emphasise that some environmental variables, such as temperature and relative humidity, were not controlled.
In addition, all individuals were instructed to avoid the consumption of alcohol and/or ergogenic substances at least 24 hours before testing. For each individual, the order in which the tests were performed was standardised. The present study was carried out in the pre-season period; all individuals evaluated were previously familiar with the tests due to the frequent evaluations carried out by the club throughout the regular season. It is worth highlighting that such tests are commonly carried out by the club for a period of one week during the pre- and post-season. The preferred lower limb was determined through the preference for kicking a ball, and five-minute rest intervals were adopted between each test performed on the first visit.
The PTCON of the hamstrings and quadriceps muscles was measured with the aid of an isokinetic dynamometer (Humac Norm II®, CSMI, USA). Initially, everyone was positioned as follows: seated, trunk in contact with the seat back, and hips and knees in 90° of flexion. In addition, the tested limb was stabilised by an inelastic strap; the knee of the tested limb was aligned with the axis of rotation of the dynamometer; and the trunk and shoulders were stabilised by two inelastic straps (Coratella et al., 2014). At first, a warm-up protocol was performed, consisting of one set of 10 concentric submaximal knee flexion and extension repetitions at 60°/s for each limb, with a two-minute interval between the limbs. Then, after a two-minute break, to measure the PTCON of the quadriceps and hamstring muscles at random, one set of five concentric maximal knee flexion and extension repetitions at 60°/s were performed for each limb, with a two-minute interval between attempts (Coratella et al., 2018; Vargas et al., 2020). Additionally, the limb asymmetry in PTCON of the hamstrings and quadriceps muscles was calculated separately via the Equation 1 (Impellizzeri et al., 2007):
Three pairs of photocells (CEFISE®, Nova Odessa, São Paulo, Brazil) were positioned at 0, 10, and 20 meters to measure speed and time in the 20-meter sprint. Initially, a warm-up protocol consisting of two submaximal trials was performed, with no interval between them. Subsequently, after a five-minute rest interval, two maximal attempts were performed with a five-minute rest interval between them. Furthermore, all subjects started the test at 0.3 meters behind the starting line; the test was performed on an indoor running track, and the best time was used in the data analysis (Loturco et al., 2019).
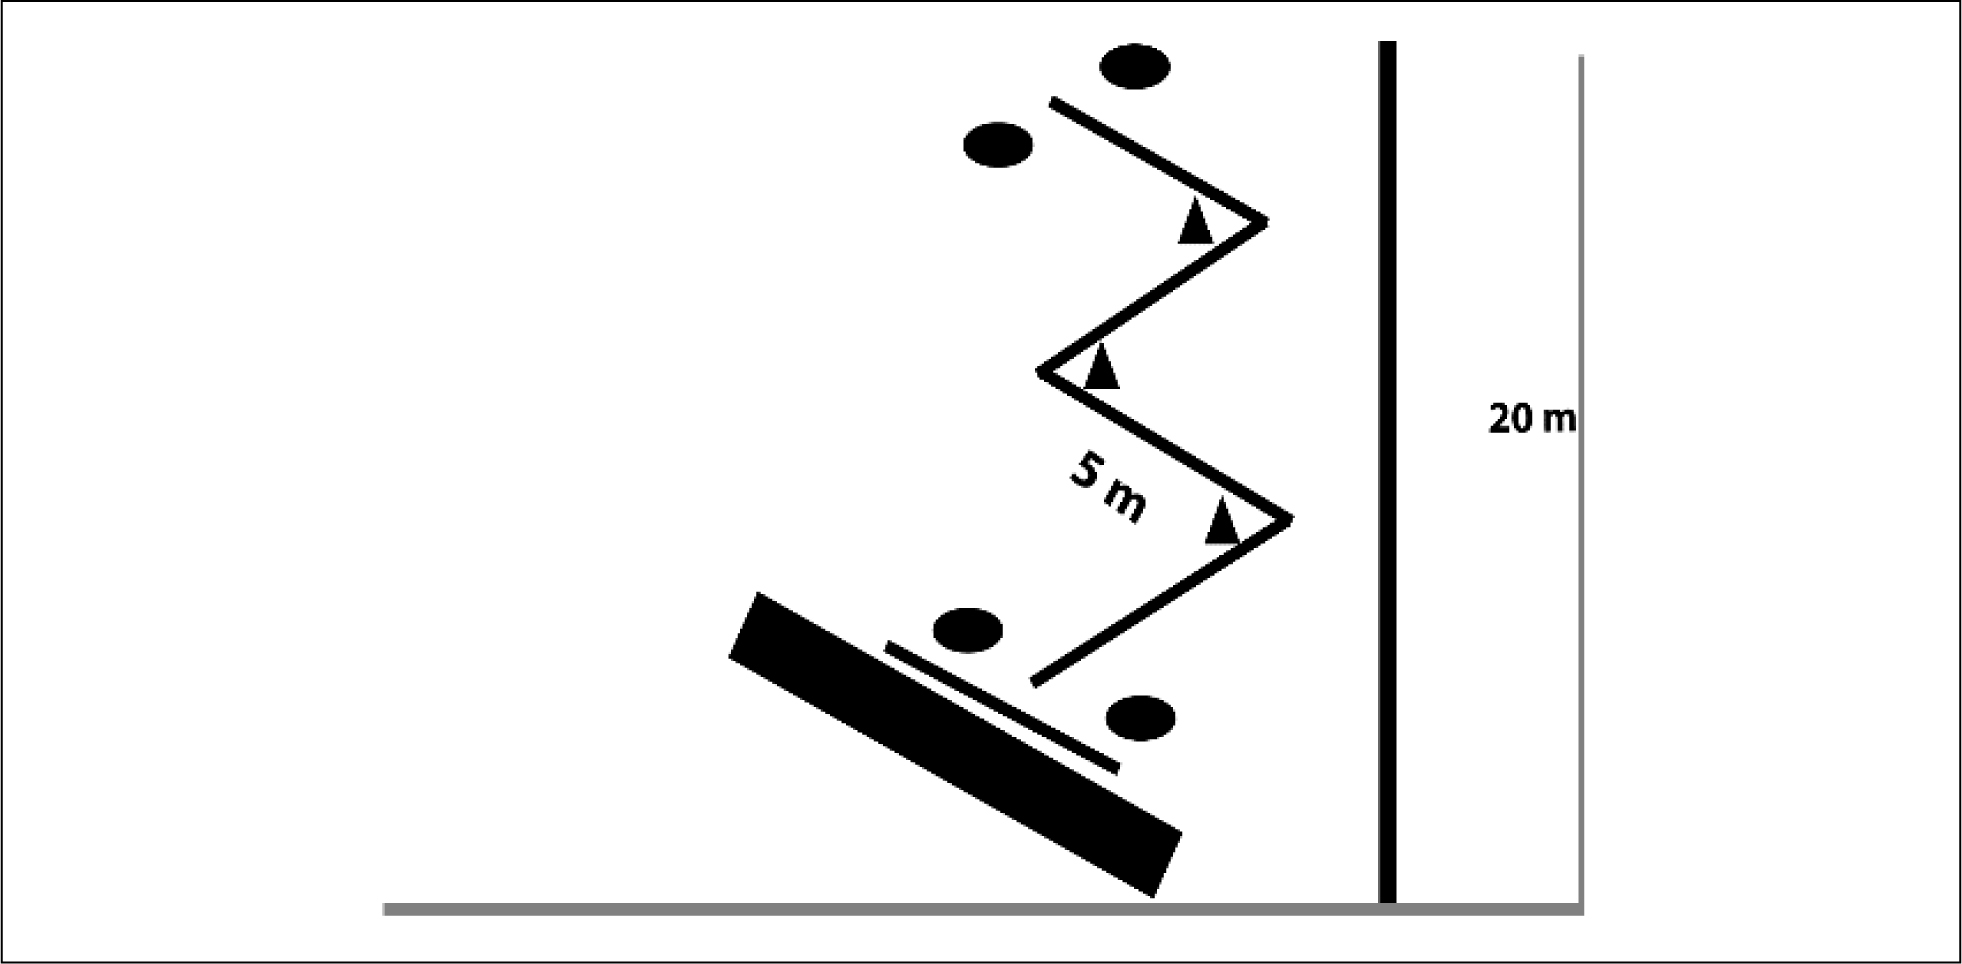
Two pairs of photocells (CEFISE®, Nova Odessa, São Paulo, Brazil) were positioned at 0 and 20 meters for the change of direction test, which was characterised by four segments of five meters (total linear distance of 20 meters), marked with cones (50 centimetres in height) and defined by 100° angles (see Figure 2). The test was performed on an indoor running track so that all subjects accelerated and decelerated as quickly as possible around each cone. Initially, two submaximal trials were performed as a warm-up, with no interval between them. Subsequently, after a five-minute rest interval, two maximal attempts were performed with a five-minute rest interval between them. In addition, all subjects were instructed to complete the test as quickly as possible and not to decelerate before crossing the second pair of photocells. The test was started at 0.3 meters behind the starting line, and only the best time was used in the data analysis (Loturco et al., 2019).
Two pairs of photocells (CEFISE®, Nova Odessa, São Paulo, Brazil) were positioned at 0 and 35 meters for the repeated anaerobic sprint test (RAST). Six sprints of 35 meters were performed at the highest possible speed, with 10-second rest intervals between them. Additionally, behind the start and finish lines, two deceleration areas, 10 meters each, were inserted; the test was performed on an indoor court; all subjects started the test 0.5 meters behind the first pair of photocells and were instructed to decelerate only after passing through the pair of photocells (Nascimento et al., 2016).
Statistical Analysis
Statistical analysis was performed using SPSS software (version 22.0; SPSS, Inc., Chicago, IL, USA). Initially, to test the normality of the data, the Shapiro-Wilk test and the analysis of asymmetries and kurtosis were performed (Chan, 2003). The sample size was calculated using the G * Power software (G * Power 3.1.9.7, Heinrich Heine-Universität, Düsseldorf, Germany) assuming an effect size= 0.56; α-error= 0.05; and Power= 0.8. The total sample size suggested by the calculation was 22 individuals. Therefore, the sample size suggested by the calculation was respected and considered in the constitution of the sample group.
The relationships between variables were determined using the Pearson product-moment correlation coefficient whenever two or more variables did not have their normality rejected and the Spearman correlation coefficient whenever a variable had its normality rejected. The threshold used to assess the correlations qualitatively was based on the following criteria: r< .10, trivial; r= .10–.29, small; r= .30–.49, moderate; r= .50–.69, large; r=.70–.89; very large; r>.90; almost perfect (Hopkins, 2006). In the present study, data were presented as mean and standard deviation values when data normality was not rejected, and median value and interquartile range (3 quartile – 1 quartile) when data normality was rejected.
Thus, the variables: a) time (p= .92) and speed (p= .87) in the 20-meter sprint; b) total time in the RAST (p= .35); c) velocity (p= .80) in the COD; d) PTCON of hamstrings of preferred (p= .64) and non-preferred (p= .50) limb; e) PTCON of quadriceps of the preferred (p= .23) and non-preferred (p= .46) limb; f) limb asymmetry in hamstring PTCON (p= .06) had normal distribution, while the variable limb asymmetry in quadriceps PTCON (p= .02) had its normality rejected. In addition, a value of p< .05 was adopted for statistical significance.
RESULTS
Table 1 presents the PTCON mean and standard deviation values of the hamstrings and quadriceps muscles at 60°/s for both limbs, the percentage of limb asymmetry in hamstring PTCON, and the median value and interquartile range of limb asymmetry percentage in quadriceps PTCON.
Table 1 Mean and standard deviation values of the peak concentric torque of hamstrings and quadriceps muscles of booth limbs, percent of limb asymmetry in hamstring peak concentric torque and median value and interquartile range (3-1) of limb asymmetry percentage in quadriceps.
| Quadriceps PTCON MP (Nm) |
Quadriceps PTCON MNP (Nm) |
Hamstring PTCON Preferred Member (Nm) |
Hamstring PTCON Non-Preferred Member (Nm) |
Limb Asymmetry in Hamstring PTCON (%) | Limb Asymmetry in Quadriceps PTCON (%) |
|---|---|---|---|---|---|
| 177. 95± 30.48 | 162.62± 41.87 | 105.75± 23.16 | 95.70± 27.33 | 11.20± 10.31 | 5.74 (3.20–9.90) |
PTCON: concentric peak torque; Nm: newton meters; %: percentage.
Table 2 describes the mean and standard deviation values of time and speed in the 20-meter sprint, total time in the RAST, and time in the COD test.
Table 2 Mean and standard deviation values of time and speed in the 20-meter sprint, total time in the running anaerobic sprint test and time in change of direction.
| 20-meter sprint time (s) | 20-meter sprint speed (m/s) | Total time in running anaerobic sprint test (s) | Time in change of direction (s) |
|---|---|---|---|
| 3.23± 0.14 | 6.19± 0.27 | 36.02± 1.78 | 3.26± 0.14 |
s: seconds; m/s: meters per second.
Table 3 presents the correlation values (r) between limb asymmetry in PTCON of the hamstrings and quadriceps muscles at 60°/s, and performance in the 20-meter sprint, RAST and COD. As a result, no correlations were observed between limb asymmetry in quadriceps PTCON and time and speed in the 20-meter sprint, total time in the RAST, and time in the COD. Furthermore, there was no correlation between limb asymmetry in hamstring PTCON and time and speed in the 20-meter sprint, total time in the RAST, and time in the COD test.
Table 3 Correlation values (r) between limb asymmetry in concentric peak torque of the hamstrings and quadriceps muscles and performance in the 20-meter sprint, running anaerobic sprint test and change of direction.
| 20-meter sprint time | 20-meter sprint speed | Total time in running anaerobic sprint test | Time in change of direction | |||||
|---|---|---|---|---|---|---|---|---|
| r | p | r | p | r | p | r | p | |
| Limb Asymmetry in Quadriceps PTCON | - .41 | .06 | .41 | .05 | - .24 | .27 | - .10 | .64 |
| Limb Asymmetry in Hamstring PTCON | - .03 | .87 | .02 | .90 | - .21 | .34 | - .15 | .50 |
PTCON: concentric peak torque;
*p< .05.
DISCUSSION
The key finding of the present study was the lack of a significant correlation between lower limb strength asymmetry and performance in the 20-meter sprint, RAST, and COD ability in professional female soccer players. Thus, these findings corroborate some previous evidence that also failed to show a correlation between lower limb strength asymmetry and sprint (Bishop, Read, et al., 2021; Loturco et al., 2019) and COD ability (Bishop et al., 2019; Bishop et al., 2022; Lockie et al., 2012; Loturco et al., 2019) in female and male soccer players.
In some actions, such as sprinting and changing direction, the hamstrings and quadriceps muscles play an important role in the dynamic stabilisation of the knee and hip joints during the deceleration and acceleration phases (Coratella et al., 2018). Furthermore, given the complexity of the running technique, it is hypothesised that, during a maximal sprint, possible limb asymmetry in the strength of the hamstrings and quadriceps muscles may be compensated for by the recruitment of other muscle groups and the execution of compensatory movements (Coratella et al., 2018).
Lockie et al. (2012) investigated the relationship between lower limb strength asymmetry and performance in the 20-meter sprint and a common COD test (T-test) in amateur soccer players. Lower limb strength asymmetry was measured with the aid of an isokinetic dynamometer. The authors observed that, at 60°/s, there were no correlations between limb asymmetry in the PTCON of quadriceps and hamstrings and time in the 20-meter sprint and T-test, which was consistent with the findings of the present study. Furthermore, Lockie et al. (2012) reported that at 180°/s and 240°/s, there were no correlations between limb asymmetry in hamstring PTCON and time in the 20-meter sprint and time in the COD, which was with the results of the present study. However, Lockie et al. (2012) did report a negative correlation between limb asymmetry in quadriceps PTCON at 240°/s and time in the 20-meter sprint and T-test, as well as a negative correlation between quadriceps PTCON at 180°/s, and COD time.
Furthermore, Coratella et al. (2018) investigated the relationship between lower limb strength asymmetry and performance in the 30-meter sprint and COD test (T-test) in professional under-21 soccer players. Lower limb strength asymmetry was measured with the aid of an isokinetic dynamometer. The authors observed that, at 30°/s, there was no correlation between limb asymmetry in PTCON of hamstrings and quadriceps and time in the 30-meter sprint and T-test, which was consistent with the findings of the present study. Additionally, it was observed that, at 300°/s, there was no correlation between limb asymmetry in quadriceps PTCON and time in the 30-meter sprint and T-test, which was consistent with the findings of the present study. However, Coratella et al. (2018) found a positive correlation between limb asymmetry in the PTCON of the hamstrings at 300°/s and time in the 30-meter sprint and T-test.
Furthermore, Bishop, Read, et al. (2021) investigated the relationship between lower limb strength asymmetry and 20-meter sprint performance in young female players from a regional talent centre of a professional football club. Lower limb strength asymmetry was measured through a SLCMJ, single leg hop, triple hop and crossover hop jumps, and the sprint test was performed on a 3G synthetic grass surface. No correlations were observed between lower limb strength asymmetry in single leg hop, triple hop and crossover hop jumps and time in the 20-meter sprint, which was consistent with the findings of the present study. However, a positive correlation was found between lower limb strength asymmetry in the SLCMJ and time in the 20-meter sprint, which indicates that greater lower limb strength asymmetry is associated with slower 20-meter sprint times.
Recently, Loturco et al. (2019) examined the relationship between lower limb strength asymmetry and 20-meter sprint performance and COD ability (zig-zag test) in professional female soccer players. The sprint test was performed on an indoor running track, while the COD test was performed on an indoor court, and lower limb strength asymmetry was measured using the SLCMJ and SLSJ. The authors found no correlation between lower limb strength asymmetry in the SLCMJ and SLSJ and speed in the 20-meter sprint and COD test.
Additionally, Bishop et al. (2019) analysed the relationship between lower limb strength asymmetry and performance in the 30-meter sprint and COD ability (5-0-5 COD test) in professional female soccer players. The sprint and COD tests were performed on a 4G synthetic grass surface, and lower limb strength asymmetry was measured using the SLCMJ and SLDJ. No correlations were found between lower limb strength asymmetry in the SLCMJ and time in the 30-meter sprint and COD test. However, there was a positive correlation between lower limb strength asymmetry in the SLDJ and time in the 30-meter sprint and COD test, which indicated that greater lower limb strength asymmetry was associated with slower 20-meter sprint times.
However, it is important to highlight the different levels of training, populations, tests to measure physical performance, tests to measure lower limb strength asymmetry, environmental conditions and angular velocities used in the present study and the studies by Bishop et al. (2019), Bishop, Read, et al. (2021), Coratella et al. (2018), and Lockie et al. (2012), which may possibly underlie the discrepancies between the results of the present study and the studies cited.
Menzel et al. (2013) postulated that the muscular actions performed during a COD test are distinct from the muscular actions performed in a strength test on an isokinetic dynamometer. Furthermore, it has been conjectured that an asymmetry in lower limb strength may not affect, either positively or negatively, the ability to run at high speed with COD in soccer athletes (Loturco et al., 2019).
The present study found no correlations between limb asymmetry in PTCON of the hamstrings and quadriceps muscles at 60/° and performance in the 20-meter sprint, RAST and COD test. The following hypotheses can possibly justify these results: 1) lower limb strength asymmetry was balanced by performing compensatory movements and recruiting different muscle groups; 2) the neural recruitment patterns were dissimilar between the isokinetic dynamometer, and the 20-meter sprint, RAST and COD test; 3) some variables such as motor coordination and technique execution, not measured in the present study, may have influenced the relationship between lower limb strength asymmetry and physical performance; 4) in professional female soccer players, the strength asymmetry of the lower limbs, regardless of the asymmetry score, does not influence physical performance either positively or negatively.
CONCLUSION
In conclusion, the present study found no correlations between lower limb strength asymmetry and performance in a variety of tests. Therefore, based on such findings, in general, it is speculated that, in professional soccer, the asymmetry in lower limb strength may not influence physical performance sprinting or COD ability.

