


 Inglês (pdf)
 Artigo em XML
 Referências do artigo
 Enviar este artigo por email
 Citado por SciELO
  Similares em
SciELO
Similares em
SciELO 
 Permalink
INTRODUCTION
Age-related issues have become the subject of discussions and studies worldwide, with more significant concern on providing scientificity to the different modalities and models used in physical activities. The World Health Organization recommends that older adults perform at least 150 to 300 min/week of moderate physical activity or 75 to 150 min/week of intense physical activity. However, many of the population do not achieve these goals, and lack of time is often cited as the main barrier to physical activity (Gray et al., 2016). Researchers say that high-intensity interval training (HIIT), which intersperses periods of high-intensity effort with active or passive recovery intervals, is an alternative to traditional continuous moderate-intensity methods and can provide an efficient solution to lack of time, improving general health and fitness. Furthermore, evidence suggests that HIIT induces physiological adaptations similar to conventional training, even with a lower training volume (Gist et al., 2014; McRae et al., 2012) in both clinical indicators (Gist et al., 2014) related to physical fitness. The most commonly investigated forms of HIIT, although they include protocols that vary in the proportion of time between stimulus and recovery, use cyclic exercises performed on an ergometer. However, recently, some studies have proposed using bodyweight exercises in HIIT programs, calling the proposal intensity interval training (HIIT) whole body (McRae et al., 2012) or "HIIT bodywork (Machado et al., 2018a) in translation full-body high-intensity interval training or HIIT with body weight. HIIT with body weight can be characterised as training with a brief period of stimulation followed by a period of recovery. The total time of the training session (Machado et al., 2018b), the type of training session (Machado et al., 2021), the order of movements performed in the session, the recovery time (Machado et al., 2023a), and the type of recovery (Machado et al., 2023b) are training variables that, depending on their manipulation, may generate greater or lesser impact on the training session. Based on the statements above, the objective of the present study was to analyse the effect of HIIT with body weight on strength and functional capacity parameters in older adults.
METHODS
Sixty oler people (15 men and 45 women) from the community centre of José Bonifácio and José Antônio Amêndola from the municipality of Sales/SP participated in the study. As exclusion criteria were recent hospitalization, symptomatic cardiorespiratory disease, hypertension or uncontrolled metabolic syndrome, severe kidney or liver disease; cognitive impairment or progressive and debilitating conditions marked obesity with an inability to exercise; research of bone fractures or any other medical contraindications for the practice of physical exercises.
Experimental design
The participants were randomized into the Training Group (TG= 30) and the Control Group (CG= 30). Before the start of the intervention training, all participants familiarized themselves with the procedures for evaluating preliminary and diagnostic measures. Training began immediately and lasted 12 consecutive weeks, with three weekly sessions. Before the training intervention program, the CG and TG groups signed the informed consent form, responded to a sociodemographic questionnaire, and then carried out a battery of measurements, including anthropometry (body mass and height) and sitting and standing Test five times (5TSTS), 10-meter Walking Speed Test (TVM-10), Timed Up and Go Test (TUG) and 1 repetition maximum (RM) test for upper and lower limbs, and at the end of the training program, they performed the same battery of tests again. The CG maintained their routine daily tasks throughout the study period. Furthermore, this group committed to not performing any systematic physical activity during the 12 weeks. The TG carried out the intervention until the post-test and the control group carried out the same assessments as the training group during the same period, thus considering the pre-and post-test.
Training protocols
The training program consisted of 3 exercise routines (Table 1), carried out in 3 weekly sessions on alternate days, always following the same order of execution of the exercises throughout the 12 weeks of training. The routine for each session consisted of a 5-minute warm-up using exercises from the central part of the training session. The main part lasted 20 minutes of exercise using only body weight, followed by a 5-minute cool-down consisting of stretches for the upper and lower limbs. After classifying the exercises selected for the training program according to the proposal of Machado et al. (2017), the exercises were distributed in the training sessions following the recommendations of Machado et al. (2022), thus characterising three training sessions with different impacts. The exercises were adapted as follows: For the mountain climber, the exercise was performed in a standing position with the hands resting on the wall. A chair was placed for the squat and squat jump so the volunteers could have more security during the movement. The volunteer was allowed to sit down and get up from the chair during the training. Squat trust, the support of the hands was carried out on a chair, and the movement of the legs was carried out independently, that is, one leg at a time. The central part of the training followed the guidelines proposed by Machado et al. (2022), which was 20 minutes long and totalled 20 work cycles. Each work cycle consisted of 30 seconds of stimulation and 30 seconds of passive recovery.
Table 1 Distribution of exercises in training sessions throughout the week.
| A | B | W |
|---|---|---|
| Seal Jack | Seal Jack | Jump Cross Jack |
| Mountain Climber* | Squat jump* | Squat Trust* |
| Squat* | Abdominal rower | Mountain Climber * |
| Abdominal rower | Squat Trust* | Squat jump* |
*Adapted exercise.
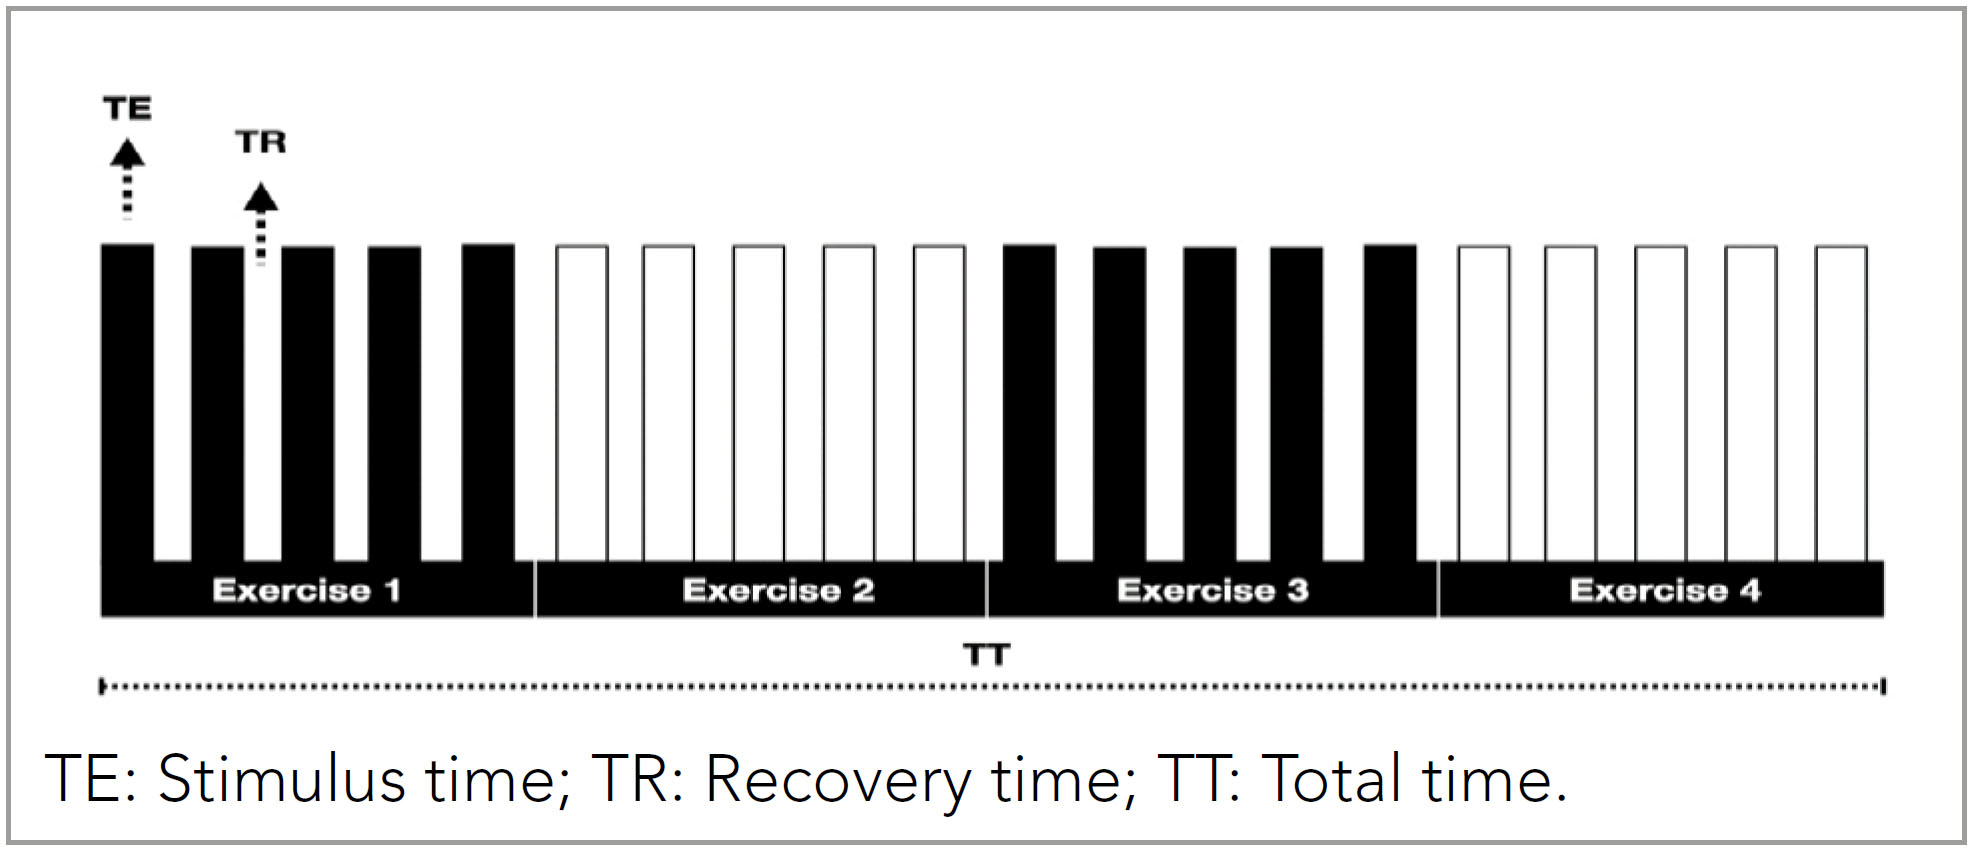
Each exercise was performed in a block structure consisting of 5 cycles, each containing a stimulus period followed by a recovery period, as shown in Figure 1 (Machado et al., 2021). The intensity of the training session was assessed using Borg's (Borg, 1982) scale after each 30-second stimulus.
A sociodemographic questionnaire was applied to obtain the following data: age, sex, ethnicity, education, and family income. Right away, Body mass and height were measured. The participant is weighed barefoot and in physical activity clothes, standing in the central part of the platform of the Welmy® brand, model W200 A, Brazil. The same standard mentioned above is used to measure height with an aluminium stadiometer, Sanny® model ES2030, Brazil, standing upright, arms extended along the body, feet together, in inspiratory apnea, with the head oriented, according to the Frankfurt plane.
Procedures
Five times sit-to-stand test
The sit-down and stand-up tests were performed five times to check muscle power. The test consisted of getting up and sitting on a chair as quickly as possible, with arms crossed in front of the body, 5 times. The timer was started when the participant raised their hips from the chair and stopped at the end of the fifth movement.
10-Meter walking speed test
To verify physical mobility and usual gait speed, the 10m walk test was used, measuring the time spent travelling this distance. Considering aspects of acceleration and deceleration, participants were asked to start walking 1.2 m before the start of the route and finish 1.2 m after 10 meters. Three attempts were made, and the average of the values obtained was computed (Novaes et al., 2011).
Timed up and go test
Agility, dynamic balance, speed, and mobility were assessed using the Timed Up and Go test (TUG). The test was carried out on a straight, flat, and well-lit path and consisted of getting up from a chair without the help of arms and walking at a comfortable and safe pace for a distance of three meters, turning around, returning, and sitting down. When starting the test, the participant remained with her back resting on the back of the chair and must return to this position at the end of the test. Timing started when the participant stood up and stopped when the participant came into contact with the back of the chair.
Test one repetition maximum
Initially, a familiarisation session was held to teach the correct exercise technique and allow participants to become accustomed to the test procedures. The 1RM test was performed in different exercises. To determine the maximum strength of the upper limbs, elbow flexion and extension were performed using the W bar, and the strength of the lower limbs was used with the 45° leg press (NakaGym).
Participants performed repetitions with increasing weights until they could not complete a repetition with proper technique, with the highest weight successfully lifted recorded as the 1RM. After this phase, the protocol consisted of a 5 to 10 repetitions warm-up and a weight between 40 and 60% of the estimated 1RM. Subsequently, 3 to 5 attempts were made to estimate the maximum load, with an increase of 5 to 10% for upper limbs and 10 to 20% for lower limbs. A 5-minute break was given for each attempt (Levinger et al., 2009). To reduce the margin of error, older people were familiarised with the tests, and the following strategies were subsequently adopted: standardised instructions were provided before the Test so that the person being evaluated was aware of the entire routine involved in data collection and guided about the technique for performing the exercise. After the training period, both groups repeated the Test (Levinger et al., 2009; Ribeiro et al., 2014; Sánchez-Medina et al., 2017).
Statistical analysis
To calculate the size of the sample group, G*Power 3.1.9.4 was used for a sample effect (1-ß of 0.8 and α - 0.05), determining a minimum sample of 45 participants. The Shapiro-Wilk test was used to verify the normality of sample distribution, and the Levene test verified the homogeneity of variances. The mean, standard deviation, and confidence interval were calculated after confirming the normality of the data. Repeated measures analysis of variance ANOVA was used to compare the variables: body mass, BMI, TUG, 5TSTS, TVM-10, and 1RM, and time effects (pre versus post-training program) between the CG and TG. The Bonferroni post-hoc test was used to determine significant differences when p≤0.05. The effect size was estimated using eta squared (ŋ2p); < 0.06, 0.06 to 0.14, and > 0.14 indicate small, medium, and large effects, respectively.
RESULTS
All bodyweight training program participants completed at least 95% of training sessions during the intervention period. Table 2 shows the pre-test anthropometric data of the study participants.
Table 2 Anthropometric assessment before and after the intervention for training and control groups.
| Training Group | Control Group | |||
|---|---|---|---|---|
| N= 30 (68.73± 5.52 age) | N= 30 (68.73± 5.91 age) | |||
| Variables | moment | Moment | ||
| Pre | Post | Pre | Post | |
| Weight (kg) | 69.03± 13.84 | 69.47± 13.45 | 70.33± 12.71 | 70.98± 12.74 |
| Height (cm) | 161± 0.67 | 161± 0.067 | 160± 0.06 | 160± 0.06 |
| BMI (kg/m2) | 26.18± 4.45 | 26.55± 4.07 | 27.02± 2.87 | 27.56± 3.71 |
Table 3 presents sociodemographic data based on the total number of participants in this study to characterise the sample. To minimise possible noise in the results regarding anthropometric characteristics and functional similarity regarding the study's diagnostic variables before the intervention, the participants were evaluated and showed no significant differences (p≥ .05) between the control and bodyweight training groups. For the pre-and post-intervention moments between the groups analysed, a significant difference for the training group was found for the TUG (p= .0001) and the TSLC-5x test (p= .009), as shown in Table 4.
Table 3 Sociodemographic data of older adults (N= 60).
| Variable | N | % | |
|---|---|---|---|
| Sex | Feminine | 45 | 75 |
| Masculine | 15 | 25 | |
| Race /colour | Black | 5 | 8.33 |
| Brown | 13 | 21.67 | |
| White | 42 | 70 | |
| Education | Incomplete elementary education | 28 | 46.67 |
| Complete primary education | 4 | 6.67 | |
| Incomplete high school | 10 | 16.67 | |
| Incomplete high school | 5 | 8.33 | |
| Complete higher education | 8 | 13.33 | |
| Complete higher education | 5 | 8.33 | |
| Monthly Family Income | 1 to 5 minimum wages | 59 | 98.33 |
| 6 to 10 minimum wages | 1 | 1.67 | |
No: absolute number.
Table 4 Mean, the standard deviation of the groups, confidence interval for the difference between pre and post-measurements between groups, ANOVA for time and time versus group interaction.
| PRE | POST | 95%CI | ANOVA | |||||
|---|---|---|---|---|---|---|---|---|
| Time effect | Time x group effect | |||||||
| F | Ŋ2 | F | P | Ŋ2 | ||||
| WEIGHT | 0.53 | 0.0001 | 0.002 | 0.96 | 0.0001 | |||
| CG | 70.33± 11.65 | 70.98± 12.74 | -2.42–1.12 | |||||
| TG | 69.03± 11.65 | 69.47± 13.45 | -3.55–2.67 | |||||
| BMI | 0.30 | 0.003 | 0.0001 | 0.99 | 0.0001 | |||
| CG | 27.02± 2.87 | 27.41± 3.69 | -2.52–0.44 | |||||
| TG | 26.18± 4.45 | 26.55± 4.07 | -1.37–0.61 | |||||
| TUG | 14.08 | 0.10 † | 0.41 | 0.52 | 0.004 | |||
| CG | 8.65± 2.78 | 7.43± 2.83 | 0.47–1.96 | |||||
| TG | 8.44± 2.07 | 6.71± 1.74* | 1.08–2.36 | |||||
| 5TSTS | 7.07 | 0.057 † | 0.309 | 0.57 | 0.003 | |||
| CG | 9.93± 3.05 | 9.05± 2.55 | 0.28–1.47 | |||||
| TG | 9.18± 1.52 | 7.84± 1.67* | 0.78–1.95 | |||||
| TVM-10M | 0.005 | 0.0001 | 1.52 | 0.22 | 0.013 | |||
| CG | 8.67± 2.23 | 10.37± 13.83 | -2.92–2.07 | |||||
| TG | 8.67± 2.15 | 7.17± 1.17* | 0.82–2.19 | |||||
| 1RMLP | 2.54 | 0.021 † | 2.87 | 0.93 | 0.024 † | |||
| CG | 90.73± 31.06 | 89.96± 28.97 | -3.93–5.46 | |||||
| TG | 88.75± 46.55 | 113.95± 55.38 | -35.63–-14.73 | |||||
| 1RMEF | 4.32 | 0.036 | 3.66 | 0.05* | 0.031 † | |||
| CG | 20.51± 5.35 | 20.70± 5.34 | -0.93–0.57 | |||||
| TG | 20.13± 7.03 | 24.56± 6.41* | -7.08–-1.77 | |||||
Values expressed as average standard deviation for the control (CG) and training (TG) groups.
*statistically significant difference (p≤ 0.05) between CG and TG; Moderate interaction in effect size (0.06 to 0.14). BMI, body mass index; 1RMLP: maximum repetition test on the leg press; 1RMEF: maximum repetition test in the elbow flexion exercise, 5TSTS: sitting and standing Test five times; TUG: time up and go Test; TVM-10: 10-meter Walking Speed Test; Weight, body mass.
DISCUSSION
The data presented demonstrate that most older people evaluated participating in the intervention program were between 63 and 74 years old. Younger older people participate more frequently in physical exercise programs than older people because, in general, they have better physical performance and fewer comorbidities.
According to the results, most physical activity practitioners in the training group are women. Among the reasons for the greater demand for physical exercise programs by older women, the main one is the most significant health concern, followed by socialization, leisure, well-being, and medical order, in addition to more significant concern with body balance and aesthetics, and a greater likelihood of following restrictive diets combined with exercise.
The prevalence of white race/colour in participation in physical activities according to the study in question was also verified in the study by Chiconato et al. (2022), where black and brown women were less active compared to white women, unlike data commonly found in studies where brown race/colour is predominant, as this is the majority in Brazil, justified by miscegenation due to colonization.
A justification for a higher percentage of white people in this study can be attributed to where the intervention was carried out, which concentrates many individuals of white race. Despite the importance of using the variable race/colour in research on health and physical activity, the lack of a conceptual explanation that justifies its use as a relevant and helpful concept in this area of knowledge, as well as the lack of standardisation or greater consensus in the forms of stratification of this variable can produce inconsistent results, as well as reducing the possibilities for comparative studies.
Concerning education, the prevalence was among older people with only incomplete primary education, which does not interfere with adherence to physical exercise, as observed in the study by (Duarte et al., 2020), where the low level of education of older people was not an obstacle to regular physical activity. Relating income and the practice of physical activity, it was observed in the present study that people earning 1 to 5 minimum wages are more prevalent than others.
However, a survey by Rodrigues et al. (2017) reports that high-income people have the privilege of carrying out physical activities during leisure time; on the other hand, those with lower incomes appear more vulnerable to a higher level of professional, physical activity, and commuting.
Regarding the results of this study's intervention, it is worth considering that physical activity and sedentary behaviour are closely related but distinct. Each presents independent determinants for adverse results, such as functional disability and movement dependence. The degree to which sedentary behaviour is associated with decreased muscle strength and power (Beaudart et al., 2019) that decrease with chronological age (Chodzko Zajko et al., 2009) are not only functionally significant, but they are also crucial determinants for improving the functional fitness of older people.
The results of the present study demonstrate an interaction between all variables measured in the present study, which corroborates (Adams et al., 2023) when emphasizing the interconnection of these tests, suggesting that combined assessments could better predict functional decline and guide interventions assisting in the development of effective strategies to improve overall mobility and reduce the risk of falls.
The strength of the lower limbs directly influences the ability to perform tasks involving balance, lifting, and walking (Aartolahti et al., 2020), which justifies the interaction between the improvement of variables through HIIT bodywork in the present study.
The strength of the upper limbs may not directly impact the variables mentioned above. However, it acts on postural stability, facilitates daily activities (Golubić et al., 2021), and is essential for the person's general capacity for functionality and independence for older people.
The present study presents a significant difference between the control and training groups for the strength variable. However, the means are similar for both groups, presenting a low probability, which distances the results from the null hypothesis for the IRMEF variable.
This data is relevant as it shows us that there was little change in strength in the training group, which the adapted HIIT bodywork protocol exercises can explain (Machado et al., 2018b). Although HIIT is an effective method for promoting physical activity gains, the extent of the benefit depends on the quality and quantity of the training stimuli (McRae et al., 2012).
Thus, moving from a sedentary behaviour to an active one improves the execution of daily life tasks and the instrumental tasks involved in the older person's daily life. Another point to be discussed about the results, especially about the training used in the study intervention, HIIT with body weight, whose data demonstrate an improvement in the functional capacity of older people, is that healthy lifestyles are more likely to live independently and incur fewer health-related costs (Hoefelmann et al., 2011; Snowsill et al., 2022).
According to global positions, functional disorders and imbalances in the variables of the locomotor system function are the leading causes of deficiency in the performance of gait, balance, and muscle strength, affecting the functional capacity of the older person. The present study verified the effects of HIIT with body weight on the variables of muscle power and strength, physical mobility, agility, dynamic balance, and usual gait speed in sedentary older people. The first point to be discussed is the efficiency of the type of training in the variables studied.
A systematic review with meta-analysis by Wu et al. (2021) showed that HIIT induces favourable adaptations in physical fitness and muscular power in older people. The same author also states that 5 studies compared the changes in the TUG and the chair test in older people who presented significantly lower values after the intervention with HIIT compared to the control group, corroborating the present study.
It is worth noting that a reduction in TUG time of 0.8 to 1.4 seconds is already sufficient for a clinically significant improvement in the physical function of the older person (Arnold & Faulkner, 2007) and to improve the risk of falling. TUG, induced by HIIT with body weight in the present study, was reduced by (8.44± 2.07–6.71± 1.74), as shown in Table 3.
Werner et al. (2019) state that HIIT can increase the muscular power and strength of the upper and lower limbs, significantly impacting older adults’ functional capacity and physical fitness.
The present study found no significant difference in maximum muscular strength between the groups analyzed. However, a solid intra- and inter-group interaction shows the method's applicability for the variables studied. In a study on the muscular system and motor performance in ageing, Hunter et al. (2016) state that motor performance decreases with advancing age and accelerates at very advanced ages, involving weaker, slower, less powerful, less stable, and more fatigued muscles during high-speed dynamic tasks, which justifies the results found for maximum muscle strength since study participants were sedentary.
An essential fact of the deleterious effects of ageing on age-related muscular strength performance is the significant variability of aspects such as strength, speed, fatigability, and primary muscular demand for movement performance (Reid & Fielding, 2012), which increases with age. Ageing leads to low levels of motor performance (Hunter et al., 2016). The decrease in muscle force production can be attributed to well-described muscle quantity and quality changes.
A contribution to clinical evolution and significant improvements in sitting and rising from a chair test is related to the improvement in functional performance. In a meta-analysis (Ramsey et al., 2021), they verified the relationship between physical exercise and sedentary behaviour on muscle strength and power in older people.
Based on objective measurements of the variables muscle strength and power, their conclusions establish that a more significant amount of physical activity and less sedentary behaviour lead to greater muscle mass, strength, and muscle power, particularly with the sit-to-stand-from-chair Test, which justifies the significant difference found in the sit-to-stand-from-chair test.
Although HIIT is a safe and effective method for improving physical fitness (Coratella & Schena, 2016) and clinical indicators (Shaban et al., 2014), according to Scoubeau et al. (2022), the method can be applied to different populations and ages. There are no reports in the literature on bodyweight HIIT intervention models in older people.
The few studies available in the literature on bodyweight HIIT observed total training session time (Machado et al., 2018a; McRae et al., 2012), training frequency per week (Machado et al., 2018b), increased conditioning Schaun et al., 2018); increased neuromuscular capacity (McRae et al., 2012) energetic cost of the session (Machado et al., 2020); different types of training (Machado et al., 2021); different exercise orders in the training session (Machado et al., 2022); different recovery times (Machado et al., 2023a), different types of recovery (Machado et al., 2023b) and perception of pleasure in the training session.
However, none of the studies mentioned were conducted with a sample of older people. According to Machado et al. (2018a), bodyweight training is easy to implement and has a low cost, which can be a strategy for implementing the practice in centres for the elderly, such as the sample in the present study. However, there is a need to adapt the exercises for the elderly population to generate less impact and provide more excellent safety when executing the movements.
A study proposed by Machado et al. (2022) observed the behaviour of training session variables in different exercise distributions within the training session and observed significant results for different exercise organisations within the session, which is in line with the distribution of exercises proposed in this study, as well as adaptations in movements to preserve the safety of volunteers. The exercises selected for the training program can be directly related to the results presented here due to the specificity of the movement with the TUG and TSLC tests.
It is concluded that HIIT with body weight improves the functional capacity and strength of the lower and upper limbs, impacting the performance of instrumental activities of daily living and gait performance, generating autonomy and independence of movements, and providing critical clinical improvements for periods of longer and healthier lives.

