




 Inglês (pdf)
 Artigo em XML
 Referências do artigo
 Tradução automática
 Enviar este artigo por email
 Citado por SciELO
  Similares em
SciELO
Similares em
SciELO 
 Permalink

INTRODUCTION
Athletes test the limits of human speed and power in the thrilling world of fast-track sports sprints, leaving spectators in awe of their rapid feats (Feilich, 2015). The 100 m sprint in the Olympics and World Championships has a particular place in the hearts of sports fans all around the world (Davis, 2012). The 100 m sprint is the pinnacle of explosive athleticism, requiring an individual combination of power, speed, and technique (Moura et al., 2023). While traditional wisdom credits sprinting success to training regimens and skill development, current advances in sports science suggest that a deeper understanding of an athlete’s body composition may hold the key to unlocking new levels of performance (Majumdar & Robergs, 2011). At the core of the investigation is the realization that success in the 100 m sprint is dictated not just by raw speed, but also by the complex balance of an athlete’s body composition. The explosive strength necessary for quick acceleration and the capacity to maintain maximum speed over a short distance are inextricably tied to an athlete’s individual physiological composition (Furrer et al., 2023). The interplay between body composition and performance in 100 m sprinting is an intriguing field of research that offers insight into the complex link between physical attributes and athletic ability.
Maintaining optimal body composition is crucial for athletes to enhance performance and reduce the risk of injuries (Sundgot-Borgen et al., 2013). The non-fat, lean tissues of the appendicular skeleton, which include the bones and muscles of the limbs such as the shoulder girdle, arms, pelvic girdle, and legs, are referred to as appendicular lean mass (ALM). The measurement of ALM is crucial, particularly in research or evaluations pertaining to physical performance, strength, and mobility, since the muscles of the appendicular skeleton play a major role in an individual’s total strength and functional ability (Hassan et al., 2022). Monitoring ALM is particularly relevant in sports science, rehabilitation, and studies examining the impact of physical activity on the musculoskeletal system (Gallagher et al., 1997; Ito et al., 2021). Body fat mass (BFM) contributes to overall body composition and creates an optimal balance that is crucial for maintaining energy reserves and hormonal regulation (Loucks, 2004). It is proven that the most powerful sprinters have great muscular mass and little body fat (Maughan et al., 1983). Skeletal muscle mass (SMM), particularly in the appendicular skeleton, plays a crucial role in providing the structural foundation for powerful limb movements essential in sprinting (Hart et al., 2020; Tabassum & Azim, 2024).
Peak performance in the 100 m sprint is a complicated journey that goes beyond basic speed. Coaches seek to delve into the intricate dynamics of kinetic variables that underpin the sprinting prowess of collegiate athletes. Beyond the surface-level spectacle of athletes speeding towards the finish line, the fundamental heart of their performances resides in the kinetic details that characterize them. The measure that embodies the very core of speed in this scorching rush from start to finish is velocity, which is the swiftness of an item in a given direction. When athletes explode out of the blocks, the velocity they achieve during the acceleration phase establishes the foundation for their total performance (Bezodis et al., 2019). The ability to rapidly increase speed from the starting blocks is essential for achieving top-end velocity and overall race performance (Pandy et al., 2021). As these sprinters navigate the fast track, there is a relationship between body composition and the kinetic elements that drive their success.
A substantial number of studies are available in the literature on the influence of various body-composition parameters on the performance of fast-track athletes. Correlations between 100 m sprinters’ performance and their anthropometric body compositions were reported by (Barbieri et al., 2017; Deshmukh & Chamle, 2014; Nuell et al., 2019; Ozimek et al., 2021; Simoes et al., 2017). These studies included sprinters’ body size. Stachón et al. (2023) and Arazi et al. (2015) explored anthropometric variables and body composition in academic athletes, sprinters, middle-distance runners, and long-distance runners. Several research groups (e.g., Bret et al., 2002; Dengel et al., 2020; Durkalec-Michalski et al., 2016; Sugisaki et al., 2018; Torok et al., 1995) have investigated additional components, including nutrition, bone mineral density, cardiovascular responses, muscle volumes, and leg strength. Kinematical analyses and body composition of 100 m sprinters were reported by Ghosh and Bhowmick (2018) and Šolaja et al. (2017).
Bangladeshi sports symbolize Bangladesh’s culture and tradition (Sarma et al., 2021). The 100 m sprint stands out as a beacon of athletic excellence in Bangladesh’s vibrant tapestry, where the spirit of sports intertwines with national pride. However, there is limited research on the impact of body composition on the performance of Bangladeshi sprinters, both experimentally and theoretically. Around a decade ago, Anup et al. (2014) conducted research on the anthropometric characteristics in the sport performance of Bangladeshi national-level athletes in relation to their sport performance. The university-level 100 m sprint serves as a platform for prospective athletes to hone their talents, demonstrate their abilities, and contribute to the rich fabric of collegiate sports environment (Murdock et al., 2016; Reifsteck et al., 2021). To the best of our knowledge, this is the first study in Bangladesh to examine the body composition parameters and performance in university-level 100 m sprinters. The project aims to provide a more detailed understanding of how various body composition parameters affect athletes’ performance, with the ultimate goal of enhancing their competitiveness at both national and international levels. The findings have the potential to inform specific training and conditioning regimens, allowing these sprinters to perform at their peak levels
METHODS
Participants
In total, eight university-level sprinters (five of them were male and three female) were carefully selected to participate in this study. All of the competitors established their competence in the 100 m sprint by actively participating in sprints for at least four years, and they competed in the Bangladesh Inter University Athletic Championship twice, with the team winning the title in 2022. The Declaration of Helsinki was followed throughout the study, and written consent was obtained from all the participants. Each participant was interviewed face-to-face. Semi-structured questionnaires (Azim et al., 2024) were used to collect general information about the participants, including their socioeconomic level, educational background, housing situation, family information, medical history, dietary habits, and other relevant details.
Measurement of body composition
Body composition analysers (InBCA, IN-F500, Shenzhen) were employed to assess the subjects’ height, weight, fat mass (FM), muscle mass (MM), ALM, lean body mass (LBM), and skeletal muscle mass (SMM). The analyser makes use of the Bioelectrical Impedance Analysis (BIA) (Collins et al., 2022) approach, a gold standard method. A low-level electrical current is passed through the body, and the analyser measures the impedance (resistance) to the current flow. It also provides segmental muscle and fat distribution in areas like the arm, leg and trunk. All participants were requested to attend the measuring room in minimal clothing, and to avoid heavy food and extensive exercise 3 to 4 hours prior to measurement. It took 30 minutes to complete the measurement.
Performance assessment
The performance measurements of the participants have been reported in Hossain et al. (2024). The official 100 m sprint was used to judge their performance. The time it took to cross multiple 10 m segments inside the 100 m sprint was the key statistic assessed in performance measurement. After a thorough warm-up, the athletes gave maximum effort in the three trials. Each 10 m sector was painstakingly timed by two independent timekeepers using manual stopwatches. The final statistics included the best time from the three trials. Subsequent computations provided valuable insights into zonal time and zonal velocity, revealing the subtle kinematic aspects impacting sprint performance.
Statistical analysis
Analysis of data examined total and segmental body composition characteristics. The normal distribution of the data was checked using the Shapiro-Wilk test. An independent sample t-test was performed with the absolute mean difference between male and female sprinters presented with 95% confidence intervals (CI). Using an ES calculator, effect sizes (ES) and 95%CI (lower limit: upper limit) were generated to determine the extent of the difference between the meaning of the two groups (Lenhard & Lenhard, 2022). These ES values have the following thresholds: 0.2 (trivial), 0.6 (minor), 1.2 (moderate), 2.0 (large), 4.0 (very big), and > 4.0 (extremely large) (Hopkins et al., 2009). The Pearson correlation coefficient was used to evaluate the association between the variables of the combined data. All statistical analyses for this study were conducted using the SPSS (IBM Corp. Version 25.0) program. Descriptive data were calculated as mean ± SD, categorised by sex.
RESULTS
Physical characteristics
Table 1 displays the physical features of the eight individuals, comprising five males and three females, across several parameters such as age, height, body mass index (BMI), basal metabolic rate (BMR), waist to hip ratio (WHR), systolic blood pressure (SBP) and diastolic blood pressure (DBP). These metrics indicate considerable disparities. As in Table 1, the average age for males was 21.8 years, while for females it was 22.33 years. Male individuals exhibited a substantially higher average height (165.54 cm vs. 158.10 cm, p = .044) and weight (58.08 kg vs. 46.73 kg, p = .015) in comparison to female individuals. Nevertheless, there were no notable differences observed in BMI (21.22 for males compared to 18.77 for females, p = .124) or WHR (0.80 for males versus 0.73 for females, p = .184). The mean BMR was substantially greater in males (1430 kcal) compared to females (1119 kcal, p = .002). There was no significant difference in blood pressure readings across genders. The SBP was 112 mm Hg for males and 106 mm Hg for females (p = .383), while the DBP was 64 mm Hg for males and 70 mm Hg for females (p = .423).
Table 1. Physical characteristics of the participants, n = 8.
| Sub ID | Sex | Age (years) | Height (cm) | Weight (kg) | BMI | BMR (kCal) | WHR | SBP | DBP |
|---|---|---|---|---|---|---|---|---|---|
| 1 | M | 22 | 165.1 | 49 | 18 | 1270 | 0.8 | 116 | 63 |
| 2 | M | 21 | 166.3 | 63.8 | 23.1 | 1537 | 0.8 | 110 | 58 |
| 3 | M | 22 | 162 | 58.7 | 22.4 | 1413 | 0.8 | 117 | 65 |
| 4 | M | 21 | 167.2 | 57.5 | 20.6 | 1447 | 0.8 | 112 | 65 |
| 5 | M | 23 | 167.1 | 61.4 | 22 | 1483 | 0.8 | 107 | 69 |
| 6 | F | 24 | 152.7 | 47 | 20.2 | 1083 | 0.8 | 112 | 63 |
| 7 | F | 20 | 164.9 | 46.6 | 17.1 | 1163 | 0.7 | 93 | 65 |
| 8 | F | 23 | 156.7 | 46.6 | 19 | 1111 | 0.7 | 112 | 83 |
| Mean | M | 21.8 | 165.54 | 58.08 | 21.22 | 1430 | 0.80 | 112 | 64 |
| Mean | F | 22.33 | 158.10 | 46.73 | 18.77 | 1119 | 0.73 | 106 | 70 |
| p-value | .616 | .044 | .015 | .124 | .002 | .184 | .383 | .423 |
M: masculine; F: feminine; BMI: body mass index; BMR: basal metabolic rate; WHR: waist to hip ratio; SBP: systolic blood pressure; DBP: diastolic blood pressure.
*SBP and DBP were measured in mm Hg.
Body composition components
Table 2 illustrates the body composition parameters of the subjects classified by gender. As evident in this table, the average value of ALM was considerably greater in males (22.72 kg) than in females (15.37 kg, p = .004) with a substantial effect size (ES) of 3.35. Male individuals demonstrated a considerably higher SMM of 26.32 kg, in contrast to 18.67 kg in females (p = .001, ES = -4.07). Although females had a larger BFM of 9.60 kg compared to males of 8.36 kg, this disparity did not attain statistical significance (p = .551). In males, both MM and LBM were considerably greater compared to females. Males had an average MM of 47.40 kg, while females had an average MM of 35.10 kg (p = .001, ES = -0.60). Similarly, males had a mean LBM of 49.72 kg, while females had a mean LBM of 37.13 kg (p = .001, ES = -4.95).
Table 2. Particular-body compositions characteristics by sex, n = 8.
| Sub ID | Sex | ALM (kg) | SMM (kg) | BFM (kg) | MM (kg) | LBM (kg) |
|---|---|---|---|---|---|---|
| 1 | M | 18.4 | 22.9 | 3.7 | 42.4 | 45.3 |
| 2 | M | 23.8 | 27.4 | 11.2 | 50.7 | 52.6 |
| 3 | M | 22.4 | 25.6 | 9.9 | 46.7 | 48.8 |
| 4 | M | 23.4 | 27.1 | 9.8 | 48.0 | 50.3 |
| 5 | M | 25.6 | 28.6 | 7.2 | 49.2 | 51.6 |
| 6 | F | 15.0 | 17.7 | 11.4 | 33.7 | 35.6 |
| 7 | F | 15.4 | 19.7 | 7.5 | 36.7 | 39.1 |
| 8 | F | 15.7 | 18.6 | 9.9 | 34.9 | 36.7 |
| Mean | M | 22.72 | 26.32 | 8.36 | 47.40 | 49.72 |
| Mean | F | 15.37 | 18.67 | 9.60 | 35.10 | 37.13 |
| p-value | .004 | .001 | .551 | .001 | .001 | |
| *ES | -3.35 | -4.07 | -3.14 | -0.60 | -4.95 |
ES: effect size; M: masculine; F: feminine; ALM: appendicular lean mass; SMM: skeletal muscle mass; BFM: body fat mass; MM: muscle mass; LBM: lean body mass.
*ES was evaluated at ± 95%CI.
With the emphasis on muscle mass and fat mass, Table 3 shows the segmental body composition features of the participants. Male individuals demonstrated a notably greater amount of muscle mass in both their upper and lower extremities in comparison to female individuals. Males exhibited significantly greater muscle mass in the right arm (RA MM: 2.62 kg vs. 1.63 kg, p = .001), right leg (RL MM: 8.82 kg vs. 5.80 kg, p = .005), left arm (LA MM: 2.5 kg vs. 1.50 kg, p = .001), and left leg (LL MM: 8.78 kg vs. 6.43 kg, p = .017) in comparison to females. The trunk muscle mass (TR MM) was greater in males (20.56 kg) compared to females (19.10 kg), although this difference did not reach statistical significance (p = .174). The study found that there were no significant differences in FM between sexes in most body segments. Specifically, there were no statistically significant differences in right arm FM (RA FM) and right leg FM (RL FM). M), left arm FM (LA FM), and left leg FM (LL FM), as indicated by p-values ranging from .36 to .64. Nevertheless, the effect sizes for muscle mass in the arms and legs indicate substantial disparities between genders, with males exhibiting significantly higher muscle mass in these areas.
Table 3. Segmental-body composition characteristics measured in kg, n = 8.
| ID | RA MM | RA FM | RL MM | RL FM | LA MM | LA FM | LL MM | LL FM | TR MM | TR FM |
|---|---|---|---|---|---|---|---|---|---|---|
| 1 | 2.3 | 0.2 | 7 | 0.6 | 2.1 | 0.3 | 7 | 0.6 | 23 | 2 |
| 2 | 2.9 | 0.8 | 9.9 | 1.8 | 2.8 | 0.8 | 10 | 1.8 | 19.9 | 5.9 |
| 3 | 2.6 | 0.7 | 8.7 | 1.6 | 2.5 | 0.7 | 8.6 | 1.6 | 19.6 | 5.2 |
| 4 | 2.6 | 0.5 | 9.2 | 1.2 | 2.5 | 0.5 | 9.1 | 1.2 | 19.8 | 3.8 |
| 5 | 2.7 | 0.7 | 9.3 | 1.6 | 2.6 | 0.7 | 9.2 | 1.6 | 20.5 | 5.2 |
| 6 | 1.5 | 0.8 | 6 | 1.9 | 1.5 | 0.8 | 6 | 1.9 | 18.6 | 6 |
| 7 | 1.6 | 0.5 | 5.2 | 1 | 1.4 | 0.5 | 7.2 | 1 | 20.3 | 4 |
| 8 | 1.8 | 0.7 | 6.2 | 1.7 | 1.6 | 0.7 | 6.1 | 1.7 | 18.4 | 5.2 |
| Mean (M) | 2.62 | 0.58 | 8.82 | 1.4 | 2.5 | 0.6 | 8.78 | 1.36 | 20.56 | 4.42 |
| Mean (F) | 1.63 | 0.67 | 5.80 | 1.67 | 1.50 | 0.67 | 6.43 | 1.53 | 19.10 | 5.07 |
| p-value | .001 | .599 | .005 | .436 | .001 | .64 | .017 | .636 | .174 | .549 |
| ES | -4.97 | 0.42 | -3.18 | 0.62 | -4.71 | 0.38 | -2.39 | 0.36 | -1.12 | 0.47 |
M: masculine; F: feminine; RA: right arm; MM: muscle mass; RL: right leg; FM: fat mass; LA: left arm; LL: left leg; TR: trunk; ES: effect size (evaluated at ± 95%CI).
Performance analysis
Table 4 presents a concise overview of the 100 m sprint performance of the participants in this study. It focuses on important measurements such as the duration of the first 10 meters, the fastest rate of acceleration, the highest velocity achieved, the decrease in velocity at the finish line, and the overall time taken to complete the sprint. As evident in Table 4, male participants had superior performance in the first 10 meters, with an average time between 1.92 and 2.05 seconds. In contrast, female participants took longer, with their average time ranging from 2.26 to 2.36 seconds. Men exhibited greater values for both maximum acceleration and maximum velocity compared to females. The range of acceleration for men was between 4.76 and 5.43 ms−2, while the range of velocity was between 10.64 and 13.33 ms−1.
Table 4. Performance in 100 m sprint of present study subjects.
| ID | Sex | Time taken for 1st 10 m (sec) | Maximum acceleration (ms−2) | Maximum velocity (ms−1) | Velocity loss at finish (%) | Total time taken (sec) |
|---|---|---|---|---|---|---|
| 1 | M | 2.05 | 4.76 | 11.11 | 34.74 | 12.41 |
| 2 | M | 1.97 | 5.15 | 13.33 | 44.86 | 12.39 |
| 3 | M | 1.97 | 5.15 | 10.99 | 28.94 | 12.35 |
| 4 | M | 1.95 | 5.26 | 11.36 | 31.77 | 12.26 |
| 5 | M | 1.92 | 5.43 | 10.64 | 12.97 | 12.11 |
| 6 | F | 2.28 | 3.85 | 9.71 | 8.03 | 15.37 |
| 7 | F | 2.36 | 3.59 | 8.77 | 12.31 | 16.52 |
| 8 | F | 2.26 | 3.92 | 8.70 | 7.36 | 16.02 |
M: masculine; F: feminine.
Source: Hossain et al., 2024.
In contrast, females had a lower range of acceleration, ranging from 3.59 to 3.92 ms−2, and a lower range of velocity, ranging from 8.70 to 9.71 ms−1. Male individuals exhibited a greater degree of velocity loss at the end, with a range of 12.97 to 44.86%, whereas females showed a lesser velocity loss, ranging from 7.36 to 12.31%. Males completed the 100 m sprint in a shorter time, with a range of 12.11 to 12.41 seconds, compared to girls, whose performance time ranged from 15.37 to 16.52 seconds.
Correlation analysis
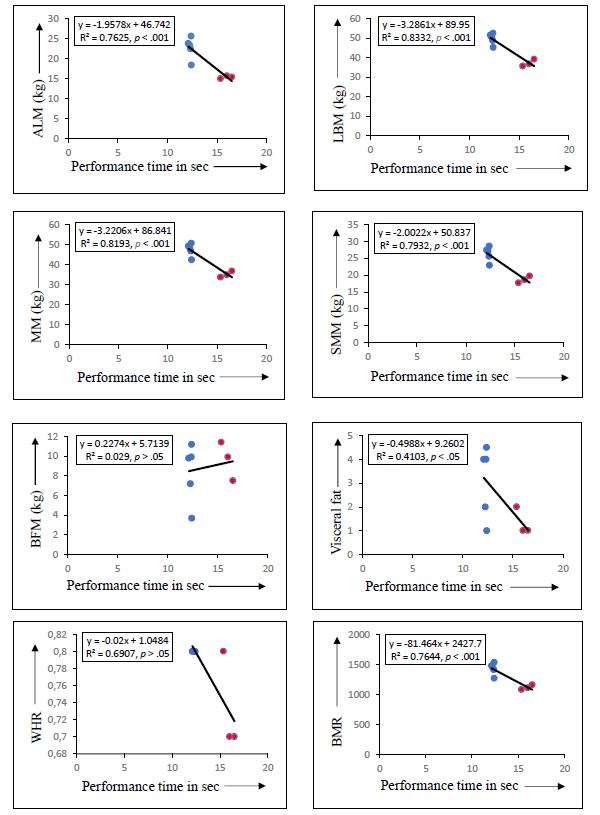
The data presents the association between sprinters performance timing and body composition elements at significant levels (Figure 1). Body composition components correlated strongly with ALM (R2 = 0.7625, p < .001), LBM (R2 = 0.8332, p < .001), MM (R2 = 0.8193, p < .001), SMM (R2 = 0.7932, p < .001) and BMR (R2 = 0.7644, p < .001), respectively. Although there was a little relationship, no significance was found in BFM (R2 = 0.029, p > .05) and WHR (R2 = 0.6907, p > .05) in the case of both sprinters.
DISCUSSION
There have been no studies that have looked at body composition among fast track university athletes in Bangladesh. Numerous studies have been conducted around the world to examine the anthropometric characteristics of sprinters. However, the majority of these studies lacked a large enough sample size to evaluate body composition by both 100 m sprint and gender (Nuell et al., 2019). Although Hirsch et al. (2016) divided collegiate track and field athletes by event (e.g., sprinters, middle distance runners, jumpers, multi-event athletes, throwers, javelin throwers, pole vaulters), these researchers did not separate the events by gender nor made any associations between body composition and performance level.
In this study, we examined the body composition and performance of male and female 100 m sprinters as well as the link between body composition components and sprint performance. The key findings were that: 1) males had higher ALM, LBM, MM, BMR, WHR and SMM but lower BFM; 2) In segmental analysis, males had more muscles in all regions, but females had more fat mass in their segmental section; 3) A substantial association was detected in all body composition components except BFM; 4) We have done performance analysis factor like acceleration, velocity, loss of velocity and 100 m sprint time of participants.
The body composition analysis indicated significant gender disparities across multiple parameters, as described in Table 2. Males had significantly larger ALM, SMM, MM and LBM than females, as shown by significant p < .001 with effect sizes ranging from −0.60 to −4.95. According to Janssen et al. (2000) and Webber and Barr (2012), males had considerably greater ALM, MM, and SMM in absolute terms (33.0 vs. 21.0 kg) and relative to body mass (38.4 vs. 30.6%), in contrast to females. Lean body mass disparities have been demonstrated to influence performance differences between male and female distance runners (Wright et al., 2002). The muscle-related measures, such as ALM, LBM, MM, and SMM, were greater in males, which may be caused by biological factors like hormonal variations, particularly higher testosterone, which plays an important role in muscle development and maintenance. Furthermore, lifestyle factors such as physical activity patterns and exercise habits may contribute to the observed discrepancies.
In this present study, the SMM of male and female sprinters were 26.32 kg vs. 18.67 kg. Sprinters’ and long-distance runners’ muscles have a particular rigidity that can benefit their athletic performance (Miyamoto et al., 2019). Skeletal muscle mass generates force and power during explosive movements, benefiting sprinters’ performance. Male and female sprinters’ segment analysis showed a significant difference. Males had significantly more muscle mass than females, and in terms of segmental fat mass, females had more fat in all segments, but no significant difference was found (Table 3). Adult males have more arm muscle mass, larger and stronger bones, and less limb fat than females. While females have greater fat in all areas, the difference is not statistically significant (Sucunza et al., 2008; Wells, 2007). The ES in segmental fat mass showed a minor influence, 0.3 to 0.62. Muscle mass and fat mass in the arm, leg, and trunk segments played a crucial role in competitive performance.
During the performance analysis phase, male participants showed a shorter duration in covering the initial 10 meters in comparison to their female counterparts. The guys’ times varied between 1.92 and 2.05 seconds, but the females’ times ranged from 2.2 to 2.36 seconds. The faster start seen by males is in line with their higher maximum acceleration values, suggesting a more explosive first phase (Ciacci et al., 2017). The early advantage is critical in short sprints like the 100 m, as the initial acceleration greatly influences total performance.
In comparison to females, males demonstrated higher levels of maximal acceleration and maximum velocity. The results are consistent with previous research, indicating that males generally possess more muscular mass and strength, resulting in increased acceleration and velocity during sprinting competitions (Pandy et al., 2021; Perez-Gomez et al., 2008). One significant finding from this study is the considerable disparity in velocity reduction at the end between males and females. Male individuals exhibited a significantly greater decrease in velocity, with a range of 12.97 to 44.86%, in comparison to females, who reported a velocity decrease ranging from 7.36 to 12.31%. The observed decline in velocity among males suggests that, although they may initially accelerate quickly and reach higher speeds, they have a reduced capacity to sustain this velocity over the course of the race. Fatigue, potentially caused by increased initial effort, could contribute to this decrease in speed. Limitations in energy supply, such as the availability of energy from hydrolysis, anaerobic glycolysis, and oxidative digestion, primarily cause fatigue at the muscular level. Additionally, the accumulation of metabolic by-products, such as ions of hydrogen, within the muscle plays a significant role in fatigue (Girard et al., 2011).
The reduced deceleration in females indicates a more uniform performance during the sprint, either resulting from a more cautious pace or a distinct baseline for tiredness. This regularity could potentially clarify why the disparity in time between males and girls, although notable, is not as substantial as one might anticipate considering the variations in acceleration and maximum speed.
Males exhibited greater initial acceleration and maximum velocities, but their entire sprint phase time was faster than that of females. The fastest male sprinter completed the 100 m sprint in 12.11 seconds, while the fastest female took 15.37 seconds, indicating a substantial difference. An investigation revealed a noteworthy (p < .01) correlation between reaction time and the time it takes to run 100 meters. Male sprinters typically exhibit quicker and shorter reaction times in the finals compared to their female counterparts. The reaction speeds of males (0.166 ± 0.030 seconds) were significantly shorter (p < .01) than those of females (0.176 ± 0.034 seconds). Moreover, there is a correlation between the capacity to achieve greater distance in jump tests and improved sprint performance (Habibi et al., 2010; Tønnessen et al., 2013). Males outperformed females in terms of total time, as expected due to their greater reached velocities. Nevertheless, the evidence suggests that the significant decrease in speed among males probably hindered their ability to achieve even quicker timings.
As in Figure 1, ALM, MM, SMM and BMR showed a strong relation and were statistically significant (p < .001) with performance time in both genders. However, in BFM, there was a weak relation between body composition and performance time. Body size, composition, and somatotype differ across speed running performance levels. Being less ectomorphic, with more fat-free mass and strength, can account for considerable disparities in sprinting performances (Cinarli et al., 2022). Young endurance runners had longer telomeres than master endurance runners and sprinters due to reduced BMI and visceral fat (Nickels et al., 2021). In the case of VF, a relation with a significant level (p < .05) was found, and WHR showed no relation with any significance. The gender distribution of WHR and BMI determines muscle strength. Men had a greater WHR than women (0.98 0.07 vs. 0.91 0.08, respectively, p < .05). Women with high WHR have lower strength, particularly those with normal BMI (Castillo et al., 2015).
Limitations of the study
This study has multiple limitations. (1) The short sample size hinders applying the findings to a larger group of sprinters. (2) A single university team might not reflect diverse training environments, socioeconomic backgrounds, and physiological profiles of Bangladeshi sprinters. (3) We did not measure hormone levels, psychological preparation, training load, menstrual cycle phase, or testing circumstances. Compared to electronic timing systems, manual timing for performance assessment may introduce an error margin. Limitations recommend caution in interpreting the results and promote more research employing larger, more diverse samples and sophisticated measurement techniques. Despite these constraints, our study provides the framework for large-scale studies on athlete body composition and 100 m sprint performance.
Future directions
Based upon the findings of this study, future researchers should include a larger and more diverse sample of sprinters from various institutions and competitive levels across Bangladesh to enhance the generalisability of results. A longitudinal study is recommended to inquire into changes in body composition and performance over time, allowing deeper insights into a causal relationship. Including other variables such as hormone profiles, muscle fibre type distribution, training volume, and recovery patterns could provide a more thorough knowledge of factors impacting sprint performance. Furthermore, the employment of modern technology such as motion analysis systems, force plates, and electronic timing would improve the precision of performance assessments.
CONCLUSIONS
This study offers new perspectives on the correlation between body composition and 100-meter sprint performance in university-level athletes in Bangladesh. It emphasises significant gender distinctions in key body composition factors. The results highlight that male sprinters demonstrated greater levels of appendicular lean mass (ALM), lean body mass (LBM), muscle mass (MM) and skeletal muscle mass (SMM) in comparison to their female counterparts. These factors are strongly associated with enhanced sprinting performance. The strong correlation between these muscle-related indicators and sprint performance implies that improving these aspects through focused training and nutritional methods may boost sprinting efficiency.
On the other hand, there was a limited and inconsequential relationship between body fat mass (BFM) and sprint performance. This suggests that although fat distribution and overall body fat might influence athletic performance, it is muscle mass that is a more crucial aspect for achieving success in sprinting. Additionally, the research demonstrates that male sprinters typically exhibit quicker reaction times and more efficient acceleration, leading to their higher performance in the 100-meter sprint in comparison to females. Differences in physical composition and response speed highlight the importance of gender-specific approaches in training and performance improvement. To summarise, this study highlights the significant impact of body composition on sprint performance, namely the advantages of higher lean muscle mass and optimal body composition for male and female athletes. Training programs and dietary plans tailored to athletes can utilise these findings to enhance sprint performance. In the end, this will enhance our comprehension of the relationship between body composition and athletic performance.

