


 Inglês (pdf)
 Artigo em XML
 Referências do artigo
 Enviar este artigo por email
 Citado por SciELO
  Similares em
SciELO
Similares em
SciELO 
 Permalink
INTRODUCTION
The practice of physical activity during childhood yields numerous positive health outcomes that can persist into adulthood, including improvements in adiposity, cognitive development, and bone, skeletal, psychosocial, cardiac, and metabolic health (Carson et al., 2017). Specific physical activity recommendations for early childhood (0-4 years) and for children and adolescents (5-17 years) have been published by various countries (Parrish et al., 2020). In Brazil, physical activity guidelines were established in 2021, recommending that children and adolescents aged 6 to 17 engage in a minimum of 60 minutes of moderate-to-vigorous physical activity daily (Silva et al., 2021).
The promotion of physical activity among children and adolescents has demonstrated significant benefits through targeted interventions (Barbosa Filho et al., 2016; Silva et al., 2019). However, it is crucial to consider the complexity and relevance of the various factors that may influence participation in physical activity during this critical developmental period of childhood.
To sustain active lifestyles throughout life, a key consideration is the examination of children’s behavioural and motivational characteristics regarding physical and sporting activities. It is important to note that encouragement for such practices often originates in school physical education classes and through environmental influences in the child’s daily life. Furthermore, childhood represents a period of significant advancement in motor skills, as children refine their physical and motor development. The acquisition of new motor skills and physical growth triggers cognitive restructuring, enabling children to develop competence in performing specific tasks (Zeng et al., 2017). This makes childhood a particularly important period for studying motivation and the development of new behaviours. Despite the importance of assessing motivational aspects of physical activity from childhood onwards, measurement tools related to motivation in school-aged children remain notably scarce (Rodríguez et al., 2013).
Motivational factors can significantly influence behaviours related to physical and sporting activities, with these behaviours potentially exhibiting either positive or negative characteristics (Barrachina-Peris, et al., 2024; Bruijn et al., 2023; Fin et al., 2019b). As biopsychosocial aspects (Ryan & Deci, 2017), they underscore the importance of understanding the elements that affect motivation for physical activity across different age groups.
The understanding of motivation’s impact on physical activity and sports-related behaviours has been advanced through studies employing Self-Determination Theory (SDT) (Ryan & Deci, 2017). This motivational model accounts for various motivational regulations, as well as environmental and interpersonal influences. SDT posits that motivation is determined by three basic psychological needs: 1) Autonomy: Refers to the innate need to act volitionally in accordance with one’s personal values and interests, affirming a sense of agency whereby individuals take responsibility for their goals and behaviours. 2) Competence: Denotes the innate need to feel effective in one’s actions, mastering skills and successfully meeting challenges. When individuals perceive themselves as capable of completing tasks and achieving positive outcomes, their motivation to remain engaged in the activity typically increases. 3) Relatedness: Represents the innate need to feel connected, accepted and valued within social relationships, establishing meaningful bonds with others (Ryan & Deci, 2017).
When the three basic psychological needs (autonomy, competence, and relatedness) are satisfied, SDT proposes that motivation follows a self-determination continuum that varies according to an individual’s level of self-determination. This continuum consists of three main categories: amotivation, when the person has no intention or reason to act; extrinsic motivation, characterised by controlled and less self-determined regulation; and intrinsic motivation, which represents the highest degree of self-determination. An individual’s motivation level is directly influenced by the satisfaction of these psychological needs (Ryan & Deci, 2017).
Motivation for sports practice in children is a key determinant for the adoption and maintenance of adequate physical activity levels. Studies based on Self-Determination Theory (SDT) demonstrate that satisfaction with practice is intrinsically related to autonomous motivation, which in turn positively influences on physical activity engagement (Owen et al., 2013; Wang & Chen, 2022). When children perceive sports practice as enjoyable and aligned with their interests, they are more likely to remain physically active. Furthermore, the satisfaction of basic psychological needs - autonomy, competence, and relatedness - reinforces intrinsic motivation, creating a virtuous cycle that promotes adherence to healthy behaviors (Lonsdale et al., 2009; Vasconcellos et al., 2020).
Gender differences also play a significant role in this process. Boys tend to show higher levels of PA and autonomous motivation compared to girls, possibly due to sociocultural factors and gender stereotypes (Gråstén et al., 2019). However, when placed in sports contexts that emphasize cooperation and self-expression, girls demonstrate increased motivation and participation (Verloigne et al., 2011). These findings highlight the importance of inclusive pedagogical strategies that address the specific needs of each group, promoting equity and sustained engagement in sports practice.
In Brazil, some investigations have examined motivational contexts among adolescents using SDT (Fin et al., 2019a, 2019b). However, no studies have been conducted with school-aged children under 12 years, and there remains a paucity of validated instruments to assess motivational variables for sports participation among Brazilian children.
Given the importance demonstrated by previous research in evaluating childhood motivation, the identification and analysis of motivational dimensions in children may provide valuable tools for understanding behavioural patterns in structured physical activity adherence. The validation of assessment instruments and the evaluation of childhood motivation could facilitate the development of strategies to promote positive physical activity and sporting habits.
This study aims to examine the relationship between motivation for sports participation, practice satisfaction, and physical activity levels in children, while considering potential gender differences, using pictorial scales. The hypothesis proposes that motivation for sports participation predicts practice satisfaction, which in turn predicts children’s physical activity levels.
METHODS
Participants
This study included 1,089 children aged 7 to 11 years (M = 8.6, SD = 1.3), comprising 543 girls and 546 boys, enrolled in the initial years of primary education at public schools in the midwestern region of Santa Catarina, Brazil. The age distribution of participants was as follows: 296 children aged 7 (148 girls and 148 boys), 244 children aged 8 (121 girls and 122 boys), 226 children aged 9 (113 girls and 113 boys), 210 children aged 10 (115 girls and 95 boys), and 113 children aged 11 (46 girls and 67 boys). All children participated in three weekly physical education classes, with sports comprising one of the core curricular components for this age group.
Measures
Motivation for sports practice. The Pictorial Scale of Children’s Sports Motivation (Escala Pictórica de Motivación Deportiva Infantil - EPMDI) (Moreno-Murcia et al., 2021) was used, composed of 9 items that measure the degree of motivation for sports practice, grouped into three factors with three items each: intrinsic motivation (for example, “I have fun when I practice sports and do my best”; items 1, 4 and 7), extrinsic motivation (for example, “I practice sports so that my teachers/coaches and parents are happy”; items 2, 5 and 8) and amotivation (for example, “I waste my time doing sports. I find it boring”; items 3, 6 and 9). Children responded to a 3-point Likert scale, with options 1 (“Does not look like me”), 2 (“Looks a little like me”), and 3 (“Looks like me”), for each item’s question. Each alternative was presented individually, accompanied by a cartoon image, to facilitate understanding of the question. The child should indicate which image they consider most similar to themselves when practicing sports. The original scale (Moreno-Murcia et al., 2021) shows reliable internal consistency, with Cronbach’s alpha coefficient values of 0.72 for intrinsic motivation, 0.69 for extrinsic motivation, and 0.70 for amotivation.
Satisfaction with sports practice. The Visual Analogue Scale of Joy (VAS-joy) was used, consisting of a sequence of cartoon-like facial expressions (Oros & Minzi, 2015). Illustrated in colour, it displays faces with shoulder posture context, including details such as hair and eyelashes, making the images more realistic and resembling the examinee compared to traditional schematics. The facial expressions are arranged horizontally, from the happiest to the saddest, including a neutral expression. Children are asked to indicate the expression that best reflects their mood in terms of happiness and sadness, either habitually or at the time of completing the task. For statistical purposes, each image was assigned a numerical value from 1 (very sad) to 7 (happy); however, these values are not visible to children to prevent influencing their choice of faces.
Physical Activity Level. The Previous Day Physical Activity Questionnaire (QUAFDA), validated by Costa and Liparotti (2011), was used. The QUAFDA assesses children’s physical activity behaviour and is recommended for measuring physical activity levels in children aged 7 to 10 years. The questionnaire consists of 11 activities illustrated by figures (such as dancing, walking/running, playing with a dog, doing household chores, cycling, jumping rope, climbing stairs, playing ball games, swimming, skateboarding, and gymnastics), classified into three intensity levels (slow, fast, and very fast).
The overall physical activity level was calculated by summing the scores of activities the child reported performing on the day before data collection. Four weights were assigned to weight the reported activities: zero points for activities not performed, one point for light-intensity activities (slow), three points for moderate-intensity activities (fast), and nine points for vigorous-intensity activities (very fast). This weighting was based on a similar approach from a previous study (Sallis et al., 1993) and represents an estimate of the metabolic cost of activities at different intensities. The maximum possible score when computing the data is 143 points. Physical activity level was classified according to the terciles of the score distribution generated by the instrument. The cutoff values for the QUAFDA score terciles were 9, 18, and 31 for the 1st, 2nd, and 3rd terciles, respectively. To characterise the physical activity pattern, participants were categorised as less active, intermediate, and more active (Costa & Assis, 2011). The QUAFDA was selected as it is a validated instrument that is both easy to administer to children and suitable for school settings, while acknowledging that objective measures (e.g., accelerometry) provide greater precision. Although this choice represents a study limitation, it ensured instrument uniformity by consistently using pictorial scales with drawings and images across all assessments.
Procedures
As the EPMDI had not been validated for the Brazilian context, a back-translation procedure was conducted using the method outlined by van de Vijver and Hambleton (1996). The scale items were initially translated into Portuguese and subsequently back-translated into Spanish by an independent translator not affiliated with the research team. The Spanish version was then compared with the original scale, confirming complete equivalence between items. Subsequently, domain experts evaluated both the appropriateness of items for measuring children’s perceptions and the clarity of wording. To enhance scale comprehension, a pilot test was administered to 23 children aged 6 to 11 years. The instructions were read aloud, and children verbally reported their understanding of each item. Ambiguous terms and questions were discussed with the research team to ensure a comprehensive understanding. Despite the small sample size, response consistency was observed with no significant difficulties encountered.
Data collection was conducted during regular class hours in the participants’ own classrooms across six elementary schools. The scales were administered collectively to class groups, with a maximum of 25 children per group (reflecting total class enrollment). Each administration required approximately 45 minutes to complete. Two research assistants supervised all sessions, providing individualized support when necessary to ensure proper instrument completion. The data collection period spanned from April to October 2023.
Inclusion criteria were children aged 7-11 years, enrolled in the early grades of public elementary schools in the midwestern region of Santa Catarina (Brazil), with regular attendance in Physical Education classes (three sessions per week). Exclusion criteria included absence on the day of data collection or cognitive, communicative, or behavioral conditions that interfered with the comprehension or completion of the assessment instruments. Participants who submitted incomplete responses were classified as missing data cases. The study received ethical approval from the UNOESC/HUST Human Research Ethics Committee (Protocol No. 5.500.738) on 30 June 2022.
Statistical analysis
An Exploratory Factor Analysis (EFA) was performed with the objective of evaluating the factor structure of the Pictorial Scale of Children’s Sports Motivation (in Portuguese: Escala Pictórica de Motivação Esportiva Infantil - EPMEI). The analysis was conducted using a polychoric matrix and the Robust Diagonally Weighted Least Squares (RDWLS) extraction method (Asparouhov & Muthén, 2009). The determination of the number of factors to retain was made using the Parallel Analysis technique, which employed random scores from the observed data (Timmerman & Lorenzo-Seva, 2011), with Robust Promin rotation applied.
When the sample has at least 400 observations, two subsamples are calculated using Solomon’s method (Lorenzo-Seva, 2022). This method optimally divides the sample into two equivalent halves, ensuring the representativeness of the subsamples (i.e., all possible sources of variance are included in the subsamples). To evaluate the equivalence of the two subsamples, the Ratio Communality Index (RCI) is reported; the closer it is to 1, the more equivalent the subsamples are. The RCI for this sample was 0.98.
The model fit quality was verified using the Root Mean Square Error of Approximation (RMSEA), Comparative Fit Index (CFI), and Tucker-Lewis Index (TLI). As suggested in the literature (Brown, 2015), RMSEA values should be below 0.08, while CFI and TLI values should be above 0.90, preferably reaching 0.95.
The factor structure of the scales was evaluated through Confirmatory Factor Analysis (CFA). The estimation method used was Maximum Likelihood (ML), considering the characteristics of the sample (Asparouhov & Muthén, 2009). The fit indices used were: S-Bχ², the χ²/df ratio, the Incremental Fit Index (IFI), the Comparative Fit Index (CFI), and the Root Mean Square Error of Approximation (RMSEA), with the latter providing a measure of discrepancy per degree of freedom.
Descriptive statistics were performed for the investigated variables, along with structural equation modeling using Robust Diagonally Weighted Least Squares (RDWLS) estimation in JASP version 0.18.3. Additionally, to test the significance of indirect effects of intrinsic motivation, extrinsic motivation, and amotivation on practice satisfaction and physical activity level, a bootstrap analysis was conducted (5,000 iterations, 95% confidence intervals). Bootstrap analyses are robust analyses that can ensure the observed effect is not due to sample-specificities, while also allowing hypothesis testing without specific assumptions about normality of the distribution (Preacher & Hayes, 2008).
To perform the descriptive, reliability, and confirmatory factor analyses, JASP version 0.17.2.1 was used.
RESULTS
Psychometric properties of the pictorial scale of children’s sports motivation
An independent sample of 1,225 children aged 6 to 11 years (M = 8.3; SD = 1.51), comprising 620 girls and 605 boys, was recruited to assess the psychometric properties of the EPMEI. Exploratory analysis conducted via Bartlett’s sphericity test (2635.3, df = 36; p < .001) and the Kaiser-Meyer-Olkin (KMO = 0.80) measure suggested interpretability of the item correlation matrix. For the polychoric correlation matrix, items with a Measure of Sampling Adequacy (MSA) below 0.50-indicating they did not measure the same domain as the remaining items-were flagged for removal (Lorenzo-Seva, 2022). However, no items were removed from the EPMEI. The total explained variance was 42.1%, with factor loadings ranging from 0.44 to 0.95.
Subsequently, a Confirmatory Factor Analysis (CFA) was performed to evaluate the adequacy of the 9-item Pictorial Scale of Children’s Sports Motivation (in Portuguese: Escala Pictórica de Motivação Esportiva Infantil - EPMEI), using maximum likelihood (ML) estimation and polychoric correlation matrices as input. The fit indices were as follows: χ²(24, N = 1225) = 95.783, p < .001; IFI = .91; CFI = .91; RMSEA = .049; SRMR = 0.043 (Table 1).
Table 1. Estimated Parameters from the confirmatory factor analysis for the pictorial scale of children’s sport motivation.
| Mean | Standard deviation | Standardised regression weights | Skewness | Kurtosis | |
|---|---|---|---|---|---|
| Item 1 | 2.85 | 0.46 | 0.27 | -3.207 | 9.221 |
| Item 2 | 1.69 | 0.71 | 0.17 | 0.525 | -0.910 |
| Item 3 | 1.32 | 0.60 | 0.34 | 1.723 | 1.777 |
| Item 4 | 2.80 | 0.51 | 0.24 | -2.670 | 5.961 |
| Item 5 | 2.17 | 0.91 | 0.77 | -0.352 | -1.705 |
| Item 6 | 2.14 | 0.47 | 0.08 | 0.399 | 0.817 |
| Item 7 | 2.84 | 0.46 | 0.25 | -3.074 | 8.459 |
| Item 8 | 1.62 | 0.62 | 0.11 | 0.498 | -0.650 |
| Item 9 | 1.29 | 0.66 | 0.37 | 1.999 | 2.254 |
Source: The authors.
Mean and standard deviation of participants’ responses for each item of the scale; Standardised Regression Weights: indicate the strength of the relationship between each item and the latent factor (sport motivation), with higher values indicating a greater contribution of the item to the factor; Skewness: measures the degree of asymmetry in the distribution of responses-values close to zero indicate a symmetric distribution, while positive or negative values indicate right or left skewness, respectively; Kurtosis: measures the peakedness of the response distribution-positive values indicate a more peaked distribution (leptokurtic), whereas negative values indicate a flatter distribution (platykurtic).
Descriptive analysis and correlations
Physical activity levels revealed that 49.5% of children were “less active” according to age-appropriate benchmarks, while 25.5% were “moderately active” and 25% were “more active.” A chi-square test indicated a significant association between physical activity level and sex [χ²(2) = 30.026; p < .001], with boys being more active than girls (Table 2).
Table 2. Descriptive statistics of physical activity level classification, considering the sex of the children participating in the study.
| Girls | Boys | Total | p-value | |
|---|---|---|---|---|
| More active | 99 | 173 | 272 | .000** |
| Intermediate | 138 | 140 | 278 | |
| Less active | 306 | 233 | 539 | |
| Total | 543 | 546 | 1089 |
Source: The authors.
Chi-square. **p < .001 *p < .005, assesses whether there are statistically significant differences between sexes. The chi-square test revealed a statistically significant difference between sexes (p < .001), indicating that the level of physical activity varies according to sex.
Regarding motivational variables and practice satisfaction, high intrinsic motivation scores were observed, with no sex differences (p = .133). Extrinsic motivation scores were higher among boys (p = .000), and boys also reported greater practice satisfaction compared to girls (p = .000) (Table 3).
Table 3. Descriptive statistics of motivational variables and satisfaction for participation, considering the sex of the children participating in the study.
| Girls | Boys | ||||||
|---|---|---|---|---|---|---|---|
| Mean | SD | Mode | Mean | SD | Mode | p-value | |
| Intrinsic motivation | 2.8 | 0.36 | 3 | 2.9 | 0.33 | 3.0 | .133 |
| Extrinsic motivation | 1.7 | 0.50 | 2 | 1.9 | 0.47 | 2.0 | .000** |
| Demotivation | 1.6 | 0.42 | 1.3 | 1.5 | 0.39 | 1.3 | .178 |
| satisfaction for the practice | 5.9 | 1.28 | 7.0 | 6.2 | 1.21 | 7.0 | .000** |
Source: The authors.
SD: standard deviation. Mann-Whitney. ** p < .001 * p < .005. Significance value of the Mann-Whitney test, assessing whether there are statistically significant differences between sexes.
Mediation model
The hypothesised model-where sports motivation predicts practice satisfaction, which in turn predicts physical activity levels-demonstrated good fit: χ²(104.736; n = 1089); p < 0.001; CFI = 0.89; TLI = 0.83; GFI = 0.98; RMSEA = 0.041 (90%CI = 0.032-0.050); SRMR = 0.043 (Figure 1 and Table 4). The analysis of model fit indices indicated that most values were within acceptable ranges. However, the Tucker-Lewis Index (TLI = 0.83) was slightly below the commonly recommended threshold of 0.90. Although not ideal, this value still suggests a reasonable fit when considered alongside other indices, such as CFI and RMSEA, which met acceptable criteria. It is important to note that slightly lower TLI values are not uncommon in complex models involving multiple latent variables, especially when applied to heterogeneous samples, as is the case in the present study. Such deviations may reflect the variability inherent in the data rather than poor model specification.
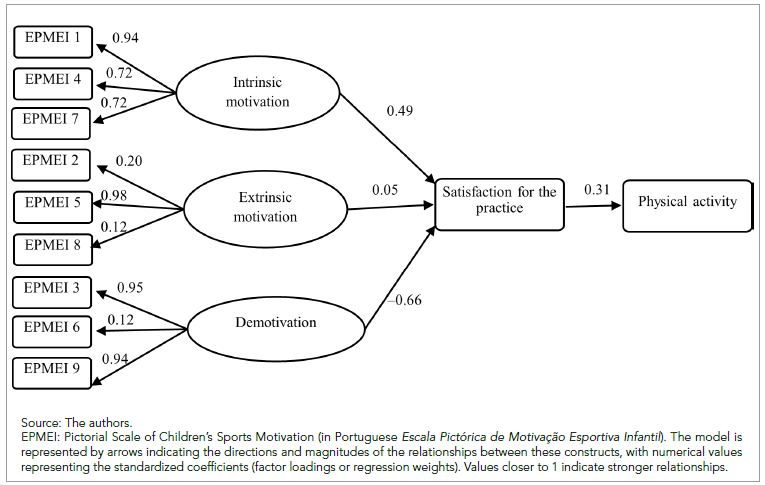
Table 4. Decomposition of the effects of intrinsic motivation, extrinsic motivation, and demotivation on satisfaction with participation and physical activity level in children.
| Predictor variable | Dependent variable | β | SE | p-value | 95%IC | |
|---|---|---|---|---|---|---|
| Lower | Upper | |||||
| Satisfaction for the practice | Physical activity level | 0.470 | 0.393 | .232 | -0.478 | 1.425 |
| Intrinsic motivation | Satisfaction for the practice | 0.686 | 0.118 | < .001 | 0.442 | 1.020 |
| Extrinsic motivation | Satisfaction for the practice | 0.088 | 0.007 | < .001 | -0.143 | 0.122 |
| Demotivation | Satisfaction for the practice | -0.823 | 0.161 | < .001 | -1.246 | -0.487 |
Source: The authors.
Note: Standardized regression coefficients with 95% confidence interval; β (Standardized Regression Coefficient): indicates the strength and direction of the predictor variable’s effect on the dependent variable, with positive values indicating a positive effect and negative values indicating a negative effect; SE (Standard Error): measure of the precision of the regression coefficient, with smaller SE indicating greater reliability of the estimate; p (Significance Value): indicates the probability that the observed effect is due to chance, with values smaller than 0.05 (or 0.001, as indicated) considered statistically significant; 95%CI (95% Confidence Interval): the range containing the true value of the regression coefficient with 95% confidence, and if the interval does not include zero, the effect is considered statistically significant.
Results indicated that intrinsic motivation emerged as the primary predictor of sports practice satisfaction, followed by extrinsic motivation, while amotivation exerted a significant negative effect; however, practice satisfaction did not directly predict children’s physical activity levels. These findings collectively underscore the critical importance of fostering intrinsic motivation and mitigating amotivation to enhance satisfaction in children’s participation in sports.
DISCUSSION
This study investigated the relationship between motivation to practice sports, satisfaction with practice, and level of physical activity in children aged 7 to 11, using pictorial scales adapted for the Brazilian context. The results revealed significant differences between the sexes, with boys showing a higher level of physical activity compared to girls, results that corroborate other studies in Brazil (Soares et al., 2023). Even so, the children demonstrated intrinsic motivation and satisfaction with their practice. The differences observed between boys and girls reinforce the need for different approaches to teaching sport. While boys tend to engage more in traditional activities, girls show greater motivation in contexts that prioritize collaboration and individual expression (Gråstén et al., 2019). These results suggest that interventions based on SDT should consider the particularities of each gender, adapting pedagogical strategies to maximise engagement and satisfaction. Future studies could investigate how different sports impact motivation and physical activity in specific groups, contributing to the development of more effective and inclusive programs.
In addition, the lower level of physical activity among girls may reflect barriers such as the lack of safe spaces to practice or less family encouragement, aspects that deserve attention in future interventions.
Despite having a lower level of physical activity than recommended for their age group, the children showed high levels of intrinsic motivation, which corroborates the Self-Determination Theory (SDT) (Ryan & Deci, 2017). This result suggests that, even in a context of low physical activity, children maintain a genuine interest in sport, possibly due to the satisfaction of basic psychological needs (autonomy, competence, and attachment). However, intrinsic motivation did not translate directly into greater physical activity, indicating the presence of other mediators, such as environmental support or accessibility to physical activities, which were not measured in this study.
The hypothetical model tested confirmed that intrinsic and extrinsic motivation positively predict satisfaction with sports practice, while demotivation has a significant negative impact. These results reinforce the importance of pedagogical strategies that promote self-determined motivation (Leo et al., 2022). However, satisfaction with the practice did not prove to be a direct predictor of the level of physical activity, partially contradicting the initial hypothesis. This discrepancy can be attributed to methodological limitations, such as the study’s cross-sectional nature or the lack of control for contextual variables (e.g., school infrastructure, parental influence).
It is important to consider that children’s lives are still very much mediated mainly by the actions of the adults responsible for meeting their physical, social and psychological needs, since they are the ones who nurture and support their growth, development and education, ensuring safety and protection throughout childhood (Palmer et al., 2017), as well as providing the necessary opportunities for the effective practice of movement, in this context of physical activity and sport.
Assessing motivational patterns can also serve as a tool for promoting healthy lifestyle behaviors in this population. Physical education practitioners who exhibit more self-determined motivation place greater importance on sport-related values, demonstrating a stronger intention to be physically active in the future, a higher level of effort, greater pleasure, a higher capacity for cooperation, and a lower level of boredom (Bruijn et al., 2023). Several factors can affect children’s participation in physical activities, the proper development of motor skills as well as physical activity levels are important not only for children’s health, but because they are closely related to the behavioral skills and lifestyle habits that accompany people over the years (Schmutz et al., 2020).
According to the authors of SDT, people are born with tendencies to consistently seek success, overcome challenges, and integrate new experiences of their own volition. These developmental tendencies do not work in isolation and require an environment that supports them, however, social contexts, including school, often offer an environment that goes against the desired direction, leading to a lack of conformity, oppositional behaviors and disinterest and abandonment (Ryan & Deci, 2017). Other researchers have investigated underlying factors that involve motivation to perform a certain task, including the influence of the interpersonal style of the teacher and parents, the perception of competence, satisfaction with practice, how these can determine the level of physical activity in populations of adolescents and young people (Fin et al., 2019a; Leo et al., 2022; Meerits et al., 2023), but there are still few studies investigating motivational factors in children.
The validation of the Pictorial Scale of Children’s Sports Motivation (EPMDI) for the Brazilian context demonstrated adequate psychometric properties, offering a valid tool for assessing motivation in children. The scale allowed us to identify that intrinsic motivation was the main factor associated with satisfaction, highlighting the relevance of interventions that stimulate pleasure and self-efficacy from childhood. However, the low level of physical activity observed, even with high intrinsic motivation, suggests that external factors (e.g., public policies, access to sports facilities) may be limiting the translation of motivation into active behavior.
This study has limitations, such as the absence of longitudinal data and the lack of evaluation of contextual variables (e.g., parental support, infrastructure). Future research should adopt longitudinal designs to establish causal relationships and include additional mediators, such as perceived motor competence and the school environment. In addition, interventions based on SDT should be tested, focusing on strategies differentiated by gender and age, to maximize adherence to physical activity.
Although the initial hypothesis of the study suggested a mediating effect of practice satisfaction on the relationship between motivation and physical activity levels, the statistical results did not indicate a significant association between satisfaction and physical activity. This lack of significance precludes the application of a formal mediation analysis based on traditional assumptions (Preacher & Hayes, 2008), which require statistically significant relationships between the components of the model. Nevertheless, we acknowledge the theoretical relevance of this possibility and recommend that future studies explore mediation models incorporating additional contextual variables, such as parental support, school environment, or opportunities for physical activity, which may indirectly influence this relationship.
The results of this study have important implications for teachers, parents and health and education managers who want to promote physical activity among children. Gender disparities in physical activity levels suggest that schools and sports programs should adopt differentiated strategies. Since intrinsic motivation alone was not sufficient to increase physical activity, interventions should simultaneously address environmental barriers, such as improving access to safe spaces, training teachers in behaviors that support self-determined motivation, and involving parents to model active lifestyles. The validated EPMDI scale can serve as a diagnostic tool to identify children’s motivational profiles, allowing for personalized interventions. Future research should prioritize longitudinal designs to examine causal pathways and test multicomponent programs that combine motivational strategies (e.g., autonomy-supportive training) with structural changes (e.g., community partnerships to expand access to after-school sports). By addressing both psychological and contextual factors, such initiatives could bridge the gap between motivation and sustained physical activity in this critical age group.
CONCLUSIONS
Participants demonstrated physical activity levels below age recommendations, with boys being more active than girls. Despite lower activity, children exhibited strong intrinsic motivation. The Pictorial Scale of Children’s Sports Motivation proved effective for childhood assessment, revealing intrinsic motivation as a predictor of practice satisfaction, which subsequently positively influenced physical activity levels in this age group.

