




 Inglês (pdf)
 Artigo em XML
 Referências do artigo
 Tradução automática
 Enviar este artigo por email
 Citado por SciELO
  Similares em
SciELO
Similares em
SciELO 
 Permalink

INTRODUCTION
Resistance training is a primary form of exercise for enhancing muscular adaptations such as strength and hypertrophy (Folland & Williams, 2007; Kraemer & Ratamess, 2004; Polito et al., 2021; Schoenfeld et al., 2015). A key outcome of these adaptations is a change in body composition, which can be assessed non-invasively using bioelectrical impedance analysis (BIA) (Lee & Gallagher, 2008; Lukaski, 2013; Santos et al., 2020). Beyond traditional estimates, BIA provides raw data - resistance (R) and reactance (Xc) - used to calculate the Phase Angle (PhA) (Annunziata et al., 2024; Di Vincenzo et al., 2019; Lukaski, 2013; Sardinha & Rosa, 2023). PhA is increasingly recognised as a robust indicator of cellular health, reflecting cell membrane integrity and the balance between intracellular (ICW) and extracellular (ECW) water (Sardinha & Rosa, 2023).
The physiological adaptations specific to resistance training (RT) provide a strong rationale for its potential to influence PhA (Sardinha, 2018). The process of muscle hypertrophy leads to an expansion of intracellular volume and an increase in the ICW/ECW ratio, which theoretically increases PhA (Annunziata et al., 2024). This causal relationship is supported by longitudinal evidence showing that a 6-week RT intervention significantly increased PhA in trained males (Stratton et al., 2021). Recent studies have suggested that PhA improves muscle quality, and its association with strength and power persists even after controlling for lean soft tissue (Fukuoka et al., 2022; Hetherington-Rauth et al., 2021). The magnitude of these adaptations is most apparent in elite bodybuilders, who demonstrate exceptionally high PhA values that correspond directly to their optimised intracellular hydration status (Giakoni-Ramírez et al., 2025; Nunes et al., 2022).
However, a critical perspective is warranted when interpreting PhA in healthy young adults. This population has high baseline cellular health, as athletes consistently demonstrate higher PhA values than non-athletic controls (Di Vincenzo et al., 2019), which may limit the magnitude of detectable changes. For instance, in a study on fit army cadets, the association between PhA and strength was weak and non-significant for lean soft tissue, suggesting its superficial utility in well-conditioned individuals (Langer et al., 2023). Furthermore, the focus on whole-body PhA may overlook more specific adaptations, as emerging evidence suggests that segmental PhA is a stronger predictor of limb-specific performance (Silvino et al., 2024).
Even a recent systematic review has confirmed a general positive association between PhA and muscle strength in diverse populations (Martins et al., 2022), and cross-sectional studies in young adults continue to identify PhA as a significant predictor of musculoskeletal fitness (Ballarin et al., 2024). However, a critical gap still exists in the literature. Normative PhA values for the general population have been updated (Campa et al., 2023), and PhA values for athletes are now available, revealing distinct profiles for different sport modalities (Campa, Thomas, et al., 2022), highlighting the rapid evolution of the field. To our knowledge, no review has systematically mapped evidence on how different RT program variables (e.g., volume, intensity, modality) influence PhA in healthy young adults. More knowledge is needed to optimise training prescription for both performance and cellular health of adults. In this sense, the aim of this scoping review was to explore and analyse the literature on the relationship between different resistance training interventions and phase angle in healthy young adults.
METHODS
Design
This scoping review was conducted in compliance with the Preferred Reporting Items for Systematic Reviews and Meta-Analyses 2020 (PRISMA2020) guidelines (Page et al., 2021) and the PRISMA-ScR extension for Scoping Reviews (Tricco et al., 2018) for conducting systematic reviews in sports sciences. The scoping review protocol was registered a priori in the OSF platform with the associated project reference https://osf.io/rezmg/ and the registration DOI: https://doi.org/10.17605/OSF.IO/Y48PJ.
Eligibility criteria
The inclusion and exclusion criteria can be found in Table 1, and it was based on PICOS strategy (Methley et al., 2014), in which P stands for population, I stands for intervention, C stands for comparison, O stands for outcome, and S stands for study design.
Table 1. Eligibility criteria.
| PICOS | Inclusion criteria | Exclusion criteria |
|---|---|---|
| P | Individuals aged 18 to 35 years, of any sex | Participants aged < 18 years or > 35 years |
| I | Any form of resistance training, including dynamic or isometric contractions with an intervention duration of minimum of 4 weeks | Participants performing forms of exercise other than RT |
| C | Studies comparing individuals performing RT to those not performing RT, or studies comparing different RT intervention, or studies with no comparison group | No study will be excluded based on comparators |
| O | Phase angle derived from bioelectrical impedance analysis (mon- or multifrequency, any frequency) reported as a primary or secondary outcome. Studies reporting reactance and resistance values allowing PhA calculation were also included. Position during assessment was not an exclusion factor | Studies reporting outcomes other than PhA, reactance, or resistance from BIA |
| S | Randomized controlled trials and non-randomized controlled trials | Cross-sectional studies; Studies without an abstract available in English or not published in a peer-reviewed journal; Grey literature (e.g., theses, dissertations, conference papers (proceedings) |
RT: resistance training; PhA: Phase angle; reactance; BIA: bioelectrical impedance analysis; PICOS: population, intervention, comparator, outcome, study design.
Information sources and search strategy
A systematic search of four databases (PubMed, SciELO Citation Index, Web of Science, and Scopus) was conducted using relevant publications published up to April 29, 2025. The search was performed using the Boolean search method, which limited search results with operators including OR to only those research containing important key terms in the scope of the review. The main categories of search terms were identified: (“resistance training” OR “resistance exercise” OR “strength training” OR “velocity-based training”) AND (“phase angle” OR “bioimpedance” OR “electrical-impedance”). Table 2 provides a comprehensive overview of all search details for each database.
Table 2. Full search strategy for each database.
| Database | Specificities of the databases | Search Strategy |
|---|---|---|
| PubMed | All fields | Resistance training and Phase angle; Resistance training and Bioimpedance; Resistance training and Electrical-impedance; Resistance exercise and Phase angle; Resistance exercise and Bioimpedance; Resistance exercise and Electrical-impedance; Strength training and Phase angle; Strength training and Bioimpedance; Strength training and Electrical-impedance; Velocity-based training and Phase angle; Velocity-based training and Bioimpedance; Velocity-based training and Electrical-impedance. |
| SciELO | All fields | Resistance training and Phase angle; Resistance training and Bioimpedance; Resistance training and Electrical-impedance; Resistance exercise and Phase angle; Resistance exercise and Bioimpedance; Resistance exercise and Electrical-impedance; Strength training and Phase angle; Strength training and Bioimpedance; Strength training and Electrical-impedance; Velocity-based training and Phase angle; Velocity-based training and Bioimpedance; Velocity-based training and Electrical-impedance. |
| Web of Science | All fields | TS = Resistance training and TS = Phase Angle; TS = Resistance training and TS = Bioimpedance; TS = Resistance Training and TS = Electrical-Impedance; TS = Resistance Exercise and TS = Phase Angle; TS = Resistance Exercise and TS = Bioimpedance; TS = Resistance Exercise and TS = Electrical-Impedance; TS = Strength Training and TS = Phase Angle; TS = Strength Training and TS = Bioimpedance; TS = Strength Training and TS = Electrical-Impedance; TS = Velocity-Based Training and TS = Phase Angle; TS = Velocity-Based Training and TS = Bioimpedance; TS = Velocity-Based Training and TS = Electrical-Impedance. |
| Scopus | All fields | All (“Resistance Training”) and All (“Phase Angle”); All (“Resistance Training”) and All (“Bioimpedance”); All (“Resistance Training”) and All (“Electrical-Impedance”); All (“Resistance Exercise”) and All (“Phase Angle”); All (“Resistance Exercise”) and All (“Bioimpedance”); All (“Resistance Exercise”) and All (“Electrical-Impedance”); All (“Strength Training”) and All (“Phase Angle”); All (“Strength Training”) and All (“Bioimpedance”); All (“Strength Training”) and All (“Electrical-Impedance”); All (“Velocity-Based Training”) and All (“Phase Angle”); All (“Velocity-Based Training”) and All (“Bioimpedance”); All (“Velocity-Based Training”) and All (“Electrical-Impedance”). |
Selection process
The literature search was conducted by one author (T. V.), followed by screening and eligibility assessment of the studies by two authors (T. V. and A. D. M.). If there was any doubt, a third author (R. O.) was consulted. Studies that did not meet the inclusion criteria were excluded from analysis. Abstracts with insufficient information regarding inclusion and exclusion criteria were selected for full-text evaluation. In the second phase, the two authors (T. V. and R. O.) independently evaluated all the selected full-text articles and conducted a second selection based on the inclusion and exclusion criteria. In case of disagreement, a third author was consulted (A. D. M.).
Data collection process
T. V. and D. P. extracted data, whereas R. O. and A. R. A. independently reviewed the process. If data were not available, the original authors were contacted to access the data.
Data items
Population: name of first author, year of publication, number of participants, sex, gender, age, study type, intervention, or exposure (including details of frequency, intensity, rest intervals, duration (weeks), and exercises).
Comparator: information about control and intervention groups (type of exercise and relative intensity).
Outcomes: Phase Angle for total body and body segments (if included).
Study risk of bias assessment
Study quality was assessed by T. V. and R. O. using the PEDro risk of bias assessment tool (Maher et al., 2003). This tool specifies 11 individual classifications to determine the risk of bias within each selected study. The risk of bias for each study was assessed for the following domains: (1) eligibility criteria specification, (2) random allocation, (3) concealed allocation, (4) baseline comparability, (5) blinding of subjects, (6) blinding of therapists, (7) blinding of assessors, (8) adequate follow-up (more than 85%), (9) intention-to-treat analysis, (10) between-group statistical comparisons, and (11) reporting of point measures and measures of variability. The scores were independently calculated to avoid any potential bias. Disagreements between the authors were resolved by consensus in a meeting with a third author (A. R. A.). The Cochrane criteria were applied to assess the evidence of interventions (Van Tulder et al., 2003). Therefore, the selected studies were grouped by levels of evidence according to their methodological quality. A study with a PEDro score of 6 or more is considered level 1 (high methodological quality, 6-8 good, 9-10 excellent), and a score of 5 or less is considered level 2 (low methodological quality, 4-5 moderate, < 4 poor).
Synthesis of results
Mean ± standard deviation and p-values were extracted to describe PhA results. When the effect sizes were available, data were also extracted and interpreted in the exact same way as in the included study. When effect sizes were not available, Cohen’s D effect size (ES) was determined (by the difference of two means divided by the standard deviation of the different measures). Finally, the ES was interpreted as follows: 0-0.19 = trivial effect size; 0.20-0.49 = small effect size; 0.50-0.79 = moderate effect size; and 0.80 and higher (Cohen, 1992).
RESULTS
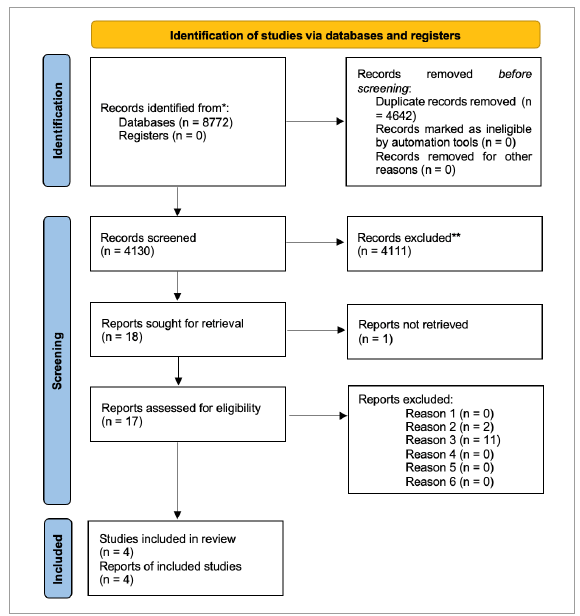
The systematic search across the specified databases yielded 8772 potential records. After removal of 4642 duplicates, 4130 records were screened by title and abstract. Seventeen full-text articles were assessed for eligibility against the inclusion criteria. Ultimately, four studies (Jones et al., 2023; Kadhim et al., 2024; Ribeiro et al., 2017; Santisteban et al., 2024) met the criteria and were included in this scoping review. The detailed study selection process is illustrated in the PRISMA flow diagram (Figure 1).
Characteristics of the included studies
The key characteristics of the four included studies are detailed in Figure 1. The studies included both male (total n = 76) and female (total n = 57) participants, although one study included only males (n = 12) (Kadhim et al., 2024).
Risk of bias in studies
The methodological assessment of the four studies included in this analysis is presented in Table 3. These studies obtained a score between five (Kadhim et al., 2024; Ribeiro et al., 2017; Santisteban et al., 2024) and six (Jones et al., 2023), with a mean value of five [level 2] in terms of methodological quality based on the PEDro scale. One of the reviewed studies presented high methodological quality [level 1] (Jones et al., 2023), and three revealed lower methodological quality [level 2] (Kadhim et al., 2024; Ribeiro et al., 2017; Santisteban et al., 2024). Furthermore, the results of the PEDro scale showed that all studies reported the inclusion and exclusion criteria. Only one study randomly allocated participants into groups (Jones et al., 2023), which used a crossover design assigning each participant’s legs to different conditions (Blood Flow Restriction vs. traditional training). No studies allocated the participants into groups in a concealed way. One study did not perform the baseline comparability (Ribeiro et al., 2017), comparing men and women without randomisation.
Table 3. Analysis of the risk of bioelectrical impedance analysis of the studies included in this review.
| Reference | Pedro scale | Total score | Methodological quality | ||||||||||
|---|---|---|---|---|---|---|---|---|---|---|---|---|---|
| 1 | 2 | 3 | 4 | 5 | 6 | 7 | 8 | 9 | 10 | 11 | |||
| Jones et al., 2023) | Y | 1 | 0 | 1 | 0 | 0 | 1 | 1 | 0 | 1 | 1 | 6 | Good |
| Kadhim et al., 2024 | Y | 0 | 0 | 1 | 0 | 0 | 1 | 1 | 1 | 0 | 1 | 5 | Moderate |
| Ribeiro et al., 2017 | Y | 0 | 0 | 0 | 0 | 0 | 1 | 1 | 1 | 1 | 1 | 5 | Moderate |
| Santisteban et al., 2024 | Y | 0 | 0 | 1 | 0 | 0 | 1 | 1 | 1 | 0 | 1 | 5 | Moderate |
1: eligibility; 2: random allocation; 3: concealed allocation; 4: baseline comparability; 5: blind subjects; 6: blind therapists; 7: blind assessors; 8: adequate follow-up; 9: intention-to-treat analysis; 10: between-group comparisons; 11: Point estimates and variability; Y: yes; N: no; §: Scored by reviewers.
Eligibility criteria item does not contribute to total score.
Additionally, no studies blinded the participants or the technicians responsible for administering the training interventions. All studies likely blinded the assessors who measured at least one key outcome; specifically, assessors were likely blinded to pre-/post-status when using objective measurement tools such as isokinetic dynamometers (Biodex), ultrasound, bioelectrical impedance analysis (InBody, Xitron), and devices for measuring glycated haemoglobin (Quo-Lab). One study (Jones et al., 2023), did not perform an adequate follow-up, meaning that measures of at least one key outcome were not obtained from more than 85% of the subjects initially allocated to groups, as one participant was excluded from the final analysis due to a non-study related injury. One study did not perform an intention-to-treat analysis (Jones et al., 2023), which requires analysing all participants in the groups to which they were originally assigned, regardless of adherence or completion. One study reported between-group statistical comparisons (Ribeiro et al., 2017); in this context, ‘between-group’ refers to comparisons of changes in outcomes between inherently different groups (e.g., men vs. women), rather than comparisons between randomly assigned intervention groups. All studies reported point measures (e.g., means) and measures of variability (e.g., standard deviations) for at least one key outcome.
Intervention characteristics and Phase Angle effects
The characteristics of the participants across the four included studies are detailed in Table 4. The studies included a total of 133 healthy young adults, comprising 76 males and 57 females. However, one study focused exclusively on males (Kadhim et al., 2024). The mean age of participants ranged from approximately 20 to 24 years across the different study groups. Bioelectrical impedance analysis for PhA assessment was conducted using either the InBody 770 or Xitron Hydra 4200 devices across studies.
Table 4. Characteristics of the included studies.
| Intervention group | ||||||
|---|---|---|---|---|---|---|
| Sample N/F/M | Age (yr) | Weight (kg) | BMI (kg/m2) | |||
| Ribeiro et al., 2017 | Brazil | Xitron Hydra, model 4200, Xitron Technologies, San Diego, CA, USA | 59/31/28 | M 22.2 ± 4.3 F 23.2 ± 4.1 | M 67.8 ± 9.0 F 58.7 ± 12.1 | M 22.4±2.4 F 22.0±3.5 |
| Santisteban et al., 2024 | Spain | Inbody 770, InBody Europe, Amsterdam, The Netherlands | 22/7/15 | M 20.3 ± 1.3 F 21.0 ± 1.41 | M 72.67 ± 8.98 F 61.06 ± 10.06 | M 22.65 ± 1.84 F 21.7 ± 2.62 |
| Kadhim et al., 2024 | United States of America | Inbody 770 (Biospace Co, Ltd. Seoul, Korea) | 12/0/12 | 22.08 ± 4.1 | 71.5 ± 15.9 | NR |
| Jones et al., 2023 | United States of America | InBody 770 (Biospace InBody, Seoul, South Korea) | 40/19/21 | 24.3 ± 2.6 | 73.8 ± 13.2 kg | NR |
N: number; F: female; M: male; yr: years; NR: not reported; BMI: body mass index.
The resistance training interventions employed exhibited substantial heterogeneity, as summarised in Table 5. Intervention durations ranged from 6 weeks (Jones et al., 2023) to 16 weeks (Ribeiro et al., 2017). Training frequency varied from once per week using isometric contractions (Santisteban et al., 2024) to three times per week employing dynamic contractions (Kadhim et al., 2024; Ribeiro et al., 2017). Training intensity also differed markedly, encompassing maximal isometric effort (Santisteban et al., 2024), low-load blood-flow restriction (BFR) training (30% 1RM) and high-load traditional (TRAD) training (80% 1RM) (Jones et al., 2023), moderate-load hypertrophy training (Ribeiro et al., 2017), and undefined intensity using a variable resistance suit. All interventions were reported as supervised.
Table 5. Interventions of the included studies.
| Reference | Training method | wk | Session duration | Intervention Group | CG | ||||||
|---|---|---|---|---|---|---|---|---|---|---|---|
| Exercises performed | Frequency (days/wk) | Intensity | Sets (n) | Reps (n) | Rest (s) | Supervised | |||||
| Ribeiro et al., 2017 | A supervised progressive RT program designed to induce muscular hypertrophy | 16 | bench press, 45°-angle leg press, wide grip behind-the-neck pull-down, leg extension, side lateral raise, lying leg curl, triceps pushdown, calf raise, arm curl, incline dumbbell fly, seated cable rows, military press, triceps press, seated calf raise, crunches | 3 | NR | 3 |
|
|
Yes | No | |
| Santisteban et al., 2024 | Isometric training on lumbar and knee extension machines | 12 | 250 seconds (90 second isometric contraction and 160 second rest) | Lumbar extension, knee extension | 1 | “all out effort” | 3 (contractions) | 1 | 120 (between exercises) | Yes | No |
| Kadhim et al., 2024 | Resistance Training using Variable Resistance Suit (VARS) | 8 | NR | Elbow and knee flexion/extension | 3 | NR | 6 | 10 | NR | Yes | No |
| Jones et al., 2023 | Resistance Training (BFR-ELET and TRAD-ELET) | 6 | NR | Leg curl | 2 |
|
4 (for BFR-ELET) and 3 (for TRAD-ELET) |
|
30 | Yes | No |
n: number; min: minutes; sec: seconds; wk: week; CG: control group; RM: repetition maximum; RPE: rated perceived exertion; NR: not reported; NA: not applicable; BFR: blood flow restriction. The other groups under study were not analyse due to exclusion criterion number 4.
The reported effects of these diverse interventions on PhA, the primary outcome measure, were variable, as detailed in Table 6. A statistically significant increase (p < .05) in total body PhA was observed following a 16-week hypertrophy-oriented program in both men and women (Ribeiro et al., 2017). In contrast, no significant changes were found after 12 weeks of low-frequency isometric training (Santisteban et al., 2024; p = .397 for leg, p = .877 for arm), although the latter assessed segmental PhA. Furthermore, Jones et al. (2023) reported a statistically significant decrease (p < .001) in total body PhA following 6 weeks of low-load BFR training, whereas the traditional high-load training group showed no significant change (p = .78). Effect sizes, where reported or calculated, ranged from trivial (d = .00 for TRAD in Jones et al., 2023) to moderate (d = -0.54 for women in Santisteban et al., 2024)
Table 6. Summary of study aims, phase angle results, and effect sizes.
| Reference | Aim (s) | Group | Phase angle results a | p value | Group × time interaction | Effect Size | Interpretation of Effect Size | |||
|---|---|---|---|---|---|---|---|---|---|---|
| kHz | Body part | Pre | Post | |||||||
| Ribeiro et al., 2017 | To investigate the effect of a hypertrophy-type resistance training protocol on phase angle, an indicator of cellular integrity, in young adult men and women | IG (men) | 50 | Total | 7.19 ± 0.63 | 7.50 ± 0.60 | < .05 | 0.54 | 0.50 | Moderate |
| IG (women) | Total | 6.34 ± 0.63 | 6.71 ± 0.69 | < .05 | 0.56 | Moderate | ||||
| Santisteban et al., 2024 | To analyse the effects of short-term isometric strength training on pain, body composition, and biomarkers of health in young adults | IG (men) | NR | Total | 6.69 ± 0.52 | 6.81 ± 0.48 | .09 | NA | -0.45 | Small |
| IG (women) | Total | 5.99 ± 0.26 | 6.17 ± 0.51 | .19 | -0.54 | Moderate | ||||
| Kadhim et al., 2024 | This study evaluates Variable Resistance Suit (VARS) as a novel method to induce muscle strength improvement | IG | NR | Leg | 6.49 ± 0.31 | 6.55 ± 0.28 | .397 | NA | 0.20 | Small |
| Arm | 5.51 ± 0.22 | 5.58 ± 0.19 | .877 | 0.33 | Small | |||||
| Jones et al., 2023 | The aim of this study was to investigate the effect of longitudinal BFR training on eccentric hamstring muscle power, strength, lean mass, and perceived soreness. | IG (BFR) | 50 | Total | 6.9 ± 0.87 | 6.61 ± 0.86 | < .01 | < 0.05 | 0.33 | Small |
| IG (TRAD) | 6.95 ± 0.86 | 6.95 ± 0.83 | .78 | 0.00 | Trivial | |||||
Significant differences are highlighted in bold. CG: control group; IG: intervention group; NR: not reported; NA: not applicable; TRAD: traditional training; BFR: blood flow restriction; p: probability value indicating statistical significance; a: data presented as mean ± standard deviation.
DISCUSSION
This scoping review synthesised the current evidence on the effects of various resistance training programs on Phase Angle in healthy young adults. A central finding was the considerable heterogeneity in PhA responses to different RT protocols, with interventions resulting in increases, decreases, or no significant changes. Despite this variability, a potential trend emerged, suggesting that protocols characterised by higher training volumes and intensities are more likely to elicit favourable long-term adaptations in PhA. This complex picture needs a deeper analysis of the physiological mechanisms and methodological limitations that could account for these divergent findings.
The divergent PhA responses observed in the included studies can be interpreted through the lens of two competing physiological pathways: chronic anabolic adaptation vs. acute inflammatory stress. Ribeiro et al. (2017) reported an increase in PhA, being an example of the anabolic-adaptive pathway. Their high-volume, hypertrophy-oriented protocol is a potent stimulus for increasing muscle mass and intramuscular glycogen storage. Due to the osmotic pull of glycogen (which binds approximately 3-4 grams of water per gram of glycogen), this adaptation leads to a significant expansion of the intracellular water compartment. This increase in ICW reduces electrical resistance (R), while the concurrent strengthening of cell membranes enhances their capacitive properties, increasing reactance. The combination of a lower R and a higher Xc is the direct biophysical cause of an increased PhA (Sardinha & Rosa, 2023). Conversely, the significant decrease in PhA following load-load blood flow restriction training found by Jones et al. (2023) likely highlights the dominance of an acute stress-inflammation pathway. BFR protocols are known to induce a high degree of metabolic stress and local ischemia through the partial occlusion of blood flow (Hwang & Willoughby, 2019). These conditions are known stimuli for inflammatory responses and potential cell membrane micro-damage (Annunziata et al., 2024). Such inflammatory states are directly linked to a reduction in cell membrane capacitance and subsequent fluid shifts to the extracellular space, providing a direct biophysical mechanism for a lower PhA (Silva et al., 2023). Physiologically, this reduces the cell membrane’s ability to function as a capacitor, thereby lowering reactance - a key driver of a lower PhA (Ward & Brantlov, 2023). It is plausible that over the 6 - week period, these acute negative effects on cellular integrity outweighed any chronic hypertrophic adaptations from the low-load stimulus, resulting in a net decrease in PhA. Finally, the absence of significant change in the studies employing low-frequency isometric training (Santisteban et al., 2024) or variable resistance with unclear intensity (Kadhim et al., 2024) suggests a third scenario. In these cases, the training stimulus may be insufficient to induce morphological changes required to alter PhA in a measurable way, in this healthy young population (Lukaski & Talluri, 2023).
Beyond the physiological complexity, the heterogeneity in the findings is likely compounded by methodological limitations within the included literature. A primary concern is the lack of standardisation in BIA technology. Different devices, employing varied frequencies and electrode configurations (e.g., supine vs. standing), are not interchangeable and can produce systematically different PhA values, with high error at the individual level (Tinsley et al., 2019). This should be considered to explain the divergent results obtained. Furthermore, the analytical approach within these studies is a potential source of error; as a recent systematic review emphasises, protocols using generalised equations not validated for athletic populations may lack the sensitivity to accurately capture training-induced adaptations (Campa, Gobbo, et al., 2022). Moreover, the small sample sizes prevalent in the included studies limit the statistical power to detect what may be subtle, yet physiologically meaningful, changes in PhA. Finally, the small number of studies included (n = 4) and their marked heterogeneity in design, participant characteristics, and BIA methodologies precluded any quantitative synthesis, thereby limiting the generalizability of the findings. Therefore, future research should be designed not only to expand the evidence base, but also to test the hypothesis generated by this review directly. Longitudinal studies that simultaneously measure PhA alongside markers of inflammation and cellular hydration are needed to confirm the proposed physiological mechanisms linking different RT protocols to PhA outcomes.
Furthermore, research designed to monitor PhA during periods of functional overreaching could validate its utility as a non-invasive marker of training status and fatigue. Such studies employ standardised BIA protocols and compare different training variables directly (intensity, volume, frequency), using metrics like repetitions-in-reserve to quantify proximity-to-failure. This line of inquiry will be crucial for establishing the actual practical and clinical utility of PhA for optimising RT in healthy young adults.
Collectively, these methodological inconsistencies contribute substantial noise to the evidence base- a conclusion that echoes previous systematic reviews on this topic (Di Vincenzo et al., 2019)- and negatively influence the interpretation of PhA’s responsiveness to RT.
The clinical and practical relevance of monitoring PhA in healthy, trained young adults requires a nuanced interpretation. Given their high baseline values and the associated “ceiling effect”, small training-induced increases in PhA may not be practically meaningful and could fall within the device’s technical error of measurement (Di Vincenzo et al., 2019; Langer et al., 2023; Tinsley et al., 2019). As discussed, excessive training stress can induce an inflammatory response and negative fluid shifts that acutely lower PhA (Annunziata et al., 2024; Silva et al., 2023). Therefore, an unexpected drop in PhA during a training block could serve as a valuable, non-invasive surrogate marker for the onset of non-functional overreaching, excessive inflammation, or inadequate recovery. This shifts the practical focus from simply confirming positive adaptation to proactively identifying a potential negative state, offering a powerful tool for coaches and practitioners to individualise training loads and prevent performance decrements.
CONCLUSIONS
Current evidence on the effects of resistance training on Phase Angle in healthy young adults is limited and characterised by highly heterogeneous outcomes. While a trend suggests that protocols with higher training volumes and intensities may elicit more favourable adaptations, the primary practical implication is that the utility of PhA in this population may not be in tracking small performance gains. Instead, its potential value lies in its use as a non-invasive biomarker for monitoring significant decreases in PhA, which could indicate excessive training stress, inflammation, or inadequate recovery. Therefore, to validate these findings and establish clear guidelines for practitioners, future research is urgently needed. The development of robust, longitudinal randomised controlled trials that employ standardised BIA methodologies to confirm the underlying physiological mechanisms and the practical utility of PhA for guiding resistance training prescription is strongly recommended.

