


 Inglês (pdf)
 Artigo em XML
 Referências do artigo
 Enviar este artigo por email
 Citado por SciELO
  Similares em
SciELO
Similares em
SciELO 
 Permalink
Introduction
Health care has a vulnerability to error.1 Therefore, patient safety is a worldwide concern, as highlighted by the report of the Institute of Medicine.1 Global awareness of patient safety was subsequently addressed by the World Alliance for Patient Safety,2 associated with various initiatives related to this issue.
Human beings naturally tend to ignore or minimize the error,3 mainly due to fear of blame, time pressure, resource constraints, or the perception that error reporting is unnecessary.4 The construction of a culture that counteracts these constraints is complex but crucial for the open and honest error report that makes organizational learning possible.3
The organizational culture is the basis of the safety culture, so the effectiveness in safety problem solving, inherent to the commitment to effective learning, is necessary for effective organizational performance.5 As a dynamic component of health organizations,6 patient safety culture plays a fundamental role in identifying, preventing, and reducing errors to improve patient safety.1
The patient safety culture assessment is an indispensable step that allows investigating the team members’ perceptions regarding patient safety.7 This investigation enables characterizing and identifying strengths and areas that need improvement,8 monitoring the efficacy of implemented changes,9 evaluating the impact of novel initiatives and interventions,10 and internally or externally comparing the metrics obtained,8 to develop and establish a positive safety culture.
In dentistry, this practice encompasses a complex environment since it requires work in teams composed of oral health professionals, who often execute complex technical procedures and interact with several complex instruments and equipment.11 According to Pemberton,12 establishing patient safety in dentistry includes building a robust patient-centered safety culture committed to continuous improvement: Na open culture that interprets errors as opportunities for improvement instead of a culture of blame.12
The literature published worldwide concerning dentistry’s patient safety issues has grown slowly.13 However, the dentistry field has shown concern for improving the safety and quality of care.14 Yet, it needs to actively increase its involvement in the global patient safety movement,15 boosting significant advances in research and raising citizens’ awareness.13
The objectives of this study were to adapt, validate, and analyze the reliability of the Portuguese version of the Medical Office Survey on Patient Safety Culture (MOSPSC) for Portuguese dental care.
Material and Methods
The Dentistry Survey on Patient Safety Culture (DSPSC) was developed for dental care from the Portuguese version of the MOSPSC,16 created by the Health Research and Quality Agency (AHRQ).17 The MOSPSC is a self-administered tool that was elaborated to assess an institution’s patient safety culture, in primary health care, from the perspective of health care providers and other staff.17 Due to the similarity and proximity of the primary care environment to dental care, we considered adjusting the MOSPSC for dentistry.
The MOSPSC was chosen because it can be used to increase the awareness of health care providers and staff regarding patient safety, assess the current status of patient safety culture, identify strengths and areas for improvement in patient safety culture, examine trends in patient safety culture’s changes over time, assess the impact of initiatives and interventions on patient safety culture, and make comparisons within and between organizations.17 Moreover, according to the European Network for Patient Safety (EUNetPaS), the MOSPSC scored higher than any other survey that assesses patient safety culture.18
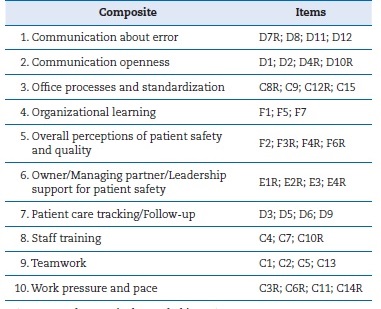
The DSPSC comprises 38 items formulated on a five-point Likert scale, like the MOSPSC.17 These items were grouped into ten composites (Table 1) concerning the dimensions of safety culture in dental practice - the same ten composites as MOSPSC.
Like the MOSPSC, the survey includes other items about patient safety and quality issues, such as accessibility to patient care, patient identification, clinical records and processes, medical equipment utilized, medication, and complementary diagnoses and exams, as well as the exchange of information with other establishments in the health sector.
The survey also contains items to rate a dental clinic in five areas of health care quality (patient-centered, effective, timely, efficient, and equitable) and the overall patient safety.
These three non-composites are part of the MOSPSC but are not considered for statistical analysis. In the general information section, five items were added concerning the number of dental clinic workers, the number of dental offices in the dental clinic, work hours at the dental clinic, work hours per week, the position assigned, and age group. These items were added to characterize the sample and dental clinics.
The items’ five-point Likert scale is answered based on the following: frequency of situations, from “daily” to “not in the past 12 months” and from “never” to “always”; level of agreement, from “strongly disagree” to “strongly agree”; and level of quality, from “very poor” to “excellent.” The items negatively worded (represented by adding R to the label) were reverse coded so that the highest score corresponds to a positive response concerning patient safety.17
After completing the adaptation of the survey to the contexto of dentistry, a panel of six dentistry experts conducted the content validity and semantic analysis. Regarding the ten composites and three non-composites (concerning patient safety and quality issues, information exchange with other settings, and overall ratings on quality and patient safety), no items were added or eliminated; there was only a trivial adjustment of vocabulary and semantics by changing the word “unit” (unidade) to “dental clinic” (clínica dentária) and “chronic-care patients” (doentes crónicos) to “patients” (pacientes).
The panel of experts also considered adapting three specific items. Item 1 (access to care) in section A (patient safety and quality problems) - “a patient is unable to get na appointment within 48 hours for an acute/serious problem” (um doente não pode marcar uma consulta num prazo de 48 horas quando se trata de um problema grave ou sério), was changed to “in an emergency, a patient did not get an appointment within 48 hours” (em caso de urgência, um paciente não conseguiu uma consulta no prazo de 48 horas). Item 13 of section C - “this office emphasizes teamwork in taking care of patients” (a ênfase vai para o trabalho em equipa, de forma a atender os pacientes), was adapted to “teamwork is privileged in the treatment of patients” (é privilegiado o trabalho em equipa no tratamento dos pacientes). Also, item 9 of section D (communication and follow-up) - “we follow up on patients who need monitoring” (fazemos seguimento aos doentes que necessitam de monitorização), was changed to “we follow up patients after major surgical/prosthodontic interventions” (fazemos acompanhamento dos pacientes após grandes intervenções cirúrgicas/prostodônticas).
Regarding the background section concerning general information, the panel of experts considered adding two questions regarding the number of workers and dental chairs in the dental clinic.
Subsequently, the pre-test was applied to a sample of seven individuals from the target population: a dentist, a dental hygienist, a dental assistant, a top manager, a patient manager, a receptionist, and a telephonist. These individuals did not identify the need for any adjustments or changes in the survey.
Then, the final version of the survey was electronically applied using a previously created link. The survey administration period occurred between January and March 2021.
The convenience sample of respondents consisted of dentists, dental hygienists, dental assistants, managers, patient managers, and front office staff (including receptionists and telephonists) from dental clinics in Portugal. Twenty dentists and the Portuguese Dental Hygienist Association were informed about the study and asked, via email, to participate and share the survey with staff at the dental clinics where they work and colleagues. After their acceptance, the survey sharing started.
The survey contained a request for the respondent to share it with colleagues or Portuguese dental clinics. Furthermore, it reminded that if the respondents worked in more than one dental clinic, they should respond based on the clinic where they worked the highest number of hours weekly.
The Ethics Committee of the Faculty of Dental Medicine of the University of Lisbon approved this study. After an authorization request via email, the authors of the Portuguese version of MOSPSC16 authorized its use to be adapted and validated for the dentistry context.
All participants included in the study gave electronic informed consent. They also had access to a written explanation of the study’s objectives and justification. The investigation preserved the confidentiality of the information, and the survey did not request the respondents’ names or personal data. Participation was voluntary, free, and unpaid.
The internal consistency reliability was analyzed using Cronbach’s alpha, in which values greater than 0.7 indicate adequate reliability.19 The average inter-item correlation (AIIC) was also used since it corresponds to a direct measure of internal consistency, and the values should be between 0.15 and 0.5.20 This statistical analysis was performed using the SPSS program (Statistical Package for Social Sciences) version 26.
The model quality assessment aimed to assess how well the theoretical model was capable of reproducing the correlational structure of manifest variables (items) in the study sample.17
Confirmatory factor analysis (CFA),21 within the framework of structural equation modeling (SEM), was used to assess the quality of adjustment of the model associated with the theoretical model.22A coefficient lower than 0.1 represents a low effect, around 0.3 a medium effect, and equal to or greater than 0.5 a large effect. All items should have values greater than 0.2.
Since the data was ordinal, a polychoric correlation matrix was used to analyze the CFA and a Varimax rotation, where the diagonal weighted least square (DWLS) method was used to estimate the model parameters. The CFA fit indexes used in this investigation were selected based on the indexes most reported in the literature, usually in SEM applications, and are described below. The quotient between chi-square and the number of degrees of freedom (χ2/df) indicated that the adjustment was good if the quotient was lower than 2, acceptable if lower than 5, and unacceptable if greater than 5.23 The goodness-of-fit index (GFI)(21) explained the proportion of the covariance observed among the manifest variables (items), according to the adjusted model: GFI values below 0.9 indicate models with poor adjustment to the data, between 0.9 and 0.95 a good adjustment, and above 0.95 a very good adjustment. The comparative fit index (CFI)24 was calculated to correct the potential underestimation with small samples; values below 0.9 indicate a bad adjustment, between 0.9 and 0.95 a good adjustment, and greater than or equal to 0.95 a very good adjustment. The Tucker-Lewis index (TLI)25 was also used; it varies between 0 and 1, and values close to 1 (>0.95) indicate a very good adjustment. Parsimony GFI (PGFI)26 was obtained to compensate for the “artificial” improvement of the model that was achieved simply by including more parameters.
A more complex model may have a better adjustment than a simpler (parsimonious) model. PGFI values below 0.6 indicate a bad adjustment, between 0.6 and 0.8 a reasonable adjustment, and above 0.8 a good adjustment.
The root mean square error of approximation index (RMSEA) was performed to compensate for the potential improvement of the adjustment of the model by the simple addition of more parameters.27 The fit of the model is inappropriate when the RMSEA value is greater than 0.1, medíocre between 0.08 and 0.10, good between 0.05 and 0.08, and very good when below 0.05. Statistical analysis was conducted using the software R (version 4.0.3) and the Lavaan and semPlot libraries.
Results
The number of respondents varied in each item of the survey. The sample of dimension n=237 was subjected to an analysis of missing values, where all individuals with missing answers were removed and the answers “does not apply or don’t know” were replaced by the middle answer on the 5-point Likert scale. The subsequent final sample had 143 participants.
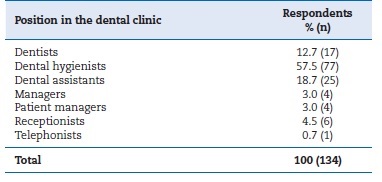
As for the position performed in the dental clinic, most respondentes were dental hygienists (57.5%; n=77) (Table 2).
The reliability analysis was performed using Cronbach’s alpha in the ten composites (Table 3). The survey obtained a Cronbach’s alpha of 0.93. All composites had a Cronbach’s alfa greater than 0.5. The “teamwork” composite reached the highest value (Cronbach’s α=0.86), and the “office processes and standardization” composite the lowest (Cronbach’s α=0.51). Regarding AIIC, only the organizational learning (AIIC=0.62), “patient care tracking/follow-up” (AIIC=0.51), and “teamwork” (AIIC=0.60) composites had values outside the recommended range. Both coefficients demonstrated a good overall consistency.
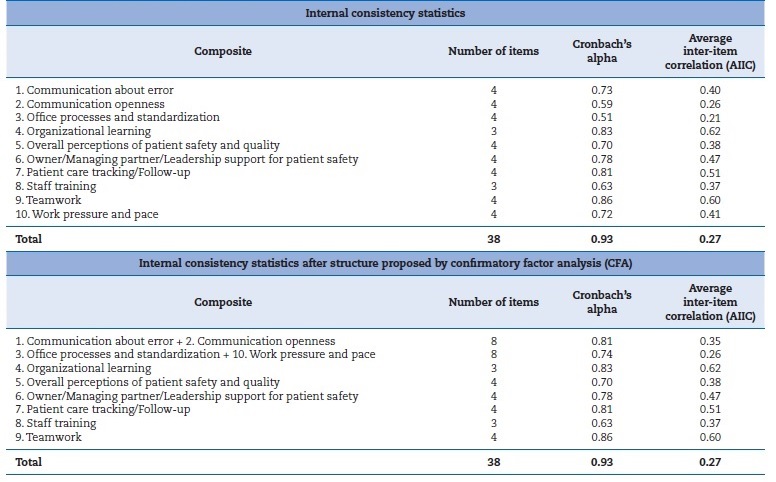
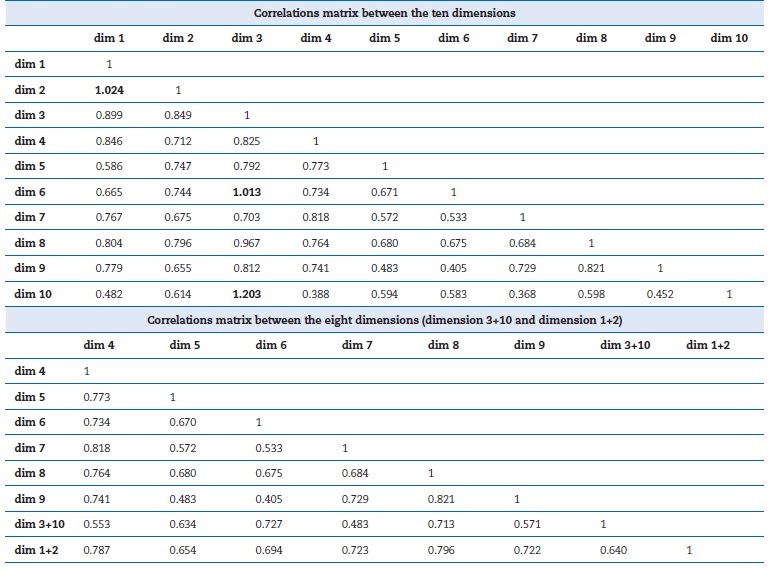
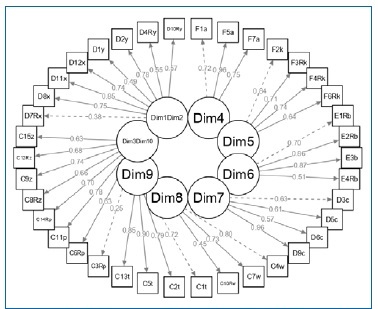
The theoretical model was implemented, but a positive undefined covariance matrix was obtained (covariance matrix determinant equal to zero), not allowing the subsequent analysis.17 Thus, the correlation matrix between the dimensions was analyzed (Table 4). It revealed that the correlations between dimensions 2 and 1, 6 and 3, and 10 and 3 were greater than 1. Various approaches were tested to overcome the issue, from removing dimensions one by one or joining the items that correlate in a single dimension to verify the impact on the covariance matrix. The solution that produced a positive defined covariance matrix was joining dimensions 2 and 1 and dimensions 3 and 10; Table 4 shows the correlation matrix. The internal consistency coefficients for the CFA-proposed new structure were obtained (Table 3), and all dimensions achieved a Cronbach’s alpha greater than 0.6. Figure 1 represents the CFA-proposed model in the form of a path diagram. Arrows represent the relationship between factors or dimensions (in circles) and items (in squares). The coefficients on the arrows are the factors loadings (or eigenvalues) that show the strength of those relationships. All coefficients were higher than 0.2 and ranged between 0.25 and 0.96. The CFA model fit indexes for the model proposed were obtained (χ2/df=5.633; CFI=0.892; GFI=0.9; TLI=0.881; PGFI=0.67; RMSEA=0.181; p<0.001; 90% CI RMSEA [0.175;0.186]).
Discussion
The safety culture assessment is an indispensable step in all health areas, as it makes it possible to raise the staff awareness regarding patient safety, identify the current state, strengths, and improvement areas of the safety culture, and evaluate the impact of the initiatives implemented in the patient safety context. It also allows an internal and external benchmarking of their results.8,28
In dentistry specifically, literature concerning patient safety culture has grown internationally, albeit slowly.13 Still, most existing literature has come mainly from England and the United States.13 Precisely, the only two studies11,29that have so far evaluated the patient safety culture using the MOSPSC instrument were carried out in the United States, and only one of those adapted the survey to the dentistry context.29
Until now, the DSPSC is the first survey for dental care in Portugal that has undergone an adaptation, validation, and reliability analysis. The DSPSC has achieved good overall consistency.
The “teamwork” dimension reached the highest values on internal consistency measures, while “office processes and standardization” had the lowest.
In the scope of the investigation of construct validity, the model proposed by the CFA corresponded to joining dimensions 1 (“communication about error”) and 2 (“communication openness”) and dimensions 3 (“office processes and standardization”) and 10 (“work pressure and pace”). As shown in Figure 1, all coefficients, or factors loadings, were higher than 0.2, suggesting that no item should be removed from the model.
In the CFA-proposed new structure, dimension 1+2 (Cronbach’s α=0.81; AIIC=0.35) and dimension 3+10 (Cronbach’s α=0.74; AIIC=0.26) obtained better coefficients of internal consistency, and the good overall consistency was maintained.
As for the CFA model fit indexes, the analysis indicated that the proposed model has a moderate overall fit considering the present sample. Specifically, the χ2/df index obtained na unacceptable fit (χ2/df=5.63), GFI and CFI showed a good adjustment (GFI=0.90; CFI=0.90), TLI and PGFI indicated a reasonable result (TLI=0.88; PGFI=0.67), and RMSEA an inappropriate model adjustment (RMSEA=0.18; p<0.001; 90% CI RMSEA [0.175;0.186]). Thus, the model should be the subject of a more detailed analysis to improve its quality. However, it is relevant to consider that the sample size is small, which could bias the results, representing a limitation of the study.
Another limitation of the study corresponded to the number of missing values, possibly justified by the length of the survey, which may have led to tiredness when filling it out.
The answers were not mandatory, according to the original survey recommendations,17 and the lack of literacy in completing it in a web-based format may also explain the number of missing responses. Nevertheless, the present study constituted a foundation for a more detailed statistical analysis in larger samples.
Conclusions
The present study was innovative since no previous attempt to adapt a data collection instrument (specifically, a survey) that assesses patient safety culture in dental care in Portugal was identified. Thus, it contributed to a possible tool development with the potential to promote research on this matter in Portugal.
The DSPSC, based on the Portuguese version of the MOSPSC, resulted in eight dimensions, which achieved good reliability and moderate construct validity. Its structure was modified, differing from the original model, by joining two pairs of dimensions.
In future studies, we plan to increase data collection and conduct a more detailed statistical analysis to raise the quality of the proposed model.

