Introduction
Cephalometric analysis has been playing for long a fundamental role in the diagnosis, treatment planning, and evaluation of dental and skeletal changes in orthodontic patients.
Since the 1980s, computer-guided cephalometric analysis has been of special interest, reflected by the increasing number and quality of related scientific publications.1 In addition to its space- and time-saving qualities, this procedure is user-friendly, eliminates the measurement error inherent in an operator using a ruler or protractor, and has demonstrated suitable accuracy.2-6
Meanwhile, handheld devices have also shown applicability in the medical field, namely in diagnosis, monitoring, and communication with patients, usually through the use of apps - downloadable small-scale software applications.7,8Likewise, apps with applicability in orthodontics are now available9,10 and may be of special interest to clinicians working in various clinical settings.
OneCeph (NXS, Telangana, India) is a free-of-charge cephalometric analysis app for Android operating systems. This software allows users to perform, save, and export measurements for 15 pre-programmed and commonly used cephalometric analysis sets and, in addition, customize a “favorite” analysis using the available variables.
The term accuracy was defined by ISO 5725-1 as describing the closeness between a test result and the accepted reference value, which involves a combination of random and bias components. The bias component is quantified by the method’s trueness - the closeness of agreement between the average value from multiple observations and an accepted reference value. The random component is quantified by the method’s precision considering its repeatability (same test conditions) and reproducibility (different test conditions, e.g., different operators or equipment). Published reports on the accuracy of cephalometric tracing apps are scarce and include conditions that vary with the software version, display device, screen size, use of a landmark identification instrument, and reference tracing method.11-14
A recent paper14 published accuracy results for cephalometric analysis with OneCeph, reporting a single-examiner experiment on a Samsung Galaxy S8 smartphone with a 5.8” screen (2960x1440). The lowest repeatability estimates (intra- class correlation coefficients, ICC) were registered for lower incisor protrusion, mandibular plane angle, upper incisor protrusion, and lower incisor inclination (ICC [95% confidence interval]: 0.647 [0.451, 0.784], 0.658 [0.466, 0.791], 0.701 [0.529, 0.818], and 0.867 [0.778, 0.922], respectively). On the other hand, high repeatability (ICC>0.9) was registered for SNA, SNB, ANB, upper incisor inclination, and interincisal angle. The authors also reported high reproducibility for all cephalometric variables when comparing the OneCeph method with the chosen reference standard on a 13.5” (2256x1504) computer screen. In terms of trueness, the authors reported statistically significant differences - although hardly clinically significant - for the mandibular plane angle (1.5º mean increase), upper incisor protrusion (-0.4 mm), lower incisor protrusion (-0.5 mm), and inter-incisal angle (+1.2º).
Using larger display screens or a stylus has been suggested as potentially enhancing app-based cephalometric analysis.14 Following previously published findings, the main purpose of this study was to assess the trueness and precision of
OneCeph on a smartphone screen using a stylus pen and on a computer screen using an optical mouse, having NemoCeph set as the reference standard. Additionally, the method’s efficiency was assessed by comparing the tracing time between techniques.
Material and Methods
This study evaluated pretreatment lateral cephalograms performed at (anonymized) using an Orthoralix 9200 2D Digital Pan Ceph (Gendex, Hatfield, EUA) between October 2016 and July 2018. Selection criteria included digital radiographs with a 2429x2121 resolution showing permanent dentition in maximum intercuspation. Images were excluded from the sample if the machine lateral poles did not overlap or any relevant structures had been cropped out. No modifications were made to the images, and a single examiner performed the cephalometric analysis with maximum screen brightness on the laptop and smartphone. The cephalograms were plotted using a single method randomly selected per day, and this process was repeated a week later for the second method and two weeks later for the third method (T1). Thus, 6 weeks were needed to retrace all cephalograms with each method (T2). A total of 18 anatomical landmarks (Figure 1) and 13 cephalometric variables were selected according to Steiner’s analysis15 and tested with each method on a training set of 12 lateral
cephalograms. The (anonymized) Ethics Review Board approved this study.
The cephalometric analysis technique performed at the orthodontic graduate clinic was selected as the reference method (NemoCeph software, 2017, Nemotec, Madrid, Spain). This analysis was performed on a laptop computer (Lenovo™ ideapad 320) with a 14” HD (1366x768) display and an optical mouse (Qilive CP-1485). OneCeph (beta 7) was used for cephalometric analysis on a smartphone (Samsung A5, Samsung Telecommunications, Suwon, South Korea) with a 5.2” (1920x1280) display. A capacitive stylus touch pen with a 2-mm diameter tip and a 6.8-mm diameter transparent disk was used for landmark identification. OneCeph was also used on the computer through a screen-sharing software (VysorPro 2.1.7, Google Commerce, Seattle, Washington). In this case, the computer setup was the same as for the computer tracing method.
A literature search was conducted on European cephalometric norms, and the standard deviation values of relevant variables were registered. The minimum sample size (n=34) was determined for a 0.5 effect size, 80% power, and 5% alpha (G*Power 3.1.9.2) to detect a clinically significant difference of 3.50º - half the highest standard deviation value registered for U1/NA.16 Statistical analysis was performed using SPSS 25 software (IBM, Armonk, NY, USA). Precision was explored by computing point and 95% confidence interval estimates for the inter-session (repeatability) and inter-method (reproducibility) ICCs by a two-way mixed effects model, single measures, and absolute agreement. Kolmogorov-Smirnov tests were applied to verify normality before assessing trueness with paired Student’s t-tests or Wilcoxon signed rank tests accordingly. The significance level was set at 0.05.

Figure 1 Description of the landmarks and measurements used in the study. Sella (S): Center of sella turcica radiographic outline. Nasion (N): Most anterior midline point on the frontonasal suture. Subspinale (Point A): Deepest midline point on the anterior outline of the maxilla. Supramentale (Point B): Deepest midline point on the anterior outline of the mandible. Point D: Center of the radiographic outline of the mandibular symphysis. Upper molar point (U6): Most superior and anterior cusp tip of the upper first permanent molar. Upper premolar point (U4): Most superior and anterior cusp tip of the upper first permanent premolar. Gonion (Go): Most posterior and inferior point on the angle of the mandible. Gnathion (Gn): Midpoint between the most anterior and inferior points on the mandibular symphysis. Upper incisor apex (U1a): Most apical point of the most prominent maxillary central incisor. Upper incisor edge (U1e): Most incisal point of the most prominent maxillary central incisor. Lower incisor apex (L1a): Most apical point of the most prominent mandibular central incisor. Lower incisor edge (L1e): Most incisal point of the most prominent mandibular central incisor. Collumela (Cm): The midpoint between Subnasale and the nasal tip. Soft tissue Pogonion (Pog´): Most anterior midline point of the soft tissue chin. Labrale superius (UL): Most anterior midline point of the upper lip. Labrale inferius (LL): Mostanterior midline point of the lower lip. Pogonion (Pog): Most anterior midline point of the mandibular symphysis. SNA(º): the angle between Sella (S), Nasion (N), and A point; SNB(º): the angle between S, N, and B point; ANB(º): the angle between A, N, and B points; SND(º): the angle between S, N, and D points; UINA(º): the angle between the axis of the upper incisor (U1e-U1a) and NA line; LINB(º): the angle between the axis of the lower incisor (L1e-L1a) and NB line; GoGn/SN(º): the angle between the mandibular line (Go-Gn) and SN line; OL/SN(º): the angle between the occlusal line (U6-U4) and SN line; UINA (mm): the distance between the upper incisor edge and NA line; LINB (mm): the distance between the lower incisor edge and NB line; PogNB (mm): the distance between Pog and NB line; UL (mm): the distance between labrale superius and S line (Pog’-Columella, Cm); LL (mm): the distance between labrale inferius and S line.
Results
Table 1 describes the means and standard deviations for cephalometric measurements and tracing time by session and method. Table 2 shows the trueness analysis results. Statistically significant differences were found between both test methods and NemoCeph for variables ANB (smartphone, -0.3±0.68; computer, -0.3±0.52), occlusal plane angle (smartphone, -1.1±2.68; computer, -2.0±2.98), and mandibular plane angle (smartphone, -0.5±1.27; computer, -0.8±1.56). Additionally, the lower lip measurement showed a statistically significant increase with smartphone tracing (0.3±0.57), while SNB (0.5±1.19) and SND (0.5±1.08) showed a significant increase in the computer OneCeph method. Figure 2 shows that the OneCeph tracings on the smartphone and computer produced, overall, a similar count of outlier observations, except for the inclination of the upper incisor, which only registered a relevant number of positive outliers for the smartphone analysis.
Table 1 Descriptive statistics for tracing time and cephalometric measurements by method and session. SD, standard deviation; min, minimum; max, maximum.
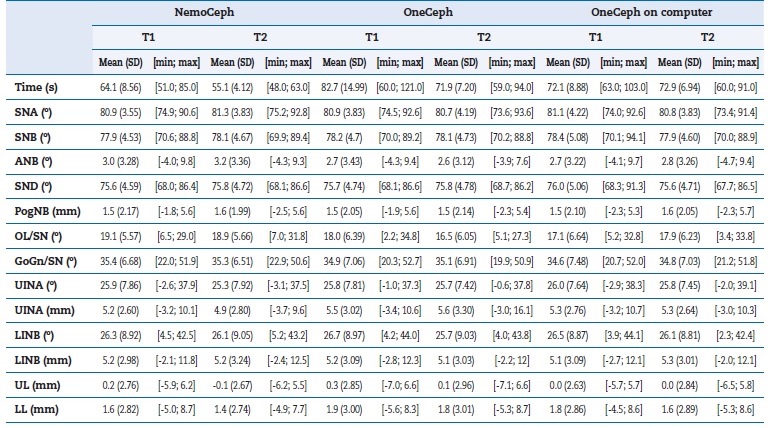
Table 2 Time and trueness analysis - descriptive statistics for method bias and comparison results obtained with paired Student’s t-tests/Wilcoxon tests on T1 data. SD, standard deviation.
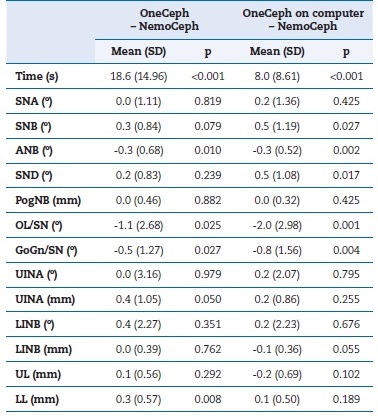
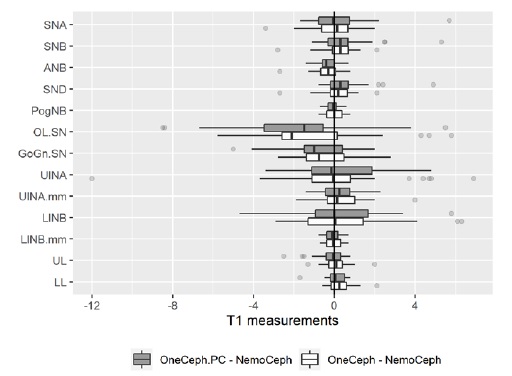
Figure 2 Trueness analysis - clustered boxplots for method bias by cephalometric variable, on T1 data
Statistically significant differences regarding tracing time were found for OneCeph both on the smartphone and computer (p<0.001). Tracing time was significantly longer and more variable on the phone (18.6±14.96), with an average increase of 29% compared to NemoCeph. Although OneCeph tracings on the computer had a shorter tracing time, they still showed a statistically significant mean increase of 12% (8.0±8.61) compared to the reference method.
In terms of reproducibility (Table 3), the occlusal plane registered the lowest ICC estimates for both the smartphone (ICC [95%CI]: 0.888 [0.773, 0.944]) and the computer (ICC [95%CI]: 0.842 [0.583, 0.931]) OneCeph cephalometric analyses, with all other cephalometric measurements registering values above 90%. As for the method’s repeatability (Table 4), intraclass correlation coefficients revealed OL/SNº as the least repeatable variable for NemoCeph (ICC:0.916; 95%CI [0.839, 0.957]) and for OneCeph on the computer (ICC:0.929; 95%CI [0.860, 0.965]). On the smartphone, OL/SN also registered low repeatability (ICC:0.889; 95%CI [0.739, 0.950]), only second to the linear variable UINA (ICC:0.831; 95%CI [0.687, 0.912]). Graphically, it seems that NemoCeph presented less T2-T1 variability, considering the lowest frequency of outlier observations (Figure 3). The linear variables presented similar variability between methods.
Table 3 Precision analysis: intra-class correlation coefficients regarding method reproducibility on T1 measurements. ICC, intra-class correlation coefficient; 95% CI, 95% confidence interval.
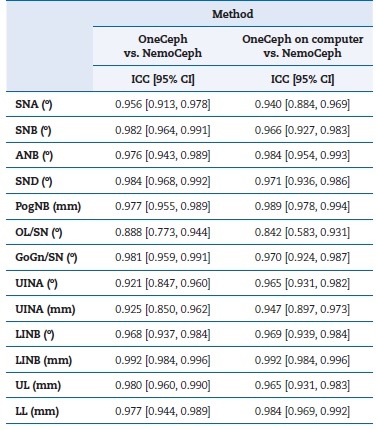
Table 4 Precision analysis: intra-class correlation coefficients regarding method repeatability (T1 vs T2). ICC, intra-class correlation coefficient; 95% CI, 95% confidence interval.
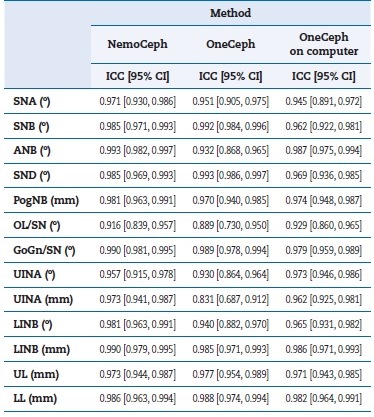

Figure 3 Precision analysis - clustered boxplots of T2-T1 differences by cephalometric variable and method.
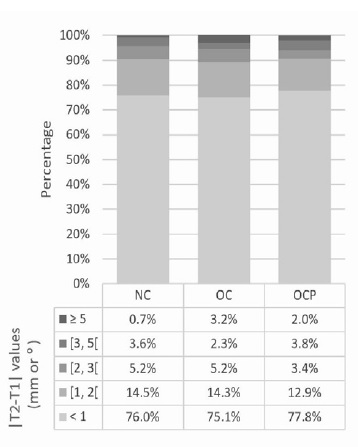
Additionally, the outlier analysis revealed that the highest T2-T1 values were obtained with OneCeph on the smartphone for variables including the A-point. These discrepant observations were considered relevant for the present study and, as such, were included in the analysis. Finally, when all cephalometric measurements were considered (Figure 4), OneCeph on the computer registered a higher frequency of inter-session differences below 1 degree/mm compared to the reference (77.8% vs. 76.0%). On the other hand, smartphone analysis produced the highest inter-session differences, with 3.2% of measurements corresponding to differences above 5 degrees/mm, compared to only 0.7% of cases
Discussion
This study aimed to assess the accuracy of a cephalometric analysis app used in two input setups: a smartphone and a computer. Overall, both methods showed clinically acceptable results considering bias and random-error analysis compared to the reference method, as well as acceptable repeatability results. Regarding trueness analysis, although statistically significant differences were registered, these were not considered clinically significant, considering the magnitude of each cephalometric variable. Livas,14 who compared OneCeph smartphone tracing with a computer program, also reported statistically significant differences regarding the method’s bias, namely for the mandibular plane inclination, upper incisor protrusion, lower incisor protrusion, and interincisal angle.
The present study only found significant bias in the smartphone method associated with the occlusal and mandibular plane inclinations. Additionally, it registered lower mean differences for these variables in smartphone tracings, which may be explained by methodological differences, such as using a stylus, as explained below.
Regarding the ICC estimates, while some papers define acceptability above 0.75 or 0.8,17 others generally follow the classification cited by Koo & Li,18 where values between 0.75 and 0.9 indicate good reliability and values greater than 0.90 indicate excellent reliability. However, whether an ICC value is good enough should depend on the intended use of the method,19 and what may be considered acceptable in sociological and behavioral research may not be sufficient in medical research,20 especially considering intra-rater repeatability on cephalometric measurements. Therefore, this study considered a more conservative threshold. Following previous criteria used in sports science and medicine, the authors considered ICC point estimates ‘high’ over 0.9, ‘moderate’ between 0.8 and 0.9, and ‘insufficient’ below 0.8.21 OneCeph methods displayed high reproducibility for all cephalometric measurements except OL/SN, where point estimates decreased both on smartphone and computer OneCeph tracings, despite remaining above the 0.8 threshold. These results are in line with the study by Livas,14 although the occlusal plane was not included in their analysis. The comparison of ICC estimates across test methods by cephalometric variables showed no tendency to favor either setup.
Regarding repeatability, high ICC estimates were registered for all variables measured with NemoCeph and OneCeph on the computer. The smartphone tracings, however, showed moderate repeatability for UINA (mm). The authors confirmed that by removing an outlier observation from the data, this ICC estimate increased to 0.964, which agrees with previously published results.14 The outlier analysis for repeatability found the highest differences with OneCeph on a smartphone for variables including the A-point. Upon further investigation, a gross identification mistake performed during smartphone tracing was detected for this landmark. During landmark identification on the smartphone, because the cephalogram is magnified and not completely visible on screen, the user has to drag the image around to locate the next landmark; this may have resulted in the outlier observation if the correct structure remained cropped out of the screen. This finding was included in the data analysis as it may be related to the tracing technique itself and, therefore, serve to alert readers to a possible disadvantage of using handheld devices for cephalometric analysis.
Overall, the effect of image magnification on the accuracy of digital cephalometric analysis has not been described in the literature, possibly due to the inherent difficulty in quantifying it and because it most likely depends on several factors such as screen size, operator, cephalometric landmark, and an eventual interaction between these. Besides stating whether magnification was performed during analysis, authors should also state the cephalogram image resolution, which, when provided with the screen resolution, indicates if more information would be visible upon magnification. For instance, the present sample involved cephalograms with a 2429x2121 resolution, traced either on a 1920x1280 smartphone or a 1366x768 computer screen; with this setup, not all image data is visible if either screen shows the entire cephalogram. Besides, cephalometric software usually includes horizontal and/or vertical toolbars that absorb screen space. Nevertheless, the amount of clinically relevant information in each pixel also depends on machine-related factors, some of which may be improved by the operator.22 Thus, tracing time could be improved by using larger display screens for cephalometric analysis so that magnification would not be necessary.
However, the present version of NemoCeph software includes both automatic magnification and image repositioning so that the examiner does not have to drag the image around.
This feature showed a clear positive impact on shortening tracing time and may enhance cephalometric measurements’ repeatability based on the lower frequency discrepancies above 5 degrees/mm. The operator’s previous familiarity with NemoCeph software might have also contributed to these results.
Another factor that may have interfered with the OneCeph methods’ accuracy, and has not yet been described in the literature, is the type of pointer used for landmark location. The app displays an opaque circle shape to pinpoint the landmark after its identification and allows the user to make immediate corrections before accepting its position and continuing the analysis. The size of this marker may not remain constant in different magnifications, and during the analysis, the marker may easily approach the equivalent of 2 mm in diameter on the cephalogram scale. Although this has little to do with the examiner’s incorrect location of the point when the landmark is first identified, it can affect error detection.
For landmark identification on the smartphone, a capacitive stylus was chosen due to its low cost and compatibility with touch screens, deeming it suitable for most smartphones and tablets.23 The tip design was selected to favor accuracy, as an alternative to capacitive styli with larger soft rubber tips. Other options, including finer, ball-point pen-like tips, are limited to compatibility with specific models of handheld devices, meaning the input framework was evaluated and modified to allow for active pen input.24 Despite the selection of the thinnest compatible tip, its 2-mm diameter may have incorporated errors that may have remained unidentified within the circle marker. This rationale may explain why tracing in OneCeph through the computer resulted in slightly better repeatability
results since the identification was performed with the tip of the cursor. However, the use of screen-sharing software, even in its highest quality settings, may affect the image resolution or quality, not detailed by the manufacturers; this may have somehow affected tracing accuracy in this study.
Although the general results of the OneCeph app for cephalometric analysis in orthodontic practice seem favorable, cephalometric values should always be subject to clinical judgment alongside the radiograph and be regarded solely as an auxiliary tool for patient diagnosis.
The design chosen for the study involved treating cephalometric measurements directly as dependent variables, which favors more clinically relevant results. It has been shown that each landmark presents a non-random distribution of identification errors,25 and this was not further explored in this study. However, an additional step in which the landmarks would have to be manually re-identified through software for coordinate pair attribution would likely imply additional operator error. A study design involving more than one examiner and more than two tracing sessions could have produced more relevant results, although impacting its feasibility.
Conclusions
OneCeph demonstrated adequate accuracy and efficiency both on smartphone and computer interfaces. Although its use in cephalometric analysis seems suitable in orthodontic clinical practice, clinical judgment is critical when interpreting the measurement output, especially if landmark identification is performed on handheld devices, which may result in a higher frequency of gross landmark identification errors.


