Introduction
Abdominal aortic aneurysms (AAAs) are mostly asymptomatic and detected during physical examination or ultrasound and, when rupture occurs, still remain an important cause of death worldwide.1,2,3 The only established treatments for AAAs are endovascular aneurysm repair (EVAR) or open surgical repair (OSR). Compared to OSR, EVAR is a less invasive treatment with lower perioperative mortality and morbidity, shorter hospital stays and faster recovery.4,5 Nonetheless, higher device costs, higher re-intervention rates and the need of lifelong follow-up, may compromise the advantages of EVAR.6 So, it is important to identify patients at increased risk of dying from nonaneurysm-related causes and therefore those that are not likely to survive long enough to benefit from elective EVAR.2 Current European Society for Vascular Surgery (ESVS) Guidelines for the management of aortoiliac aneurysms and National Institute for Health and Care Excellence (NICE) Guidelines for the diagnosis and management of AAA do not recommend the use of existing scoring systems for decision making.7,8,9 Indeed, NICE Guidelines authors highlighted that the existing tools would not improve decision-making and could potentially lead to inappropriate decisions about patients’ management.9 However, the validation and implementation of a scoring system might be of importance when we keep in mind the high cost of treatment due to postoperative complications. Charlson Comorbidity Index (CCI) is the most widely validated and used comorbidity assessment tool in research being used in outcome and mortality studies but also being correlated with disability, readmission and length of stay.10,11,12 This index addresses multiple19 comorbidities by creating a weighted total score based on the presence of different patient conditions. Originally developed in 1987, CCI was modified by Charlson in 1994 to age-adjusted Charlson Comorbidity Index (CCIa) which includes patient´s age as a correction variable of the final score of CCI index.10,12,13 There are many studies proving CCI and CCIa value as predictors of mortality for a variety of conditions including cancer, stroke, acute mesenteric ischemia, coronary artery bypass grafting and COVID-19 patients.14,15,16,17,18
Despite its approval in other vascular disorders, CCIa has not yet been specifically validated for use in asymptomatic patients submitted to elective EVAR. The present study aim is to access whether CCIa score relates to poor prognosis (morbidity and mortality) in asymptomatic patients submitted to elective EVAR and determine a cutoff value for CCIa associated with worst outcomes.
Materials and methods
This was a single-center retrospective study of asymptomatic patients submitted to elective EVAR between January 1, 2017 and December 31, 2021 at our tertiary, academic Vascular Surgery department. Exclusion criteria were as follow: female sex, previous aortic surgery, concomitant aortic dissection, ruptured aneurysms, presence of thoracoabdominal aneurysms, pseudoaneurysms, isolated iliac aneurysms and patients who underwent OSR. Patient’s data collection method was supported by hospital reporting system and introduced into a database created for the purpose (Microsoft Excel). We measured comorbidity burden using CCIa according to the absence or presence of the following conditions: myocardial infarction (1 point), peripheral vascular disease (1 point), congestive heart failure (CHF) (1 point), cerebrovascular disease (CVD) (1 point), dementia (1 point), chronic pulmonary disease (CPD) (1 point), connective tissue disease (1 point), peptic ulcer disease (1 point), mild liver disease (1 point), diabetes without end-organ damage (1 point), diabetes with end-organ damage (2 points), hemiplegia (2 points), moderate or severe renal disease (2 points), any solid tumor without metastasis (2 points), leukemia (2 points), lymphoma (2 points), moderate or severe liver disease (3 points), metastatic solid tumor (6 points), and acquired immunodeficiency syndrome (AIDS) (6 points). CCI score results from the sum of all points obtained by each previous condition and age-correction was achieved adding 1 point in patients aged 41-50 years, 2 points for those aged 51-60 years, 3 points for those aged 61-70 years and 4 points for those 71 years or older. The assigned value for peripheral vascular disease (1 point) was not incorporated in the patient ́s final score since it was by definition present in all patients. Besides each one of the previous conditions, the following information was obtained: body mass index (BMI), dyslipidemia, hypertension and current smoking status, maximum anteroposterior AAA diameter, contrast volume administrated during EVAR and fluoroscopy duration, hospital length of stay, surgical complications, early and overall mortality. Postoperative complications were defined in accordance with Clavien-Dindo classification (CDC). The study was completed in March 31, 2022, and the minimum follow-up was 6 months for all patients included.
Statistical analysis was performed in association with Technology and Information Department of Centro Hospitalar e Universitário de Coimbra using SPSS Statistics 25 Software (IBM, Armonk, New York) with a significance level of .05. Continuous variables are presented as mean ± standard deviation or as medians with interquartile range (IQR), depending on distribution after testing with Shapiro-Wilk test, and compared between the two groups with the Mann-Whitney test. Dichotomous variables are presented in numbers and percentages and compared between the two groups with Pearson Chi-Square or Fisher ́s Exact Test where appropriate. Predictors of complications and survival were analyzed using Cox. The area under the curve (AUC) of the receiver operating characteristic curves (ROC) was calculated to validate and determine the discriminating ability of CCIa in predicting complications and mortality. Youden index was used to determine the critical value. The maximal Youden Index identifies the optimal threshold when sensitivity and specificity are maximized, and this maximal value is the “knee” of the ROC curves for each the AUC is reported. It is also the threshold that maximizes odds ratio in logistic regression modelling. Survival analysis were performed with the Kaplan-Meier method and differences between survival curves were tested with the Log-Rank test.
RESULTS
After checking inclusion and exclusion criteria, 123 patients were eligible to our study. All patients included were men and the median age was 73.49 ± 7.95 years. All aneurysms were asymptomatic and it´s median size at the time of EVAR was 6.36 ± 1.33. The most common comorbid conditions were, in decreasing order: overweight or obesity (87%, only assessed in 69 patients, and classification criteria according to the World Health Organization (WHO) classification (18)), hypertension (81.3%), dyslipidemia (75.6%), current or previous smoking (58.5%), MI (22.8%), DM (21.2%) and COPD (20.3%). Table 1 reports all these results as well as other data collected: comorbidities included in CCIa (definition used agrees with published literature (20)), serum creatinine, albumin and lactate dehydrogenase (LDH) previous to surgery, contrast volume administered and fluoroscopy duration during EVAR, complications classified according to CDC and mortality. The median length of stay was 3.97 ± 4.64 days and the mean follow-up period 30.55 ± 16.49 months. In the total cohort the median CCIa was 4.6 ± 2.03 ranging from 1 to 11, 30-day complication rate was 16.3%, 30-day mortality 1,6% and overall mortality 16.3%.
Table 1 Baseline characteristics of asymptomatic patients undergoing EVAR from January 2017 to December 2021
| Characteristics | Sample | n |
|---|---|---|
| Age - y | 73.49 ± 7.95 | 123 |
| BMI - Kg/m2 | 69 | |
| ≤ 24.9 | 9 (13) | |
| 25-29.9 | 26 (37.7) | |
| ≥ 30 | 34 (49.3) | |
| Hypertension | 100 (81.3) | 123 |
| Dyslipidemia | 93 (75.6) | 123 |
| Diabetes without chronic complication | 13 (10.6) | 123 |
| Diabetes with chronic complication | 13 (10.6) | 123 |
| Congestive heart failure | 16 (13) | 123 |
| Myocardial infarction | 28 (22.8) | 123 |
| Cerebrovascular disease | 23 (18.7) | 123 |
| Mild Liver Disease | 8 (6.5) | 123 |
| Moderate or Severe Liver Disease | 0 (0) | 123 |
| Chronic kidney disease | 13 (10.8) | 120 |
| Chronic pulmonary disease | 25 (20.3) | 123 |
| Smoking history | 69 (58.5) | 118 |
| Dementia | 1 (0.8) | 123 |
| Hemiplegia | 0 (0) | 123 |
| Peptic Ulcer Disease | 6 (4.9) | 123 |
| Connective Tissue Disease | 2 (1.6) | 123 |
| Solid tumor without metastasis | 10 (8.1) | 123 |
| Leukemia | 3 (2.4) | 123 |
| Lymphoma | 0 (0) | 123 |
| Metastatic solid tumor | 0 (0) | 123 |
| Acquired immune deficiency syndrome | 1 (0.8) | 123 |
| Characteristics | Sample | n |
| CCIa | 123 | |
| 1 | 1 (0.8) | |
| 2 | 12 (9.8) | |
| 3 | 29 (23.6) | |
| 4 | 29 (23.6) | |
| 5 | 15 (12.2) | |
| 6 | 19 (15.4) | |
| 7 | 8 (6.5) | |
| 8 | 2 (1.6) | |
| 9 | 3 (2.4) | |
| 10 | 4 (3.3) | |
| 11 | 1 (0.8) | |
| Aneurysm diameter - cm | 6.36 ± 1.33 | 123 |
| Contrast - mL | 163.48 ± 115.50 | 95 |
| Fluoroscopy duration - min | 8.81 ± 1.92 | 55 |
| Length of stay - days | 3.97 ± 4.64 | 123 |
| CDC | 123 | |
| 0 | 103 (83.7) | |
| I | 3 (2.4) | |
| II | 7 (5.7) | |
| IIIa | 1 (0.8) | |
| IIIb | 7 (5.7) | |
| IVa | 1 (0.8) | |
| IVb | 1 (0.8) | |
| V | 0 (0) | |
| Postoperative complications < 30 days | 20 (16.3) | 123 |
| Mortality | 123 | |
| < 3 months | 2 (1.6) | |
| Global | 20 (16.3) | |
| Follow-up - months | 30.55 ± 16.49 | 123 |
Data are presented as n (%) or mean ± standard deviation (SD). BMI - Body mass index; CCIa - Charlson Comorbidity Index adjusted to age; CDC - Clavien-Dindo classification.
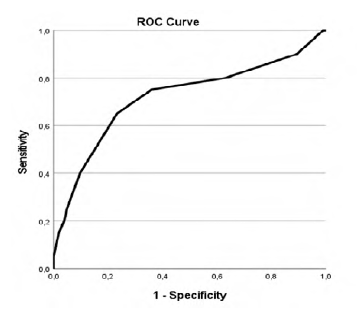
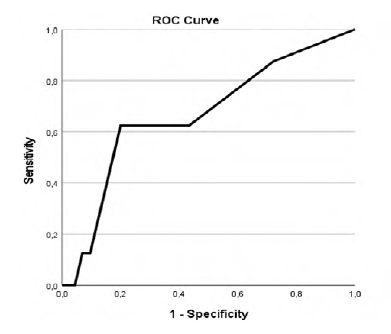
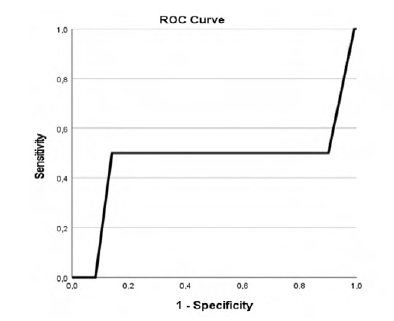
Our study revealed that patients with higher CCIa had higher overall mortality (p=.002, AUC 0.718 (95% CI 0.576-0.861)) as showed in Table 2 and Figure 1 in the ROC curve. Cox regression shows that for each increase of a value in CCIa the risk of dying is 1.280 higher (Table 3). Despite the higher overall mortality these patients didn´t had higher complications rate (p=.740) or early mortality (p=.0889) (Tables 4 and 5 and Figures 2 and 3).
Table 2 ROC curve table for CCIa and overall mortality.
| Area Under the Curve | ||||
|---|---|---|---|---|
| Area | Std Error a | Asymptotic Sig. b | Asymptotic 95% Confidence Interval | |
| Lower Bound | Upper Bound | |||
| 0.718 | 0.073 | 0.002 | 0.576 | 0.861 |
a Under the nonparametric assumption; b Null hypothesis: true area = 0.5
Table 3 Cox Regression of CCIa and overall mortality.
| B | SE | Wald | df | Sig. | Exp(B) | |
|---|---|---|---|---|---|---|
| CCIa | .247 | .096 | 6.563 | 1 | .010 | 1.280 |
CCIa - Charlson Comorbidity Index adjusted to age
Table 4 ROC curve for CCIa and 30-days complications.
| Area Under the Curve | ||||
| Area | Std Error a | Asymptotic Sig. b | Asymptotic 95% Confidence Interval | |
| Lower Bound | Upper Bound | |||
| 0.524 | 0.079 | 0.740 | 0.370 | 0.678 |
a Under the nonparametric assumption; b Null hypothesis: true area = 0.5.
Table 5 ROC curve table for CCIa and 90-days mortality.
| Area Under the Curve | ||||
|---|---|---|---|---|
| Area | Std Error a | Asymptotic Sig. b | Asymptotic 95% Confidence Interval | |
| Lower Bound | Upper Bound | |||
| 0.471 | 0.296 | 0.889 | 0.000 | 1.000 |
a Under the nonparametric assumption; b Null hypothesis: true area = 0.5
Youden´s Index was used to find the threshold of CCIa that best differentiates between lower or higher overall mortality and it was found to be 5.5 with an AUC of 0.718 (95% CI 0.576-0.861) (Figure 1 and Table 6). Therefore, the cutoff value that best discriminates between better and worse prognosis, based on overall mortality, was found to be 6, regarding that CCIa is always a hole number.
Table 6 Youden Index table.
| Positive if Greater Than or Equal To | Sensitivity | 1-Specificity |
|---|---|---|
| 0.00 | 1.000 | 1.000 |
| 1.50 | 1.000 | 0.990 |
| 2.50 | 0.900 | 0.893 |
| 3.50 | 0.800 | 0.631 |
| 4.50 | 0.750 | 0.359 |
| 5.50 | 0.650 | 0.233 |
| 6.50 | 0.400 | 0.097 |
| 7.50 | 0.250 | 0.049 |
| 8.50 | 0.200 | 0.039 |
| 9.50 | 0.150 | 0.019 |
| 10.50 | 0.050 | 0.000 |
| 12.00 | 0.000 | 0.000 |
The test result variable(s): CCIa has at least one tie between the positive actual state group and the negative actual state group. a The smallest cutoff value is the minimum observed test value minus 1, and the largest cutoff value is the maximum observed test value plus 1. All the other cutoff values are the averages of two consecutive ordered observed test values.
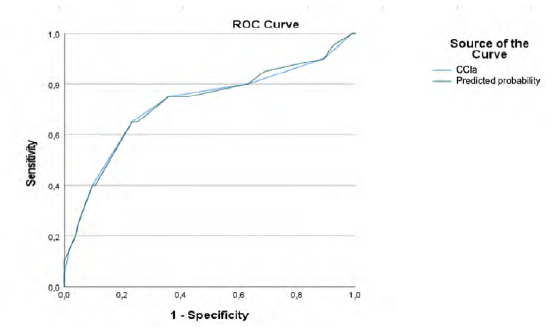
When we compare the two groups, patients with CCIa ≥6 and patients with CCIa < 6, patients with higher CCIa have higher congestive heart failure rate (Odds Ratio (OR)=14.986; 95% (CI) [3.944-56.949; p=.000]) cerebrovascular disease rate (OR=4.117; 95% (CI) [1.602-10.576; p=.002]), diabetes without chronic complication rate (OR=6.589; 95% (CI) [1.881-23.079; p=.002]), mild liver disease rate (OR=8.129; 95% (CI) [1.557-42.432; p=.009]), peptic ulcer disease rate (p=.001), chronic kidney disease rate (OR=10.247; 95% (CI) [2.627-39.977; p=.000]), chronic pulmonary disease rate (OR=2.695; 95% (CI) [1.089-6.673; p=.0049]), and solid tumor without metastasis rate (OR=27.321; 95% (CI) [3.314-225.278; p=.000]) (Table 7). Our study also reveals that, despite the absence of this comorbidity in the CCIa score, patients with CCIa ≥ 6 have higher hypertension rate (OR=3,43; 95% (CI) [0.953-12.378; p=.048]) (Table 7). Despite this higher prevalence rate ROC curve shows that the inclusion of this comorbidity in the score would not improve its prognostic ability (Table 8, Figure 4).
Table 7 Differences in the prevalence of comorbidities between the two groups (CCIa < 6 and CCIa ≥ 6).
| Comorbidity | Odds Ratio | 95% Confidence Interval | p |
|---|---|---|---|
| Congestive heart failure | 14.986 | 3.944-56.949 | .000 |
| Hypertension | 3.43 | 0.953-12.378 | .048 |
| Cerebrovascular disease | 4.117 | 1.602-10.576 | .002 |
| Diabetes without chronic complication | 6.589 | 1.881-23.079 | .002 |
| Mild liver disease | 8.129 | 1.557-42.432 | .009 |
| Peptic ulcer disease | - | - | .001 |
| Chronic kidney disease | 10.247 | 2.627-39.977 | .000 |
| Chronic pulmonary disease | 2.695 | 1.089-6.673 | .0049 |
| Solid tumor without metastasis | 27.321 | 3.314-225.278 | .000 |
Table 8 ROC curves table for CCIa and overall mortality and CCI and hypertension and overall mortality.
| Test Result Variable(s) | Area | Std Errora | Asymptotic Sig.b | Asymptotic 95% Confidence Interval | |
|---|---|---|---|---|---|
| Lower Bound | Upper Bound | ||||
| CCIa | 0.718 | 0.073 | 0.002 | 0.576 | 0.861 |
| Predicted probability | 0.720 | 0.072 | 0.002 | 0.579 | 0.860 |
Under the nonparametric assumption, b. Null hypothesis: true area=0.5. CCIa - Charlson Comorbidity Index adjusted to age
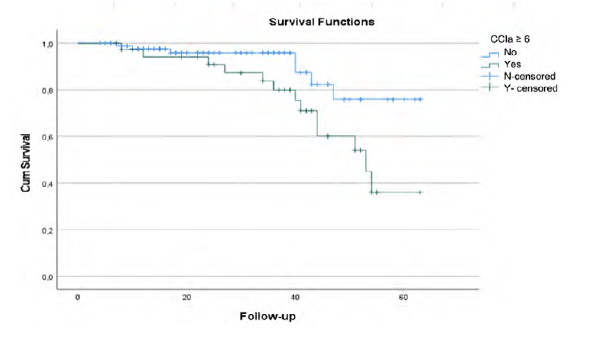
There are no statistical differences between groups considering myocardial infarction rate (p=.460), dementia (p=.301), diabetes with chronic complications p=.529), connective tissue disease (p=.089), leukemia (p=.215) or AIDS (p=.301). Overall survival rate was significantly different between patients with CCIa < 6 and CCIa ≥ 6 (p=.025) as seen in Kaplan-Meier curves (Figure 5).
Discussion
Since the first successful EVAR procedure in the 1990s and due to the demonstrated desirable perioperative and short-term outcomes, this technique has become the treatment of choice for elective repair of AAA.21,22 However, comparing EVAR with OSR, despite an initial survival advantage, less time in operation theatre, less use of intensive care and lower overall length of stay in hospital, some studies reported that EVAR is also associated with worst long-term outcomes and increased late aneurysm-related mortality.21 Besides that, compared to OSR, EVAR requires more vigilant surveillance and more late re-interventions and has not been shown to be cost-effective over the patient's lifetime at conventional thresholds used in the UK.21 It has been suggested that several factors could influence these long-term outcomes after EVAR, and the ability to identify patient-specific factors and comorbidities that independently influence survival could help patient counseling and decision-making regarding whether to proceed with treatment and could determine whether, under certain circumstances, an intervention is not cost-effective.2 The CCI and its further developed age-adjusted version (CCIa) are particularly well suited to help classify comorbidities and estimate the risk of death from comorbid disease for use in prognosis23
As a method of predicting mortality by classifying and weighting comorbid conditions, CCIa has been widely used by health researchers to measure burden of disease and it´s reliability comes from its ability to predict major morbidity and mortality.24 CCIa predictive validity with regard to long-term mortality has been documented in thousands of studies involving millions of patients: hospitalized patients; elderly patients; trauma, surgery, and emergency patients; all types of medical patients, including cancer patients.25 To our knowledge, no prior studies have used CCI or CCIa to evaluate prognosis after elective EVAR. The prevalence of chronic diseases in the middle-aged and elderly has increased rapidly in the last years, and they often suffer from multiple diseases at the same time. Comorbidity, defined by the WHO in 2008 as “suffering from two or more chronic diseases at the same time” leads to the difficulty of treatment, the increase of drug use and the aggravation of disease burden.26 Also, according to some studies older age is associated with more complex aneurysm morphology resulting in more endoleaks, reinterventions, and complications observed in patients >70 years following EVAR.27 For this reason, CCIa seems more appropriate to be evaluated as prognostic tool than CCI. Therefore, the purpose of this study was to evaluate the association between comorbidities and prognosis after elective EVAR by analyzing CCIa scores and determine a possible cutoff in CCIa score associated with higher complication and mortality rates.
In our cohort CCIa proved it`s value in predicting overall mortality but didn´t show any value predicting complications rate and 90-days mortality. Indeed, CCI and CCIa scores had not been specifically designed to predict in-hospital mortality, however they proved it`s value and has been used for this purpose in patients with atrial arrhythmias, acute coronary syndrome, and ischemic stroke, among other diseases. Thus, rather than predicting complications directly related to the surgical procedure, peri- and post-operative periods, the usefulness of the CCIa in these patients seems to be the overall mortality prediction ability during the follow-up period. This predictive capacity of CCIa could be very useful in the future with the inclusion of this tool in the hard decision making process in patients with multiple comorbidities. The strengths of the present study lie in a large and homogenous patient cohort comprising elective cases and patients treated with EVAR, structural collection of data and a noticeable follow-up time. At the same time, the results presented in this article should be interpreted in the context of a single-center retrospective study. Future studies may use this assessment tool to individualize postoperative risk prediction; it would be interesting to establish whether the identification of patients with higher CCIa can somehow improve selection of patients to elective EVAR.
Conclusion
CCIa does not seem to be a good predictor of complications and early mortality after elective EVAR, however it seems to be a good predictor of overall mortality. These results show the limited role of this score in predicting the outcomes after surgery of these patients but may help to identify a sub-population whose shorter life-expectancy should be considered towards the benefits of elective EVAR.


