Serviços Personalizados
Journal
Artigo
Indicadores
-
 Citado por SciELO
 -
 Acessos
Links relacionados
-
 Similares em
SciELO
Compartilhar
Tourism & Management Studies
versão impressa ISSN 2182-8458
TMStudies vol.10 no.1 Faro jan. 2014
TOURISM - SCIENTIFIC PAPERS
Performance evaluation methods in the hotel industry
Os métodos de avaliação de desempenho na hotelaria
Catarina Rosa NunesI; Maria João Cardoso Vieira MachadoII
IEscola Superior de Hotelaria e Turismo do Estoril, Management Department, Researcher for UNIDE-IUL, Avenida Condes de Barcelona 808, 2769-510 Estoril, Portugal, catarina.nunes@eshte.ptIIInstituto Universitário de Lisboa (ISCTE-IUL), Accounting Department, Researcher for UNIDE-IUL, 1649-026 Lisboa, Portugal, mjcvm@iscte.pt
ABSTRACT
This paper aims to contribute to increasing knowledge of performance evaluation methods used by the hotel industry, analysing whether there is a link between hotel characteristics and evaluation methods used. To achieve this goal we conducted surveys and interviews with financial officers of 275 four and five star hotels located in Portugal. The results support the conclusion that there is a link between hotel characteristics and performance evaluation methods used.
Keywords: Performance evaluation, hotel industry, management accounting, Tableau de Bord, Balanced Scorecard.
RESUMO
O presente trabalho tem como objetivo contribuir para o conhecimento sobre os métodos de avaliação de desempenho utilizados pelo sector hoteleiro, analisando se existe associação entre as características dos hotéis e os métodos utilizados. Para atingir este objetivo foram realizados inquéritos e entrevistas aos responsáveis financeiros de 275 hotéis de 4 e 5 estrelas localizados em Portugal. Os resultados obtidos permitem concluir que existem associações entre as características dos hotéis e os métodos de avaliação de desempenho utilizados.
Palavras-chave: Avaliação de desempenho; hotelaria; contabilidade de gestão; Tableau de Bord e Balanced Scorecard
1. Introduction
The overall objective of this study is to contribute to increasing knowledge of performance evaluation methods used by the hotel industry. As specific goals we can state the following: a) identify the performance evaluation methods most used by hotels, and b) analyse the link between hotel characteristics and the performance evaluation methods they use.
To study whether organizations use performance evaluation methods considered in theoretical discussions to be the most suitable continues to be a focus of researchers (Albright, Burgess, Hibbets & Roberts, 2010; Butler, Henderson & Rainborn, 2011; Cardinaels & Veen-Dirks, 2010; Cokins, 2010; Herath, Bremser & Birnberg, 2010; Kraus & Lind, 2010; Neumann, Roberts & Cauvin, 2010; Northcott & Smith, 2011; Sundin, Granlund & Brown, 2010; Tayler, 2010; Vila, Costa & Rovira, 2010). Several authors state that it is important to analyse the link between management accounting methods used and the characteristics of the companies, namely, their dimension (Chenhall, 2003; Haldma & Lääts, 2002; Joshi, 2001; Innes, Mitchell & Sinclair, 2000; Abdel-Kader & Luther, 2008; Cadez & Guilding, 2008; Woods, 2009), ownership of their capital (Ghosh & Chan, 1997; Clarke, Hill & Stevens, 1999; Haldma & Lääts, 2002), and their legal form (Machado, 2011).
This studys universe consists of the four and five star hotels located in Portugal. A single questionnaire was designed and applied via two different methods: interviews and surveys. The surveys were administered through the SURVS platform. We obtained the collaboration of 275 hotels which corresponds to a response rate of 58%.
2. Literature review
In this review the various performance evaluation methods available will be considered, with an emphasis on the Tableau de Bord (TB) and the Balanced Scorecard (BSC).
The Tableau de Bord concept arose in the 50s (Pezet, 2009) from within the bosom of the French industry, with the objective of improving production performance through a deeper understanding of production systems and processes. Subsequently, the managers of several companies used this method so that they could gain a global and periodical perspective on their business in a clear and succinct way and using a range of indicators, which allowed them to make more conscious decisions (Gray & Pesqueux, 1993; Epstein & Manzoni, 1997; Epstein & Manzoni, 1998). Some decades later, the TB model underwent some changes to include non-financial indicators, again in an attempt to meet the needs of managers (Travaille & Marsal, 2007; Quesado, Guzmán & Rodrigues, 2012).
The main distinguishing factor between the TB and the BSC is the fact that in the TB the indicators are not related or connected between them, not providing a view of the company as a whole or including its goals and strategy, as the BSC allows (Quesado et al., 2012).
The BSC was first introduced in the 90s (Kaplan & Norton, 1992) as a method of performance evaluation that combines financial and non-financial indicators (Budde, 2007; Dilla & Steinbart, 2005; Ittner, Larcker & Meyer, 2003; Johanson, Skoog, Backlund & Almqvist, 2006; Kaplan, 1994; Kaplan & Norton, 1993; Kaplan, Norton & Bjarne, 2010; Lipe & Salterio, 2000; Pandey, 2005; Roberts, Albright & Hibbets, 2004; Banker & Mashruwala, 2007; Corona, 2009; Luft, 2009; Martin & Petty, 2000), thereby responding to the various criticisms of previously existing methods (Corona, 2009; Geer, Tuijl & Rutte, 2009). Later the BSC was restructured and presented by its authors not only as a method of performance evaluation but also as a strategy management model (Kaplan & Norton, 1996a, 1996b, 1996c, 1996d). In the following decade, Kaplan and Norton (2001a, 2001b, 2001c) showed the importance of motivation and the participation of all employees to the methods success.
According to several authors (Sainaghi, 2010; Anderson, Fish, Xia & Michello, 1999; Chen, 2009), any companys ability to stay in the current market is directly linked to the results it obtains. The methods presented above help managers to improve their strategies for better performance (Chen, 2009; Bol, 2011). These methods began to be developed in industrial sectors and only subsequently in service sectors (Chen, 2007; Evans, 2005; Pan, 2005), with a definitely reduced amount of research on this topic specifically on the hotel industry (Sainaghi, 2010). In recent decades, performance evaluation has been examined in this industry due to the fact that several authors have noted the particular characteristics of the hotel industry, such as seasonality (Mia & Patiar, 2001; Winata & Mia, 2005), increase in competitiveness and strong sector growth (Collier & Gregory, 1995; Ezzamel, 1990; Borodako, 2011; Martínez-Lópes & Vargas-Sánchez, 2013). According to Faria, Trigueiros and Ferreira (2012), there is in Portugal much potential for research in this area because there is still much information that remains unexplored in all industries.
Several authors state that the characteristics of a company influence the management accounting methods used (Machado, 2011). Of these characteristics, dimension, capital ownership and legal form stand out. Company dimension has been studied by Chenhall (2003), Haldma and Lääts (2002), Joshi (2001), Innes, Mitchell and Sinclair (2000), Abdel-Kader and Luther (2008), Cadez and Guilding (2008), Woods (2009), these authors having concluded that larger companies use more sophisticated management accounting methods. Capital ownership is a contingent variable studied by Ghosh and Chan (1997), Clarke et al. (1999) and Haldma and Lääts (2002), these authors having, however, obtained contradictory results. Whereas in the first two papers the authors conclude that there are more sophisticated methods of management accounting in multinational subsidiaries when compared to regional companies, Haldma and Lääts (2002) found no association between the two variables in Estonian companies. The legal form was analysed by Machado (2011) in small and medium-sized Portuguese industrial companies with no association between management accounting methods used by companies and their legal form.
3. Methodology
Based on the above literature review, the following study question was defined: is there a link between performance evaluation methods and the characteristics of four and five star hotels in Portugal?
This study question was formulated after a pilot test in hotels within the Lisbon district, using a convenience sample which allowed us to conclude that lower category hotels (from three to one star) did not use performance evaluation methods, except for those belonging to large hotel chains or groups where those same groups also included four and/or five star hotels. From this, the universe of this study was defined: four and five star hotels located in Portugal.
Since the data required to perform this study are not published nor available for consultation, it became necessary to choose a method for data collection. Aiming at the triangulation of information, two data collection methods were used: interviews and surveys administered to the hotels financial officers. For geographical reasons, the interviews were conducted in hotels located in Lisbon and its metropolitan area, while the surveys were conducted over the internet in the rest of the country. Before sending the link or the survey in a digital format, telephone calls were made to explain the importance of the answers for the study and to motivate the officers to complete the survey.
Using information obtained from the Portuguese Tourism Board, all 478 hotels with four or five stars located in Portugal were contacted, and the collaboration of 275 hotels was obtained, representing a response rate of 58%, much higher than what was obtained in other studies previously conducted in Portugal (Machado, 2013), and in other countries (Joshi, 2001; Haldma & Lääts, 2002) with response rates of 36%, 24% and 34% respectively. Although the response rate is higher than that of similar studies, according to Siegel and Castellan (1988) whenever non-response exceeds 20%, an involuntary bias may occur in the results, which makes tests for bias caused by non-response relevant. Young, Wim and Chen (2005) point out three types of analysis that should be conducted to check the existence or not of bias caused by non-response: analysis of bias caused by the samples geographic coverage, analysis of bias caused by the different industries being studied, and finally analysis of bias caused by the dimension of the companies being studied.
Regarding bias caused by the industry, this problem does not arise in this study due to the fact that all the hotels belong to the same industry, thus ruling out the possibility of this type of distortion.
Regarding the analysis of bias caused by geographical coverage, if we compare the geographical distribution of the universe of hotels with the geographical distribution of the respondents, we conclude that there is no district with a response rate under 50% or above 75%. There is therefore a balanced geographical distribution of the responding hotels in relation to the total universe of study.
Regarding bias caused by the dimension of the companies in the study, a Students t-test for equal averages regarding the variable number of bedrooms was performed, this variable being described in the results section. This test does not require a normality assumption regarding the variable being studied for samples exceeding thirty cases (Siegel & Castellan, 1988) and has as null hypothesis equality between the average of hotels cooperating with the study and the average of hotels that did not cooperate with the study. An alternative hypothesis is the difference between the average of hotels cooperating with the study and the average of hotels that did not cooperate with the study. The t-test applied assumes equality of variances, and was analysed using the Levene test. This test shows a p-value of 0.169 which leads to the non-rejection of the null hypothesis for equal variances thus validating the Students t-test. The resulting t-test shows a value of 1.035 for 38 degrees of freedom, with a p-value of 0.307, which leads to the decision of non-rejection of the null hypothesis for equal averages. In terms of the analysis of the three types of bias possible, we can conclude that based on the facts above there is no scientific evidence that any bias was caused by non-response in this study.
4. Results
To fulfil the purpose of this study – analysing the influence of hotel characteristics on the evaluation methods hotels use – it was necessary to create variable performance evaluation methods, including three response categories: unstructured measures (UM), Tableau de Bord (TB), and Balanced Scorecard (BSC). These response categories were defined after the data collection allowed us to conclude that all the hotels surveyed use simultaneously financial and non-financial measures to assess their performance. How these measures are structured is what differs in each case. In the first category (UM) were included all the hotels with a random array of financial and non-financial indicators unintegrated into an organised and consistent structure of performance evaluation. In the TB category were classified all the hotels with a framework of indicators, both financial and non-financial, organised according to the principles underlying the Tableau de Bord described in the literature review, namely, the absence of a relationship between the indicators and the strategic goals of the hotel. In the BSC category were placed all the hotels with a framework of indicators, both financial and non-financial, organised according to the perspectives of the BSC described in the literature review, and linked with strategic goals.
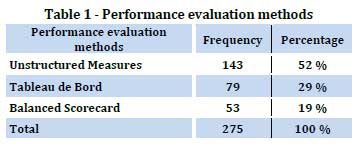
The analysis of Table 1 shows that most of the hotels surveyed (52%) uses only one set of unstructured measures as a performance evaluation method. The second most used method is the TB, in 29% of hotels, followed by the BSC which is used by 19% of the respondents.
The analysis in Table 2 shows that in the majority of districts the method most used of performance evaluation was the UM, with the exception of the districts of Beja, Leiria, Madeira, Oporto and Viseu. In the first three districts mentioned, most hotels use the TB. In the district of Oporto, although the TB is the most used method, the percentage difference to unstructured measures is only about 5%. The district of Viseu is the only one in which most hotels use the BSC.
After the variable performance evaluation methods are defined, the five variables reflecting the characteristics of the hotels are analysed, namely, legal form, accounting type, dimension, belonging to a hotel chain, and capital ownership.
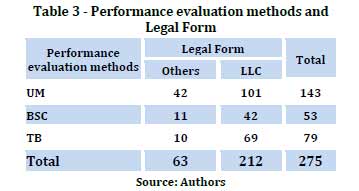
Regarding the first variable, legal form, the data collected show that 212 hotels (77%) are limited liability companies (LLC), the remaining being placed under the legal form we named Others. The link between variable performance evaluation methods and legal form is presented in Table 3, which allows us to conclude that the majority of hotels using the BSC and the TB are limited liability companies, with 42 out of 53 hotels using the BSC and 69 out of 79 hotels using the TB.
Legal Form
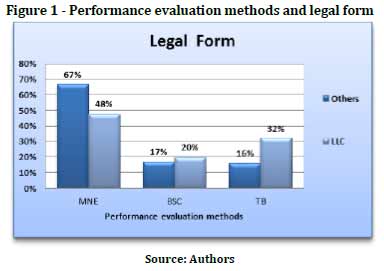
Figure 1 shows a clear link between the use of more complex and sophisticated performance evaluation methods and the legal form of LLC. The majority (67%) of hotels with other legal forms use unstructured measures of performance evaluation, while most hotels that are LLC (52%) use the BSC or the TB.
With these findings, it became important to verify the existence, or not, of a statistically proven link. For this purpose the Pearson Chi-Squared test was applied, and a score of 8.220 was obtained for two degrees of freedom, with a p-value of 0.016, which allows us to reject the null hypothesis of independence between the variables and accept the hypothesis of a link between the performance evaluation methods used by hotels and their legal form, admitting an error of 5%. This conclusion contradicts what was reported by Machado (2011), who found no link between management accounting methods used by Portuguese small and medium-sized industrial companies and their legal form.
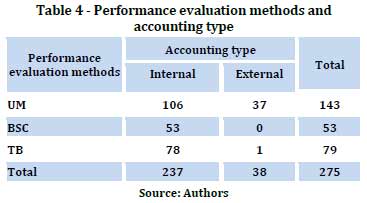
The second characteristic studied – type of accounting – was divided into two response categories. In the first were included hotels where accounting is handled internally by hotel employees or by employees of a business group in which the hotel is integrated. In the second category were included hotels where accounting is handled by an entity not belonging to the hotel or to the hotel group in which the hotel is integrated. The analysis of Table 4 shows that 237 hotels (86%) handle their accounting internally and only 38 hotels (14%) rely on external entities to handle their accounting. One of the most striking data in Table 4 is the fact that none of the hotels with external accounting use the BSC as a performance evaluation method and only one uses the TB.
In Figure 2 we can see a clear contrast between the performance evaluation methods used by the two categories of hotels. The majority (97%) of the hotels with external accounting use only unstructured measures of performance evaluation, while the majority (55%) of the hotels with internal accounting use the BSC or the TB.
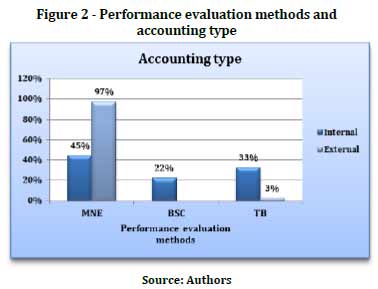
Although the figure is quite explicit, we cannot perform the Pearson Chi-Squared test, because the data do not meet one of the assumptions of the test (Siegel & Castellan, 1988) since one of the expected frequencies has a value less than 1.
Regarding the third hotel characteristic, dimension, it was first necessary to choose the most appropriate variable by which to measure it. Reviewed studies from other industries use as company dimension measures sales volume (Haldma & Lääts, 2002) and the number of employees (Chenhall, 2003; Machado, 2011; Machado, 2013). However, while gathering information for this study, we found that in the specific case of the hotel industry these criteria do not reflect in most cases the actual dimension of the hotel. In many hotels, the employees performing tasks related to bedroom cleaning, kitchen chores and catering and bar services, as well as the entertainment services and recreational activities offered by several hotels, are hired as services rendered by firms not belonging to the hotel or are recruited from temporary employment agencies during the periods of higher demand for the hotel. For this reason, it seems more appropriate and reliable in the case of the hotel industry to use the number of bedrooms and not the number of employees as the dimension variable.
The data collected regarding the variable number of bedrooms allow the conclusion that the hotels surveyed have between a minimum of 7 and a maximum of 577 bedrooms, the average dimension being of 133 bedrooms while half the hotels have between 7 and 104 bedrooms. As the number of bedrooms is a continuous variable, it was divided into two groups identifying the smaller and larger hotels. The splitting of a continuous variable into two categories, one with the lowest values and one with the highest values, can be done using a sturdy statistic like the median (Hill & Hill, 2002; Machado, 2011). This procedure was applied to the variable number of bedrooms (Table 5), whereby we obtained two response categories: the first includes the smaller hotels which have up to 104 bedrooms, and the second includes the largest hotels with more than 104 bedrooms.
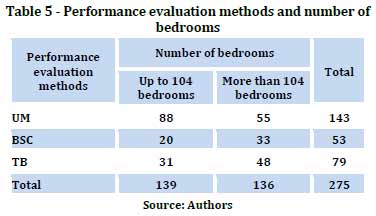
The analysis in Table 5 shows that 88 (63%) of the smaller hotels use unstructured measures to evaluate their performance, whereas the 136 larger hotels use mostly the TB or the BSC, which together add up to 60% of the observations. Looking at Figure 3, we can see that the majority (63%) of the smaller hotels use unstructured measures as a performance evaluation method, followed by the TB in 22% of the cases and the BSC in 15% of the hotels. Regarding the larger hotels, there is less heterogeneity, with the unstructured measures still being the most used method, but representing only 41% of cases, followed very closely by the TB (used by 35% of the hotels), and the BSC which is used by 24% of the hotels.
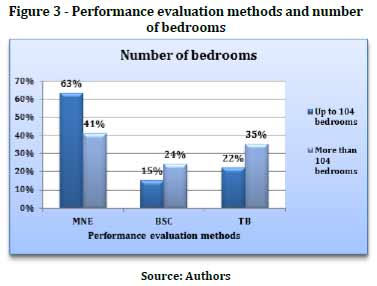
These results suggest that larger hotels use more complex performance evaluation methods, which makes it relevant to see whether there is a link between these two variables. Application of the Pearson Chi-Squared test resulted in a value of 14.43, for two degrees of freedom, with a p-value of 0.001, which allows us to reject the null hypothesis of independence between variables and accept the hypothesis of the existence of a relationship between the variable performance evaluation methods and dimension. These results allow us to generalise to the hotel industry what has already been reported by Chenhall (2003) and Machado (2011) for the manufacturing industry: larger companies use more sophisticated management accounting techniques.
The fourth hotel characteristic studied is belonging to a hotel chain. The analysis of Table 6 shows that 215 of the hotels surveyed (78%) belong to a chain. Of the 60 hotels that do not belong to a chain, 45 use unstructured measures to evaluate their performance.
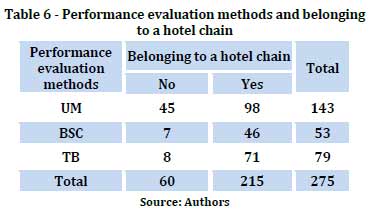
Looking at Figure 4 we can conclude that 75% of the hotels surveyed, those which do not belong to a chain, use unstructured measures as a performance evaluation method, while only 46% of hotels belonging to a chain use this method. The majority (54%) of hotels belonging to a hotel chain use the BSC (33%) or the TB (21%).
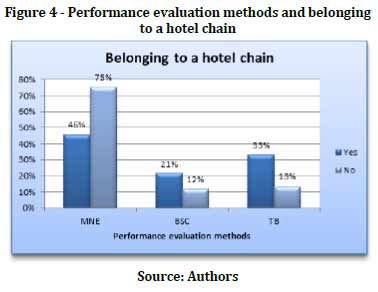
The results obtained allow the conclusion that hotels belonging to a hotel chain, tend to use more complex methods of performance evaluation, which makes it relevant to check the existence of a statistically proven link between performance evaluation methods and belonging or not to a hotel chain by the surveyed hotel. For this we used the Pearson Chi-Squared test, obtaining a result of 16.44, for two degrees of freedom and a p-value of 0.000, which allows us to reject the null hypothesis of independence between variables and accept the hypothesis of the existence of a relationship between the performance evaluation methods used by the hotels and whether they belong or not to a hotel chain.
The fifth characteristic studied is the hotels capital ownership measured by the percentage of foreign capital, as suggested by Ghosh and Chan (1997), Clarke et al. (1999), Haldma and Lääts (2002), and Machado (2011, 2013). Of the 275 respondent hotels, only 229 provided a valid response to the question regarding the percentage of foreign capital in the total share capital of the hotel. The responses obtained were grouped into two categories: entirely Portuguese, for all the hotels owned 100% by Portuguese entities; and foreign participation, for all the cases where part of the capital is held by foreign entities. The analysis in Table 7 shows that for 170 hotels (74%) the capital is 100% Portuguese, and only 59 hotels (26%) have a foreign participation in their capital.
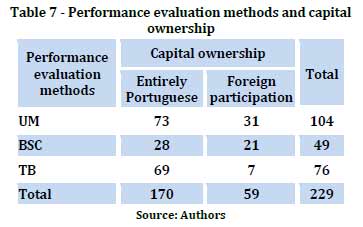
The analysis in Figure 5 allows the conclusion that the most significant difference between the performance evaluation methods used and capital ownership occurs in the use of the TB and the BSC. Hotels with foreign participation in their capital use proportionally more the BSC (36%) and less the TB (12%) than hotels with entirely Portuguese capital, of which 16% use the BSC and 41% the TB.
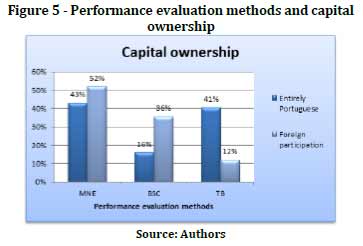
From these results we can conclude that hotels with foreign participation in their capital tend to use more complex methods of performance evaluation when compared to hotels entirely owned by national capital. These findings make it relevant to verify the existence of a link between the performance evaluation methods and the capital ownership of the hotels. For this purpose the Pearson Chi-Squared test was applied with a result of 19.26, for two degrees of freedom with a p-value of 0.000, which allows us to reject the null hypothesis of independence between variables and accept the hypothesis of the existence of a relationship between the performance evaluation methods used by hotels and the fact that the capital is fully owned by Portuguese shareholders or has foreign participation. These results allow the generalisation to the hotel industry of the findings of Ghosh and Chan (1997), Clarke et al. (1999), and Machado (2011) – obtained while studying other industries – which state that management accounting methods are more sophisticated in subsidiaries of multinationals than in local companies.
5. Conclusion
This study had two specific goals: to identify the methods of performance evaluation used by the hotel industry and to analyse the link between hotel characteristics and the performance evaluation methods hotels use.
Regarding the first goal, the results obtained allow the conclusion that the most frequently used performance evaluation method are unstructured measures and that the least frequently used method is the BSC. Regarding the second goal, the data collected allow us to conclude that there is a link between the performance evaluation methods used and some hotel characteristics, namely, legal form; dimension – measured by the number of bedrooms; belonging to a hotel chain; and capital ownership.
A main limitation of this study is possibly one of the methods used for collecting the data, the interviews, may influence respondents' answers, and also that surveys conducted over the internet do not allow a full understanding of the questions posed.
However, this study contributes to the knowledge of performance evaluation in three ways. As a contribution to business practice, the results show that, unlike what has been reported by the empirical studies reviewed, the BSC is very seldom used in Portugal in the hotel industry. This result should be a warning to managers since the methods of performance evaluation used by hotels are not considered the most appropriate in theoretical discussions. This study also offers two contributions to the discussion of theory. Firstly, the results obtained fill a gap in understanding because the empirical data show, for the first time, the existence of a relationship between the legal form of a company and the methods used to evaluate its performance. Secondly, the study suggests the use of a new variable to measure company dimension in the hotel industry – number of bedrooms – for which we found a statistically significant link with methods used to evaluate performance.
The evidence gathered suggests the need for further research with the goal of detecting causes behind the fact that most hotels do not use performance evaluation methods considered more suitable in theoretical discussions.
References
Abdel-Kader, M. & Luther, R. (2008). The impact of firm characteristics on management accounting practices: A UK-based empirical analysis. The British Accounting Review, 40(1), 2-27. [ Links ]
Albright, T., Burgess, C. M., Hibbets, A. R. & Roberts, M. L. (2010). Four steps to simplify multimeasure performance evaluations using the balanced scorecard. The Journal of Corporate Accounting & Finance, 21(5), 63-68. [ Links ]
Anderson, R.I., Fish, M., Xia, Y. & Michello, F. (1999). Measuring efficiency in the hotel industry: A stochastic frontier approach. International Journal of Hospitality Management, 18(1), 45-57. [ Links ]
Banker, R. D. & Mashruwala, R. (2007). The moderating role of competition in the relationship between nonfinancial measures and future financial performance. Contemporary Accounting Research, 24(3), 763-793. [ Links ]
Bol, J. (2011). The determinants and Performance effects of managers performance evaluation biases. The Accounting Review, 86(5), 1549-1575. [ Links ]
Borodako, K. (2011). Cooperation of small and medium-sized tourism enterprises (SMTES) with tourism stakeholders in the małopolska region – top management perspective approach. Tourism & Management Studies, 7, 24-32. [ Links ]
Budde, J. (2007). Performance measure congruity and the balanced scorecard. Journal of Accounting Research, 45(3), 515-539. [ Links ]
Butler, J., Henderson, S. C. & Rainborn, C. (2011). Sustainability and the balanced scorecard: integrating green measures into business reporting. Management Accounting Quarterly, 12(2), 2-11. [ Links ]
Cadez, S. & Guilding, C. (2008). An exploratory investigation of an integrated contingency model of strategic management accounting. Accounting, Organizations and Society, 33(7), 836-863. [ Links ]
Cardinaels, E. & Veen-Dirks, P. M. G. (2010). Financial versus non-financial information: the impact of information organization and presentation in a balanced scorecard. Accounting, Organizations and Society, 35(6), 565-578. [ Links ]
Chen, C. F. (2007). Applying the stochastic frontier approach to measure hotel managerial efficiency in Taiwan. Tourism Management, 28(3), 696-702. [ Links ]
Chen, T.-H. (2009). Performance measurement of an enterprise and business units with an application to a Taiwanese hotel chain. International Journal of Hospitality Management, 28(3), 415-422. [ Links ]
Chenhall, R. H. (2003). Management control systems design within its organizational context: findings from contingency-based research and directions for the future. Accounting, Organizations and Society, 28(2), 127-168. [ Links ]
Clarke, P. J., Hill, N. T. & Stevens, K. (1999). Activity-Based Costing in Ireland: Barriers to, and opportunities for change. Critical Perspectives on Accounting, 10(4), 443-468. [ Links ]
Cokins, G. (2010). The promise and perils of the balanced scorecard. The Journal of Corporate Accounting & Finance, 21(3), 19-28. [ Links ]
Collier, P. & Gregory, A. (1995). Management Accounting in Hotel Groups. London: CIMA. [ Links ]
Corona, C. (2009). Dynamic performance measurement with intangible assets. Review Accounting Studies, 14(2-3), 314-348. [ Links ]
Dilla, W. N. & Steinbart, P. J. (2005). Relative weighting of common and unique balanced scorecard measures by knowledgeable decision makers. Behavioural Research in Accounting, 17(1), 43-53. [ Links ]
Epstein, M. & Manzoni, J. (1997). The balanced scorecard and tableau de bord: translating strategy into action. Strategic Finance, 79(2), 28-36. [ Links ]
Epstein, M. & Manzoni, J. (1998). Implementing corporate strategy: from tableaux de board to balanced scorecards. European Management Journal, 16(2), 190-204. [ Links ]
Evans, N. (2005). A resource-based view of outsourcing and its implications for organizational performance in the hotel sector. Tourism Management, 26(5), 707-21. [ Links ]
Ezzamel, M., (1990). The impact of environmental uncertainty, managerial autonomy and size on budget characteristics. Management Accounting Research, 1(3), 181-197. [ Links ]
Faria, A. R., Trigueiros, D. & Ferreira, L. (2012). Práticas de custeio e controlo de gestão no sector hoteleiro do algarve. Tourism & Management Studies, 8, 100-107. [ Links ]
Geer, E. V., Tuijl, H. F. J. M. & Rutte, C. G. (2009). Performance management in healthcare: performance indicator development, task uncertainty, and types of performance indicators. Social Science & Medicine, 69(10), 1523–1530. [ Links ]
Ghosh, B. C. & Chan, Y. (1997). Management accounting in Singapore ‑ well in place? Managerial Auditing Journal, 12(1), 16-18. [ Links ]
Gray, J. & Pesqueux, Y. (1993). Evolutions actuelles des systemes de tableau de bord. Comparaison des pratiques de quelques multinationales americaines et françaises. Revue Française de Comptabilité, 242, 61-70. [ Links ]
Haldma, T. & Lääts, K. (2002). Contingencies influencing the management accounting practices of Estonian manufacturing companies. Management Accounting Research, 13(4), 379-400. [ Links ]
Herath, H. S. B., Bremser, W. G. & Birnberg, J. G. (2010). Joint selection of balanced scorecard targets and weights in a collaborative setting. Journal of Accounting and Public Policy, 29(1), 45-59. [ Links ]
Hill, M., & Hill, A. (2002). Investigação por questionário. Lisboa: Edições Sílabo. [ Links ]
Innes, J., Mitchell, F. & Sinclair, D. (2000). Activity-based costing in the U.K.s largest companies: a comparison of 1994 and 1999 survey results. Management Accounting Research, 11(3), 349-362. [ Links ]
Ittner C. D., Larcker, D. F. & Meyer, M. W. (2003). Subjectivity and the weighting of performance measures: evidence from a balanced scorecard. The Accounting Review, 78(3), 725-758. [ Links ]
Johanson, U., Skoog, M., Backlund, A. & Almqvist, R. (2006). Balancing dilemmas of the balanced scorecard. Accounting, Auditing & Accountability Journal, 19(6), 842-857. [ Links ]
Joshi, P. L. (2001). The international diffusion of new management accounting practices: The case of India. Journal of International Accounting Auditing and Taxation, 10(1), 85-109. [ Links ]
Kaplan, R. S. (1994). Devising a balanced scorecard matched to business strategy. Strategy & Leadership, 22(5), 15-48. [ Links ]
Kaplan, R. S. & Norton, D. P. (1992). The balanced scorecard: measures that drive performance. Harvard Business Review, 70(1), 71-79. [ Links ]
Kaplan, R. S. & Norton, D. P. (1993). Putting the balanced scorecard to work. Harvard Business Review, 71(5), 134-147. [ Links ]
Kaplan, R. S. & Norton, D. P. (1996a). Using the balanced scorecard as a strategic management system. Harvard Business Review, 74(1), 75-85. [ Links ]
Kaplan, R. S. & Norton, D. P. (1996b). The balanced scorecard: translating strategy into action. Boston: Harvard Business School Press. [ Links ]
Kaplan, R. S. & Norton, D. P. (1996c). Liking de balanced scorecard to strategy. California Management Review, 39(1), 53-79. [ Links ]
Kaplan, R. S. & Norton, D. P. (1996d). Strategic learning & the balanced scorecard. Harvard Business Review, 24(5), 18-24. [ Links ]
Kaplan, R. S. & Norton, D. P. (2001a). Leading change with the balanced scorecard. Financial Executive, 17(6), 64-66. [ Links ]
Kaplan, R. S. & Norton, D. P. (2001b). Transforming the balanced scorecard from performance measurement to strategic management: part I. Accounting Horizons, 15(1), 87-104. [ Links ]
Kaplan, R. S. & Norton, D. P. (2001c). Transforming the balanced scorecard from performance measurement to strategic management: part II. Accounting Horizons, 15(2), 147-160. [ Links ]
Kaplan, R. S., Norton, D. P. & Bjarne, R. (2010). Managing alliances with the balanced scorecard. Harvard Business Review, 88(1-2), 114-120. [ Links ]
Kraus, K. & Lind, J. (2010). The impact of corporate balanced scorecard on corporate control: a research note. Management Accounting Research, 21(4), 265-277. [ Links ]
Lipe, M. G. & Salterio, S. E. (2000). The balanced scorecard: judgmental effects of common and unique performance Measures. The Accounting Review, 75(3), 283-298. [ Links ]
Luft, J. (2009). Nonfinancial Information and Accounting: A Reconsideration of Benefits and Challenges. Accounting Horizons, 23(3), 307–325. [ Links ]
Machado, M. J. (2011). Variáveis contingenciais aos métodos de valoração dos produtos: estudo empírico em PMEs industriais portuguesas. RBGN - Revista Brasileira de Gestão de Negócios, 13(41), 396-414. [ Links ]
Machado. M. J. (2013). Balanced Scorecard: Empirical Study on Small and Medium Size Enterprises. RBGN – Review of Business Management, 15(46), 129-148. [ Links ]
Martin, J. D. & Petty, J. W. (2000). Value based management: the corporate response to the shareholder revolution. Boston: Harvard Business School Press. [ Links ]
Martínez-López A. M. & Vargas-Sánchez, A. (2013). Factores con un especial impacto en el nivel de innovación del sector hotelero español. Tourism & Management Studies, 9(2), 7-12. [ Links ]
Mia, L., & Patiar, A. (2001). The Use of Management Accounting Systems in Hotels: an Exploratory Study. International Journal of Hospitality Management, 20 (2), 111-128. [ Links ]
Neumann, B. R., Roberts, M. L. & Cauvin, E. (2010). Information search using the balanced scorecard: what matters? The Journal of Corporate Accounting & Finance, 21(3), 61-66. [ Links ]
Northcott, D. & Smith, J. (2011). Management performance at the top: a balanced scorecard for boards of directors. Journal of Accounting & Organizational Change, 7(1), 33-56. [ Links ]
Pan, C. (2005). Market structure and profitability in the international tourist industry. Tourism Management, 26(6), 845-50. [ Links ]
Pandey, I. M. (2005). Balanced scorecard: myth and reality. Vikalpa, 30(1), 51-66. [ Links ]
Pezet, A. (2009). The history of the French tableau de bord (1885-1975): evidence from the archives. Accounting, Business & Financial History, 19(2), 103-125. [ Links ]
Quesado, P., Guzmán, B. & Rodrigues, L. (2012). O tableau de Bord e o Balanced Scorecard: uma análise comparativa. Revista de Contabilidade e Controladoria, 4(2), 128-150. [ Links ]
Roberts, M. L., Albright, T. L. & Hibbets, A. R. (2004). Debiasing balanced scorecard evaluations. Behavioural Research in Accounting, 16(1), 75-88. [ Links ]
Sainaghi, R. (2010). Hotel performance: state of the art. International Journal of Contemporary Hospitality Management, 22(7), 920-952. [ Links ]
Siegel, S. & Castellan, N. J. (1988). Nonparametric Statistics for the behavioural sciences (2.ª Ed.). New York: McGraw-hill. [ Links ]
Sundin, H., Granlund, M. & Brown, D. A. (2010). Balancing multiple competing objectives with a balanced scorecard. European Accounting Review, 19(2), 203‑246. [ Links ]
Tayler, W. B. (2010). The balanced scorecard as a strategy-evaluation tool: the effects of implementation involvement and a causal-chain focus. The Accounting Review, 85(3), 1095-1117. [ Links ]
Travaille, D. & Marsal, C. (2007). Automatisation des tableaux de bord et cohérence du contrôle de gestion: à propos de deux cas. Comptabilité Contrôle Audit, 13(2), 75-96. [ Links ]
Vila, M., Costa, G. & Rovira, X. (2010). The creation and use of scorecards in tourism planning: a Spanish example. Tourism Management, 31(2), 232-239. [ Links ]
Winata, L., & Mia, L. (2005). Information Technology and the Performance Effect of Managers Participation in Budgeting: Evidence from the Hotel Industry. International Journal of Hospitality Management, 24 (1), 21-39. [ Links ]
Woods, M. (2009). A contingency theory perspective on the risk management control system within Birmingham city council. Management Accounting Research, 20(1), 69-81. [ Links ]
Young, S. M., Wim, A. V. S. & Chen, C. X. (2005). Assessing quality of evidence in empirical management accounting research: the case of survey studies. Accounting, Organizations and Society, 30(7-8), 655-684. [ Links ]
Article history:
Submitted: 30 June 2013
Accepted: 10 November 2013


