Serviços Personalizados
Journal
Artigo
Indicadores
-
 Citado por SciELO
 -
 Acessos
Links relacionados
-
 Similares em
SciELO
Compartilhar
Tourism & Management Studies
versão impressa ISSN 2182-8458versão On-line ISSN 2182-8466
TMStudies vol.16 no.1 Faro mar. 2020
https://doi.org/10.18089/tms.2020.160102
TOURISM: SCIENTIFIC PAPERS
Near and similar restaurants: competitors or allies?
Restaurantes cercanos y similares: ¿competidores o aliados?
Reyner Pérez-Campdesuñer*, Alexander Sánchez-Rodríguez**, Margarita De Miguel-Guzmán***, Gelmar García-Vidal****, Rodobaldo Martínez-Vivar*****
* Universidad UTE, Faculty of Administrative Science, Ecuador, reyner.perez@ute.edu.ec
** Universidad UTE, Faculty of Administrative Sciences, Ecuador, alexander.sanchez@ute.edu.ec
*** Universidad Regional Autónoma de los Andes - Uniandes, Faculty of Business Management, Ecuador, us.margaritademiguel@uniandes.edu.ec
**** Universidad UTE, Faculty of Administrative Science, Ecuador, gelmar.garcia@ute.edu.ec
***** Universidad UTE, Faculty of Administrative Science, Ecuador, rodobaldo.martinez@ute.edu.ec
ABSTRACT
The proximity of businesses targeting the same market segment, meeting the same needs and operating in a similar way is generally believed to indicate more competition. However, this situation can be beneficial for the companies involved, and it may not necessarily generate an adverse environment. This study sought to analyse a group of restaurants that operate under similar conditions and that are located within the same area in order to identify the potential benefits and drawbacks of choosing this strategy to deal with market pressures. The research was based on a sample of 1,358 customers from 52 small restaurants. Diverse information-gathering techniques were combined such as observations, interviews and surveys. The data gathered was used to characterise different groups of variables’ behaviour based on descriptive statistics. In addition, bivariate statistics were utilised to test the hypotheses, while multivariate statistics were used to conduct correspondence analysis. The results reveal that, in the cases analysed, the parties involved benefit from the existing condition when a process of distribution of demand is present and advertising expenses are minimised.
Keywords: Restaurant, small business, advertising, demand, customer service.
RESUMEN
La cercanía de negocios que se orienten a un mismo segmento de mercado es concebida como manifestación de competencia. La situación descrita puede resultar beneficiosa para estos negocios y no obligatoriamente generar situaciones adversas. Este artículo tiene como objetivo analizar un grupo de restaurantes que operan bajo condiciones similares ubicados en un área cercana, para identificar posibles beneficios y daños que puedan originar en ellos la elección de este tipo de estrategia para enfrentar su mercado. Esta investigación caracteriza un caso similar en el que participaron 1.358 clientes de 52 pequeñas empresas de servicios de restaurantes, combinando técnicas de recopilación de información como observación, entrevistas y encuestas a partir del cual se caracterizó el comportamiento de diferentes grupos de variables, a partir del empleo de la estadística descriptiva, la estadística bivariada para la constatación de hipótesis y la estadística multivariada para un análisis de correspondencia. Se concluye que en el caso analizado las partes involucradas se ven beneficiadas de la condición existente al producirse un proceso de distribución de la demanda y de minimización de los gastos publicitarios.
Palabras clave: Restaurante, pequeña empresa, publicidad, demanda, atención al cliente.
1. Introduction
In Ecuador, a total of 42,000 small businesses are categorised as providing restaurant services. This type of business provides families with a means of subsistence and generates work for more than one of their members. As in other countries, Ecuador shows a trend towards the presence of various companies targeting the same market segments, offering similar type of products and choosing locations quite near to each other. Businesses that operate in this way include those selling clothing, footwear, shoe repair and restaurants services, among others. This, at first sight, appears to be a process of cannibalisation with regard to the existing demand. However, these businesses’ adjacent locations could produce a common approach to meeting customers’ demands, which may result in decreased promotional expenses and fluctuations in demand among restaurants as an indirect form of regulation. The latter would depend on these businesses’ occupancy rate compared to their full capacity, among other relevant aspects.
The present study analysed data on a group of restaurants that operate under the conditions described above, in the city of Santo Domingo de los Tsáchilas, Ecuador. The research’s purpose was to identify possible benefits and drawbacks of implementing this type of strategy to deal with market pressures.
Restaurant studies have had diverse aims and analysed different variables. Some researchers have sought to identify criteria used by customers to choose or abandon businesses where they can meet their need for food, comfort and shared social activities, among other demands. Studies conducted previously (Baptista Gomes, Conill Gomes & Meyer, 2018; Brown, 2018; Chen, Yeh, Pai & Chen, 2018; Ha, 2018; Han, Kim, Lee & Kim, 2018) have reported that various variables affect restaurant selection: marketing mechanisms, use of communication channels such as social networks or the Internet in general, service quality, needs customers seek to meet, cost of services and the time required to consume services.
Other investigations (Brown, 2018; Jung & Jang, 2018) have served more specific purposes such as determining patterns in restaurants’ location, market structures that reflect specific levels of competition and types of interrelationships between competitors. Another focus has been the costs and/or benefits of operating in concurrent areas in terms of how customers’ choose restaurants. In addition, some studies (Kim, Yang & Mattila, 2018; Line & Hanks, 2018) have been designed to identify aspects that influence loyalty to restaurant services or constitute motivators to alter this loyalty. This research’s results can be used to develop administrative initiatives to mitigate or eliminate consumers’ intentions to remain loyal to or abandon restaurants. Related studies (Afrin & Ramalingam, 2018; Baptista Gomes et al., 2018; Choi, Lee, Choi & Sun, 2018; Mun & Jang, 2018) have sought to understand which aspects condition the achievement of customers’ satisfaction based on criteria applied when choosing restaurants. Restaurant strategies include, among others, disaggregation of demand, management of inventory levels, methods ensuring the availability of competent personnel and financial availability.
Despite the abundant research on the topic under investigation, no studies were found in the present research’s review of the relevant literature that have, at least explicitly, aimed to deepen the existing understanding of aspects such as relationships between restaurants and advertising initiatives, as well as their effects on demand. These underresearched topics provided the motivation for this study.
2. Literature review
The literature review below is divided into two parts. The first is the study’s contextualisation and relevance, while the second presents previous research on related topics.
2.1 Contextualisation and relevance
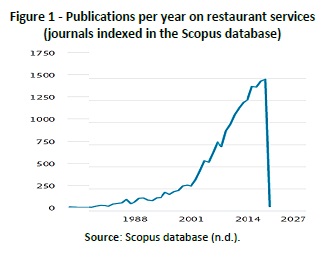
Not unexpectedly, the topic of gastronomy has generated a constant flow of research. More specifically, Figure 1 shows how studies of restaurants have been increasing in number from 1998 to the present in journals indexed in the Scopus database.
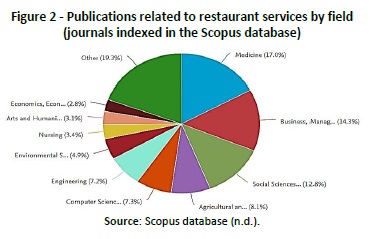
Figure 2 presents statistics on how this topic has been addressed by different fields of study. Notably, a predominant number of these publications come from fields related to health and administrative sciences.
Restaurants have been the subject of studies throughout the entire world. Research has been conducted on this topic on multiple continents - the Americas (Carrijo, Botelho, Akutsu & Zandonadi, 2018), Europe (Abbasian, 2018), Asia (Hussain, Jing & Parveen, 2018) and Africa (Mhlanga, 2018) - or in specific countries such as Austria (English & Fleischman, 2017). The perspectives addressed by these studies are also diverse, although some are more prominent than others, including tourism (Spang, 2018), environmental issues (Cerdá Suárez, Robina Ramírez & Palos Sánchez, 2018) or business internationalisation (Lee, Choi & Moon, 2018).
Research related to restaurants’ impact on health makes up a large proportion of the literature. This relationship has been approached from different angles, for example, whether restaurants influence the spread of diseases through microorganisms or generate allergies (Lefèvre et al., 2019), whether controlling food safety in restaurants can eliminate diseases (Araújo, Zandonadi, Tenser, Farage & Ginani, 2018) or how health and good nutrition can be promoted through restaurant services (Binkley, 2018; Kim et al., 2018; Yang, Roehl & Huang, 2017). Studies analysing restaurant menu design also stand out in the existing literature (Choi & Reid, 2018). This field of research further includes analyses of social variables’ significance, such as age groups reflecting the three fundamental developmental stages (Kellershohn, Walley, West & Vriesekoop, 2018; Souza Gomes, Lisboa Pereira & Silva Abreu, 2018), gender (Ketchum, 2018) and ethnic or cultural groups (Rashid, Abdullah, Noor, Kassim & Akbar, 2018).
2.2 Related studies
The research topics specifically related to restaurant management are also varied, showing a tendency towards analyses of customer satisfaction (Han, Kim et al., 2018) and, closely associated with this, the issues of service quality (Chen, Yeh et al., 2018), marketing methods (Chou & Chuang, 2018) and new technologies’ use (Aulia, Zakir, Dafitri, Siregar & Hasdiana, 2017; Han, Li, Jiang & Zhao, 2018). The literature also highlights methods applied to manage capacity (Mun & Jang, 2018) and inventory (Baptista Gomes et al., 2018). Aspects related to financial management (Choi et al., 2018) and human resources management (Afrin & Ramalingam, 2018; Bufquin, DiPietro, Partlow & Smith, 2018; Kim & Jang, 2019) are also addressed by research on restaurants, including the significance of wages, staff turnover and work commitment in this context.
Various authors have focused on identifying the criteria customers use to select restaurants (Ha, 2018; Liu & Tse, 2018). More specifically, Brown (2018) explored the restaurant market’s structure in a specific area. The cited author’s results highlight two reasons clients visit restaurants: the cost of services and the hedonic experiences these generate. Bai, Wang, Yang and Gong (2019) further report that restaurant customers feel that waiting time and service costs are decisive.
According to Bardwell, Stephan, Rahman and Reynolds (2018, p. 644), ‘[p]eople choose how often to dine out based on their needs, values and individual interests[,] and the involvement of customers with a restaurant . . . influences the frequency of their meals in that restaurant.’ In addition, the frequency of meals in specific restaurants indicates clients’ satisfaction with those businesses, so, the more frequently meals are eaten in a restaurant, the more likely customers will be to return and show loyalty to that establishment (Kim et al., 2018). The relationship between speed and quality of customer service, number of chairs and prices in restaurants was also analysed by Chen, He and Paudel (2018). Line and Hanks (2018), in turn, got interesting results from a study that assessed the value of alternative strategies to restaurant managers in terms of mitigating clients’ intention to change restaurants because of boredom after repeated visits to the same place.
Multiple researchers (Hsiao & Chen, 2018; Jung & Jang, 2018; Yang et al., 2017) have confirmed the importance of location to businesses’ success. Jung and Jang (2018) conducted a study of the benefits to restaurants when they choose to operate in areas shared with competitors. Among the most significant benefits are greater specialisation, better access to skilled labour and a greater demand for lower search costs for customers. Yang et al. (2017) specifically focused on how demographic variables’ behaviour affects businesses’ growth potential. However, the present review of the available literature found no references - at least explicitly - to research on the intensification of relationships established between nearby restaurants as competitors or allies or these relationships’ patterns link to advertising expenses.
3. Research methodology
3.1 Sampling and data collection
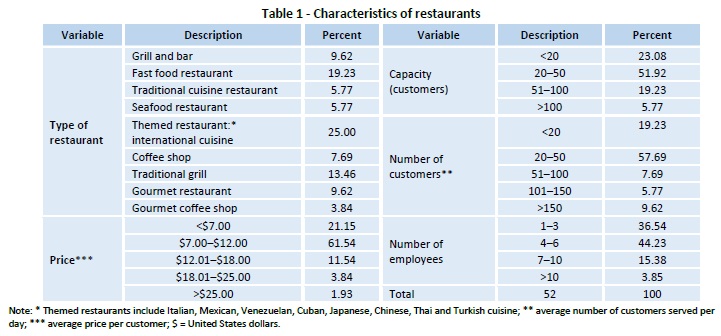
The location chosen to carry out the current study is an area of the city of Santo Domingo de los Tsáchilas, Ecuador, in which more than 52 restaurants operating under similar conditions target the same market segment. Table 1 shows a summary of some characteristics of the selected restaurants.
(clique para ampliar ! click to enlarge)
The restaurants’ capacity was measured by the number of customers even though it is conditioned by the number of tables and chairs available. Capacity is also affected by how customers arrive and the possibility of redistributing chairs around tables depending on the number of customers in groups and the available space. The menus reveal that the restaurants’ services are reasonably priced and thus oriented towards a segment of customers with low average purchasing power. Most restaurants in the sample are not characterised by great comfort or luxury (86.54%) as they use general lighting; have no air conditioning or distinctive furniture, linens or dishes; and do not use a specific music system. These restaurants usually operate at night and weekends (88.47%). The businesses under study are all located within a perimeter of 500 metres.
The required customer sample’s size was estimated using Equation (1) (Triola, 2018):
in which:
n = size of the corresponding population
p = q = 0.5
e = 0.01 (margin of error)
k = 1.96 for a 95% confidence level
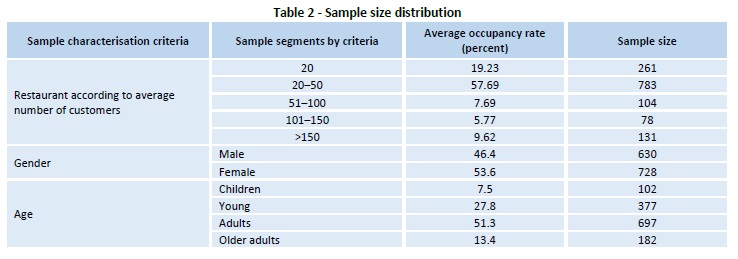
In total, 1,358 customers were surveyed. The sample size was defined as the number of customers per restaurant based on the average occupancy rate, which was then distributed to ensure a proportionate stratified sample, as shown in Table 2.
(clique para ampliar ! click to enlarge)
To select the customers to be surveyed, a chart of random days was created to guarantee a more representative sample. Although each restaurant’s information was freely available, the information presented in this paper has not been associated with the specific names of each service provider’s name, as the owners or managers requested this and the restaurants’ identities are not a significant component of the results.
3.2 Measures
3.2.1 Variables to observe
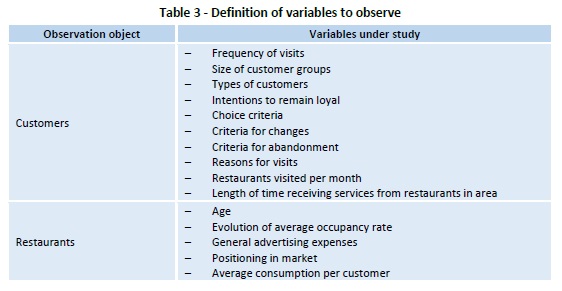
Three types of observation objects were identified. For each of these, the specific variables to be analysed were defined as summarised in Table 3.
3.2.2 Design of data gathering methods
The data were collected in 20 restaurants, namely, 38.5% of those initially selected. The final sample was determined by the owners’ willingness to participate in a study involving their clients. The data were gathered through interviews or surveys of customers and business owners. In addition, observation guides were followed while observing restaurants’ operations. The data included the restaurants’ age, their advertising expenses’ evolution over time and average occupancy rate, as well as a review of relevant documents whenever the restaurant owners allowed this. Otherwise, the required information was collected during interviews with the owners.
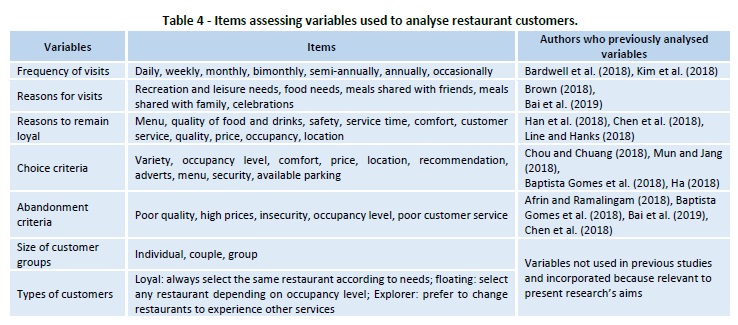
The customers’ data were gathered with a questionnaire made up of items assessing the variables under study, which are summarised in Table 4. Each variable is listed with the authors who included it in their research. Two groups of other variables were added to reflect this study’s specific features.
(clique para ampliar ! click to enlarge)
To examine restaurants’ market positioning, the attributes associated with the variable of intention to remain loyal were defined. Items assessing the variables of restaurants visited per month and length of time receiving restaurant services in the area were considered unnecessary to achieve this research’s aims.
3.3 Data analyses
The data were processed using various descriptive statistical analysis methods, with relative frequency and cumulative frequency serving as the most fundamental statistics. Bivariate statistics were also used to analyse the relationships between variables based on crossed tables and hypothesis tests. More specifically, a chi-square test was carried out to identify any statistically significant relationships between the variables in question (Badii et al., 2012; Saulo Hermosillo & Pablo González, 2013).
To analyse the restaurants’ market positioning, the attributes used to evaluate customers’ level of loyalty were presented to respondents, who were then asked to indicate the attributes they associate with each restaurant. To assess the businesses’ positioning, correspondence analysis was conducted as this is a method previously used by other researchers in similar contexts (Hanna & Rowley, 2019; Iacobucci & Grisaffe, 2018). A matrix was created based on the correspondence analysis, using SPSS 2.3 software.
4. Results
4.1 Descriptive statistics
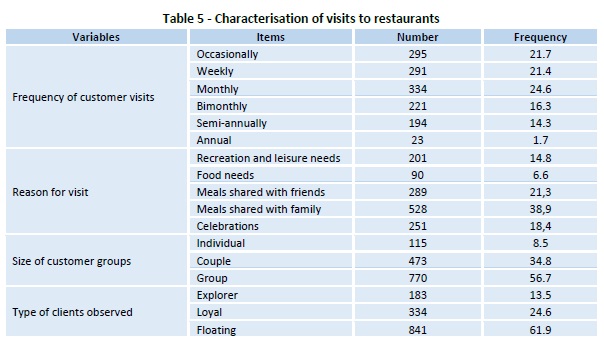
Table 5 presents the frequency, reasons, number of individuals and types of customers who frequent the restaurants under study. No customers in the sample visits daily. The highest frequencies of visits observed are bimonthly (21.4%), semi-annually (24.6%) and annually (21.7%). Overall, customers’ visits to restaurants do not tend to be extremely repetitive. With regard to reasons for visits, the most common reasons are meals shared with family (52.9%) and with friends (46.3%), with much smaller percentages found for being home alone (6.6%) and work (1.2%). Reasons related to work are not well represented because the restaurants’ schedules are mainly at night or weekends.
(clique para ampliar ! click to enlarge)
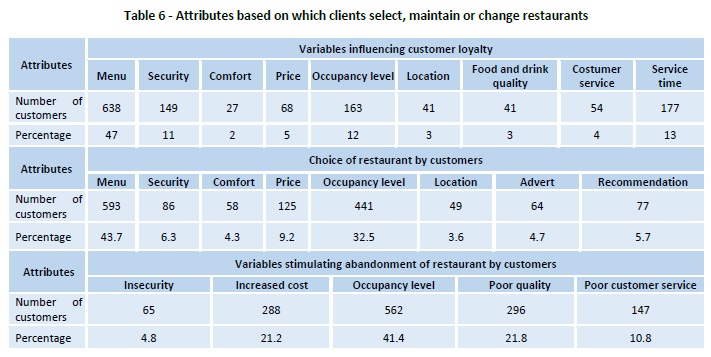
Clients arrive in general in groups of family members and/or friends (56.7%) or as couples (34.8%), while fewer customers (8.5%) go out to eat as individuals. Of all the customers surveyed, only 25.3% are loyal customers, but 62.4% are floating customers who choose their restaurant depending on how full the food services businesses in the area are. Only 12.3% of clients fall into the category of explorer customers seeking to evaluate a variety of services offered by different restaurants. These results indicate that clients perceive the restaurants as equally attractive in terms of the attributes these individuals evaluate when selecting a restaurant. Table 6 summarises customers’ behaviour in relation to the attributes that they may consider when selecting, staying with or leaving restaurants.
(clique para ampliar ! click to enlarge)
These results provide a deeper understanding of the attributes considered a reason to remain loyal by 25.3% of the clients. As the above table shows, most attributes included do not make important contributions to ensuring customer loyalty. An exception to this is the attribute of menu, which indicates that the particular features of restaurants’ menus in some cases foster some level of loyalty. The analyses additionally confirmed that, under the present conditions, the attributes that most influence the choice of restaurants are the menu offered and occupancy level and that the rest of the evaluated attributes’ influence is quite weak compared to these two aspects. The restaurants’ menus are thus associated with attributes that affect loyalty, while occupancy levels could be interpreted as indicating that newly created restaurants’ low occupancy rates could cause a growth in the demand for their services.
Reasons for abandonment were identified by customers who stated that, at some point, they had stopped frequenting a specific restaurant. The criterion that most encourages abandonment is a high occupancy level as customers perceive this as equating to longer service time, greater stress for personnel and reduced service quality. In addition, restaurants considered to have a regular clientele tend to increase prices because their offer is more greatly valued, which eventually diminishes the demand for these businesses. The degree to which restaurants in the area are well-known was assessed based on the number of years clients had been using their services and the number of local restaurants that customers already know. Both variables are summarised in Table 7.

(clique para ampliar ! click to enlarge)
An analysis of the number of visits to the zone to enjoy the restaurants’ services verified that about 75% of the clients visit the area at least once in the previous three years and only 20% had started visiting it one year earlier. Similarly, the data on the number of restaurants known to the respondents showed that about 60% of customers know more than 50% of restaurants. Once again, the results support the conclusion that customers prefer to ‘float’ between the different restaurants that operate in the area.
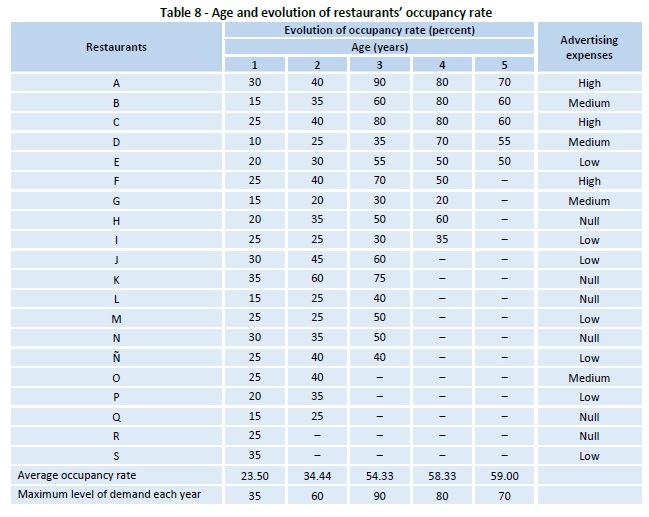
The analyses of the restaurants’ data confirmed that three variables of those included initially in the study are significant: age, average occupancy rate’s evolution and advertising expenses (see Table 8). According to the research on the restaurants operating within the designated area, those open for the longest time are approximately five years old, so this period was established as a scale to record the evolution of restaurants’ occupancy rates.
(clique para ampliar ! click to enlarge)
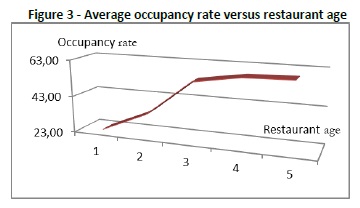
As can be seen from Figure 3, restaurants’ occupancy rates, as expected, tends to increase in the first years. In later years, the rates normally stabilise.
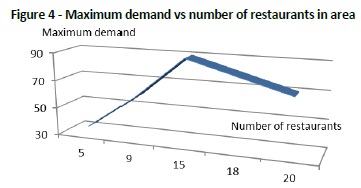
Figure 4 presents data on the relationship between restaurants’ maximum demand and the number of restaurants. These results reveal that, as the number of restaurants grows, the tendency is for the maximum demand for these services to increase, apparently also due to an accumulated effect of restaurants’ age. However, at some point, the number of restaurants continues to increase, but the total demand begins to decrease. This trend is understandable since it reflects a redistribution of the existing demand.
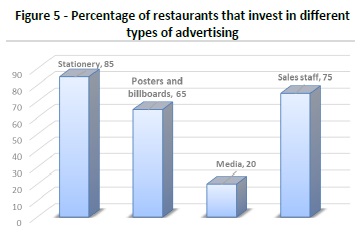
With regard to advertising expenses, the results indicate a tendency for only the first restaurants opened to make a relatively significant investment in advertising, so most businesses have invested as little as possible in adverts. They usually hire sales personnel to stimulate demand (i.e. potential customers) from among passers-by in front of the restaurants during the first days of opening or during festivities or commemorative events. Only 25% of the restaurants have Facebook ad pages. Other advertising expenses are limited to the use of posters, billboards or promotional stationery. Only 20% of these businesses have invested in advertising campaigns in the media, such as radio or television. Figure 5 summarises the main forms of advertising in which restaurants have invested.
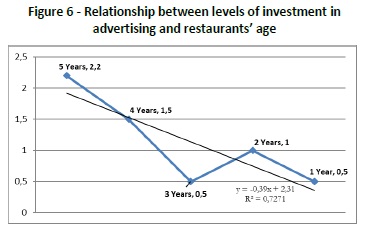
Figure 6 shows the restaurants’ behaviour in terms of their overall advertising investment. The oldest restaurants, that is, those that opened first, were forced to invest more in advertising to encourage demand than those that were started later and that benefited from the investment already made.
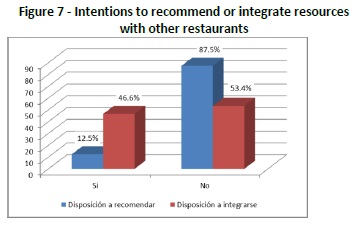
Business owners’ willingness to recommend other nearby businesses or to create cooperation mechanisms with other businesses to gain mutual benefits was also evaluated (see Figure 7). Regarding recommendations, only 12% would consider agreeing to do this, while 46.6% reported that they are willing to integrate and share resources, as well as develop joint initiatives that benefit the associates involved.
4.2 Analyses of relationships between variables
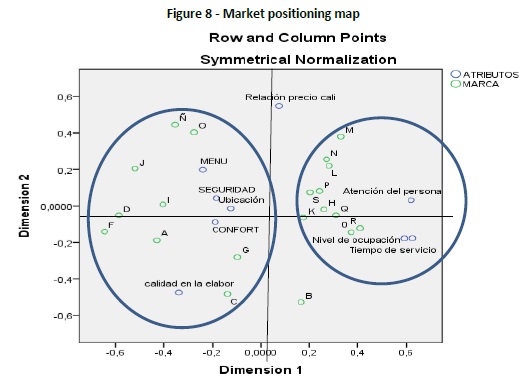
Figure 8 summarises the restaurants’ relative market positioning from the customers’ perspective. One group of restaurants is positioned around the attributes of occupancy level, personnel attention and service time, which, as mentioned previously, show a close relationship with each other. These restaurants are characterised by a lower occupancy level and, consequently, a shorter time for staff to pay attention to clients and better service due to the personnel’s lighter workload.
The second group tends to be close to other attributes but in a more dispersed pattern. Notably, the attributes of security, location and comfort occupy the map’s centre, which may be because they are attributes for which potential competitors have failed to establish a marked differentiation. In addition, the quality-price attribute is located at a distance from the other attributes due to this attribute receiving no satisfactory ratings. Restaurant B is also distant from the other businesses because, despite being one of the oldest restaurants, it has been unable to achieve high occupancy rates because it does not have attributes that distinguish it from its competitors.
To evaluate the possible independent relationship between the establishments’ age and the variables of occupancy rate and advertising expenses, a non-parametric chi-square test was performed. The results are summarised in Table 9. This table also shows the test results for the possible relationship between the number of restaurants and maximum demand.

(clique para ampliar ! click to enlarge)
The chi-square test’s findings on significance levels indicate that the variables of occupancy rate and advertising expenses are not independent of the variable of restaurant age, and the variables of number of restaurants and maximum customer demand in the area are also not independent. The above results for phi, Cramer’s V and contingency coefficients confirm that the relationship between these variables can be considered significantly strong.
5. Discussion and conclusions
The data collected on the customers’ profile established that more than 90% of these visits to the restaurants in the area under study were not motivated by clients’ desire to satisfy their need for food but instead to find a space to share meals with family and friends. This reason corresponds to one of the motives identified by Brown (2018), namely, hedonic motivation. Thus, more than 90% of customers visit restaurants accompanied by family or friends. Another interesting result is that only 25% of customers show a tendency towards loyalty or a preference for one restaurant, while the rest report floating behaviours regarding their selection of restaurants. These findings reinforce not only the hedonic nature of these visits but also customers’ tendency to experience boredom, which is mentioned in Line and Hanks’ (2018) work.
The present study’s observations confirmed that restaurants’ varied menus and occupancy levels play a fundamental role in clients’ choices since these variables affect other aspects such as the time spent waiting for service and the staff’s attention to customers. This conclusion is reinforced by the finding that high occupancy levels are one of the criteria given a greater weight in decisions not to continue visiting a restaurant and instead to select another one with more availability and a similar quality of service, thereby substantiating Bai et al.’s (2019) results. The number of times that customers visit the area and the number of restaurants they know suggest that clients have experienced different restaurants’ services, especially given that more than 50% of customers who reported visiting the area for more than two years know at least 60% of the restaurants in the sample.
The above results and analyses of the importance of restaurants’ occupancy rates highlight that, although a direct relationship exists between restaurants’ occupancy rate and age in their first years, once these businesses have been open three years, the demand for their services begins to stabilise. The number of restaurants in the area has grown, which, at the beginning, generated an increase in total customer demand. However, at some point in time, the customers’ total demand tends to decrease with reference to the number of restaurants. This trend can be interpreted as a saturation of these services in the area, to some extent corresponding to the results of Yang et al.’s (2017) analyses of the relationship between demand for restaurants and their area’s demographic variables.
The present study further found that advertising expenses show an inverse relationship with the restaurants’ age and the number of other restaurants in the area. That is, the first restaurants to open are forced to invest more in advertising than those that join other businesses in areas in which an initial demand already exists. The above findings support the conclusion that, based on the selected variables’ behaviour, the existence of nearby restaurants operating under similar conditions and targeting the same market segment should not necessarily be seen as a sign of strong competition. Rather, this proximity may contribute to the fuller development of all the businesses involved and to the mutual benefit gained from publicity campaigns. The demand for restaurants’ services will be self-distributed according to consumers’ behaviour in terms of the attributes they consider most important.
This research’s results cannot be considered conclusive as they are exploratory in nature because the study was conducted in a specific area of one city and focused on a quite specific market segment. Future research could explore whether these findings can be confirmed in different contexts and for other types of businesses in order to facilitate a greater generalisation of the above conclusions. The results obtained are naturally conditioned by the specific cultural features of the study population. Nonetheless, this research’s findings have practical implications from an administrative sciences perspective for managers of small businesses operating near to competitors in specific geographical areas, under similar conditions and with the same target market. These managers need to recognise the potential value of integrating their efforts with similar businesses to achieve mutual benefits.
REFERENCES
Abbasian, S. (2018). Solo travellers to city destinations: an exploratory study in Sweden. International Journal of Tourirsm and Cities, 5(1), 35-50. [ Links ]
Afrin, K., & Ramalingam, S. (2018). Human resource management practices and the employees intention to stay in the franchise of quick service restaurant. Journal of Advanced Research in Dynamical and Control Systems, 10(3), 1400-1404. [ Links ]
Araújo, W. M. C., Zandonadi, R, P., Tenser, C. M. R., Farage, P. & Ginani, V. C. (2018). Importance and level of adoption of food safety tools in foodservices. Journal of Culinary Science Technology, 1-20.
Aulia, R., Zakir, A., Dafitri, H., Siregar, D., & Hasdiana (2017). Mechanism of food ordering in a restaurant using Android technology. Journal of Physics: Conference Series, 930(1), 20-30.
Bai, L., Wang, W., Yang, Y. & Gong, S. (2019). Food safety in restaurants: the consumer perspective. International Journal of Hospitality Management, 77, 139-146. [ Links ]
Badii, M. H., Guillen, A., Araiza, L. A., Cerna, E., Valenzuela, J. & Landeros, J. (2012). Métodos No-Paramétricos de Uso Común. International Journal of Good Conscience, 7(1), 132-155. [ Links ]
Baptista Gomes, K. G., Conill Gomes, M. & Meyer, A. A. (2018). Multicriterial analysis in the evaluation process of suppliers of family agriculture products in university restaurants. Espacios, 39(6), 26. [ Links ]
Bardwell, A. M., Stephan, J. T., Rahman, I. & Reynolds, D. (2018). A structural model evaluating the relationships among dining frequency, involvement, and restaurant attributes. Journal of Food and Service Business Research, 21(6), 642-658. [ Links ]
Binkley, J. K. (2018). Nutrition and food choice: home vs. restaurants. Journal of Consumer Affairs, 53(3), 1146-1166. [ Links ]
Brown, J. R. (2020). The competitive structure of restaurant retailing: the impact of hedonic-utilitarian patronage motives. Journal of Business Research, 107, 233-244. [ Links ]
Bufquin, D., DiPietro, R. B., Partlow, C. & Smith, S. J. (2018). Differences in social evaluations and their effects on employee job attitudes and turnover intentions in a restaurant setting. Journal of Human Resources in Hospitality and Tourism, 17(3), 375-396. [ Links ]
Carrijo, A. P., Botelho, R. B. A., Akutsu, R. C. C. A. & Zandonadi, R. P. (2018). Is what low-income Brazilians are eating in popular restaurants contributing to promote their health? Nutrients, 10(4). http://10.3390/nu10040414. [ Links ]
Cerdá Suárez, L. M., Robina Ramírez, R., & Palos Sánchez, P. R. (2018). The influence of health and environment-focused values on restaurateur satisfaction in organic restaurants: A descriptive analysis in Spain. Cuadernos de Gestion, 18(2), 15-36. [ Links ]
Chen, K. J., Yeh, T. M., Pai, F. Y. & Chen, D. F. (2018). Integrating refined kano model and QFD for service quality improvement in healthy fast-food chain restaurants. International Journal of Environment Research and Public Health, 15(7). http://10.3390/ijerph15071310 . [ Links ]
Chen, Y. H., He, Q. & Paudel, K. P. (2018). Quality competition and reputation of restaurants: the effects of capacity constraints. Economic Research - Ekonomska Istrazivanja, 31(1), 102-118. [ Links ]
Choi, S., Lee, S., Choi, K. & Sun, K. A. (2018). Investment-cash flow sensitivities of restaurant firms: A moderating role of franchising. Tourism and Economy, 24(5), 560-575. [ Links ]
Chou, Y. C. & Chuang, H. H. C. (2018). A predictive investigation of first-time customer retention in online reservation services. Service and Business, 12(4), 685-699. [ Links ]
English, P. & Fleischman, D. (2017). Food for thought in restaurant reviews: lifestyle journalism or an extension of marketing in UK and Australian newspapers. Journalism Practice, 13(1), 1-15. [ Links ]
Ha, J. (2018). Why do people try different restaurants? The investigation of personality, involvement, and customer satisfaction. International Journal of Hospitality and Tourism Administration. http://10.1080/15256480.2018.1511498 [ Links ]
Han, H., Kim, W., Lee, S. & Kim, H. R. (2018). How image congruity and satisfaction impact customer retention at luxury restaurants: A moderated mediation framework. Social Behavior and Personality, 46(6), 891-904. [ Links ]
Han, S., Li, Y., Jiang, Y. & Zhao, X. (2018). Exploring the persuasion effect of restaurant food product online reviews on consumers' attitude and behavior. Proceedings of the 2018 International Conference on Internet and e-Business - ICIEB '18. April 2018: ACM International Conference Proceeding Series. [ Links ]
Hanna, S. & Rowley, J. (2019). The projected destination brand personalities of European capital cities and their positioning. Journal of Marketing Management, 35(11-12), 1135-1158. [ Links ]
Hsiao, Y. H. & Chen, G. T. (2018). Customer Kansei-oriented restaurant location evaluation using Kansei Engineering. [ Links ] 5th International Conference on Industrial Engineering and Applications, ICIEA 2018.
Hussain, K., Jing, F. & Parveen, K. (2018). How do foreigners perceive? Exploring foreign diners’ satisfaction with service quality of Chinese restaurants. Asia Pacific Journal of Tourism Research, 23(6), 613-625. [ Links ]
Iacobucci, D. & Grisaffe, D. J. (2018). Perceptual maps via enhanced correspondence analysis: representing confidence regions to clarify brand positions. Journal of Marketing Analytics, 6(3), 72-83. [ Links ]
Jung, S. S. & Jang, S. S. (2018). To cluster or not to cluster?: Understanding geographic clustering by restaurant segment. International Journal of Hospitality Management, 77, 448-457. [ Links ]
Kellershohn, J., Walley, K., West, B., & Vriesekoop, F. (2018). Young consumers in fast food restaurants: technology, toys and family time. Young Consumers, 19(1), 105-118. [ Links ]
Ketchum, A. (2018). The place we've always wanted to go but never could find: finding woman space in feminist restaurants and cafés in Ontario 1974-1982. Feminist Studies, 44(1), 126-152. [ Links ]
Kim, H. S. & Jang, S. S. (2019). Minimum wage increase and firm productivity: Evidence from the restaurant industry. Tourism and Management, 71, 378-388. [ Links ]
Kim, M. G., Yang, H. & Mattila, A. S. (2018). The impact of customer loyalty and restaurant sanitation grades on revisit intention and the importance of narrative information: the case of New York restaurant sanitation grading system. Cornell Hospitality Quarterly, 59(3), 275-284. [ Links ]
Lee, W. S., Choi, C. & Moon, J. (2018). The upper echelon effect on restaurant franchising: the moderating role of internationalization. International Journal of Culture, Tourism and Hospitality Research, 12(1), 15-28. [ Links ]
Lefèvre, S., Abitan, L., Goetz, C., Frey, M., Ott, M. & de Blay, F. (2019). Multicenter survey of restaurant staff’s knowledge of food allergy in eastern France. Allergo Journal International, 28(2), 57-62. [ Links ]
Line, N. D. & Hanks, L. (2018). Boredom-induced switching behavior in the restaurant industry: the mediating role of attachment. Journal of Hospitality and Tourism Research, 43(1), 101-119. [ Links ]
Liu, P. & Tse, E. C. Y. (2018). Exploring factors on customers’ restaurant choice: an analysis of restaurant attributes. British Food Journal, 120(10), 2289-2303. [ Links ]
Mhlanga, O. (2018). The fast food industry in South Africa: The microenvironment and its influence. African Journal of Hospitality, Tourism and Leisure, 7(4), 1-16. [ Links ]
Mun, S. G. & Jang, S. S. (2018). Restaurant operating expenses and their effects on profitability enhancement. International Journal of Hospitality and Management, 71, 68-76. [ Links ]
Rashid, N. R. N. A., Abdullah, S. L. S., Noor, S. M., Kassim, K. M. & Akbar, Y. A. A. (2018). The dimensions of Islamic restaurant image and its influence on customer satisfaction. International Journal of Supply Chain Management, 7(3), 251-260. [ Links ]
Saulo Hermosillo, M., & Pablo González, Y. (2013). Aplicación del mapa conceptual y la prueba Χ2 (Chi Cuadrada) para evaluar una webquest. [ Links ] IX Congreso Internacional Sobre Investigación en Didáctica de las Ciencias Girona, Comunicación con el Tema Origen De La Vida. UNAM, ENP. México.
Scopus database. (n.d.). Retrieved from https://www.scopus.com. [ Links ]
Spang, R. L. (2018). All the world’s a restaurant: on the global gastronomics of tourism and travel. Food and Global History, 79-91. [ Links ]
Souza Gomes, M. F., Lisboa Pereira, S. C. & Silva Abreu, M. N. (2018). Factors associated with the self-rated health of elderly frequenters of low-budget community restaurants in Belo Horizonte. Ciencia e Saude Coletiva, 23(11), 4007-4019. [ Links ]
Triola, M. F. (2018). Estadística. (12 ed.), México: Pearson Educación de México. [ Links ]
Yang, Y., Roehl, W. S. & Huang, J. H. (2017). Understanding and projecting the restaurantscape: the influence of neighborhood sociodemographic characteristics on restaurant location. International Journal of Hospitality Management, 67, 33-45. [ Links ]
Received: 22 July 2019. Revisions required: 19 August 2019. Accepted: 12 January 2020


