Introduction
Tourism in natural areas has increased its position among tourists' preferences internationally (CBI, 2020). The principal reason is man’s strong relationship with nature mountains, becoming a destination of excellent tourist influx (Rama et al., 2019). For instance, tourists in the Rocky Mountain National Park amounted to approximately 4.3 million in 2022, contrasted to 2.76 million in 2008 (Statista, 2023). The increasing demand has amplified debates on the benefits and risks to mountain environments, cultures, and communities (Mutana & Mukwada, 2018). For instance, generating economic development to sustain local livelihoods is a widely shared goal in protected areas (Dudley et al., 2013), especially for the United Nations Educational, Scientific and Cultural Organisation biosphere reserves. These have been assigned the role of model regions for sustainable development (UNESCO, 2017). Mountain-protected areas present opportunities for human-environment interactions and significant rural economic development by generating income and employment through visitors’ expenditures (Schägner et al., 2016). As demand develops globally (Assis & Inamdar, 2007), information about nature-based tourists becomes imperative for park managers, non-government agencies, and tourism operators (Pickering et al., 2020).
The hospitality industry relies on social media platforms to market its products/services and raise service quality by monitoring customer experiences (Brochado et al., 2020). The number of online reviews is increasing among tourists, supporting travellers' decision-making (Rita et al., 2022), which has pressed hotel managers to reorganise strategies to satisfy their customers (Amado et al., 2018).
Research in the hospitality industry has attempted to understand customer satisfaction, which appraises the degree of satisfaction based on perceptions of the attributes of hotels that the customers consider most significant (Lee & Hong, 2021). Hotel customer satisfaction drivers have already been identified in segment-specific markets such as beach hotels (Berezina et al., 2016), budget hotels (Peng et al., 2015), meeting hotels (Boo & Busser, 2018), boutique hotels (Wang et al., 2019), and wine hotels (Brochado et al., 2020). While this line of research has generated novel insights into hospitality and tourism management, studies have yet to analyse the reasons for UNESCO Global Geopark (UGG) hotel mountain customer satisfaction.
Considering previous studies and the remaining need of mountain hotel managers to explore what influences their customers' satisfaction, this research’s central question is: What drives hotel mountain customers’ satisfaction in UGG? Accordingly, this study aims to perceive the UGG Mountain Hotel customers’ satisfaction, the reasons for such sentiment, which variables influence satisfaction, and the customers’ appreciation regarding their experience. To achieve this aim, 5.590 TripAdvisor reviews were extracted from 20 hotels in the Estrela UNESCO Global Geopark (EUGG). Online user-generated content (UGC) is used to uncover intricate patterns in data (Xiang et al., 2015). In contrast to traditional survey-based methods, UGC provides cost-effective information and overcomes limitations associated with sampling size, time and location coercion, nonresponse bias, and self-reported errors (Eagles, 2014). We analysed data using the sentiment analysis (SA) technique to understand the satisfaction level and statistical analysis to understand which variables influence satisfaction (Oliveira et al., 2022). We used content analysis to comprehend the reasons for such sentiment. This study is the first comprehensive analysis of the customer satisfaction drivers of mountain hotels in UGG. Thus, it intends to offer insights for academia and hoteliers, highlighting customers' perceptions of UGG Mountain Hotel’s performance by understanding their specific strengths and weaknesses to meet their demands.
2. Literature review
2.1 Hotel customer satisfaction
Hotel customer satisfaction is a systematically documented subject that remarkably contributes to this industry’s development (Prayag et al., 2019). Following the expectancy-disconfirmation theory (Oliver, 1980), hotel satisfaction refers to the difference between the customers' pre-expectation and the experience’s perceived performance. When the experience equals or surpasses the expectation, the outcome is revealed by gratification and satisfaction. Conversely, displeasure and dissatisfaction occur when the perceived performance does not meet the expectations (Furtado et al., 2022). So, satisfaction is a judgment about the pleasure level of consumption-related fulfilment regarding product or service attributes, considering over-fulfilment levels (del Río et al., 2017). A satisfied customer may highly re-purchase, remain loyal for longer, and recommend others’ experiences by disclosing positive comments, positively affecting the hotel’s reputation and profitability (Coelho et al., 2023).
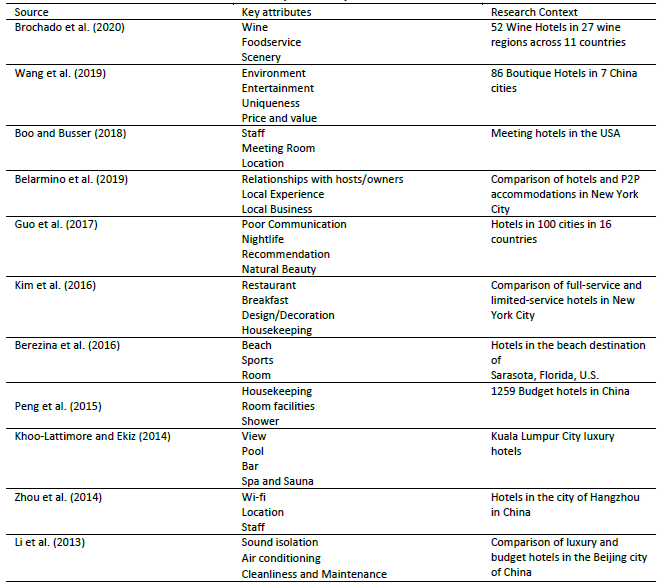
In contrast, dissatisfaction is a customer’s affective status when experiencing discomfort caused by service failure (Pereira et al., 2023). It intensifies this sentiment when confronted repeatedly by service failures and does not witness the service providers making sufficient recovery efforts (Weiner, 2000). This evokes emotions of anger and regret. It might drive customers to request refunds (García & Pérez, 2011) or lead to complaining behaviour and negative electronic word-of-mouth, which might hurt the hotel’s reputation and profitability (Berezina et al., 2016). However, each customer understands satisfaction differently, depending on the context (Ahania et al., 2019; Bueno & Gallego, 2021). Customers’ particular ways of judging how they view the world influence their overall assessment of quality and their perceptions of each specific transaction (Kim et al., 2019). According to the two-factor theory (Herzberg et al., 2010), the causes of dissatisfaction may differ depending on the customer. For instance, customers are simultaneously satisfied by different unrelated dimensions (Chan & Baum, 2007), and the absence of satisfiers does not necessarily lead to and reinforce dissatisfaction (Alegre & Garau, 2010). The challenge for service providers is recognising the potential failure situations and the specific effective response. Identifying the source of dissatisfaction is the first step to alleviating it. The next step is implementing service recovery strategies to improve satisfaction (Coelho et al., 2023). Considering that complaining behaviour is a reaction that requires a response demanding additional cost and effort, proper management decisions can only be made if the drivers of satisfaction are known (Table 1).
2.2 Mountain hotel customer experience in UNESCO’s Global Geoparks
Tourism development in vulnerable environments is essential, particularly in protected mountain areas, which often have poorly developed economies (FAO, 2011). Although the United Nations Educational, Scientific, and Cultural Organization’s biosphere reserves objective is biodiversity conservation and socio-economic development for human well-being (UNESCO, 2017), nature- based tourism is searching for sustainable development of local communities since they also generate considerable income.
A mountain tourism destination is considered a geographical, economic, and social place specifically conceived for tourists of mountain infrastructures (Kuščer et al., 2017), offering a diversity of tourism products depending on climate, geomorphology, and vegetation (Favre-Bonte et al., 2019). In this setting, tourists can be in contact with nature in the most suitable way (Duglio & Letey, 2019). As mountain tourism continuously increases, mountain hotels are gaining relevance (Popovic et al., 2019). They have become vital to meeting tourists’ expectations and satisfaction, attempting to engage with tourists’ specificities in a geographical area where infrastructures are components of a complex structure adapted to territory physiognomies (Favre-Bonte et al., 2019). Previous studies suggest that mountain tourists’ drivers are related to snow conditions (Matzler et al., 2008), nature, and active tourism conditions (Pan & Ryan, 2007).
One may argue that the systemic environment contributes to a mountain tourist’s positive experience and that hotels are part of such an environment. To this end, the satisfaction of mountain hotel customers is essential for sustainable hospitality decisions.
Studies using online reviews have determined the attributes that drive and most influence satisfaction from an urban aggregate standpoint. However, research is scarce from the viewpoint of UNESCO’s Mountain hotel customers’ segment-specific differences. Thus, this study addresses various aspects of this research gap by determining the attributes that most influence customer satisfaction.
3. Methodology
To achieve this study’s aim, we collected data from TripAdvisor. The sample comprises the reviews published by customers in four- and five-star mountain hotels in the EUGG. We chose this hotel classification criterion because segmenting the data will reveal more precise results since the perception of quality might broadly vary between high and low hotel ratings (Rita et al., 2022). We classify the hotels in the EUGG as mountain hotels once they are in a specific geographic location recognised by high elevation (Favre-Bonte et al., 2019).
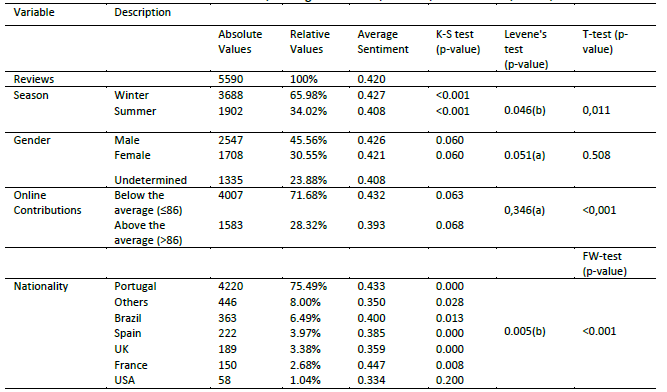
We chose TripAdvisor because it is one of the most widely used travel websites to access and share hotel information, which contains more than 859 million reviews and 459 million monthly visitors (Ramos et al., 2022; TripAdvisor, 2023). The dataset was collected using Octoparse web scrapper by exporting each TripAdvisor review to a CSV file. This free software was used to collect large amounts of data accurately, quickly, and conveniently in previous studies (Deng et al., 2020). 5.590 reviews were collected from 20 EUGC mountain hotels, and we characterised the variables collected in Table 2.
For data analysis, we employed three procedures. In the first stage, SA was used to determine the level of satisfaction. Second, t- test and ANOVA were used to test the differences in satisfaction according to the collected variables (Table 2). Third, we implemented a qualitative analysis to understand the reason for such satisfaction. The SA analyses words and expressions in a text to understand users’ sentiments (Rita et al., 2020). SA has been used in previous studies, providing interesting results. For instance, to find consistency between specific words in different hotels (Geetha et al., 2017) or support the need to improve online review platforms once many potentially helpful reviews receive little attention from consumers (Olorunsola et al., 2023).
The open-source R software program for statistical computing includes multiple packages (Furtado et al., 2022). The package “sentimentr” was applied to compute the sentiment score. The outcome identified the positive, neutral, and negative reviews. Text data were pre-processed for analysis using the “tm” package, removing punctuations, numbers, white spaces, stemming, and converting all letters to lowercase (Ramos et al., 2019). This package returned the most frequent terms, aiming to discover key concepts to guide the coding in qualitative analysis.
The software IBM SPSS Statistics 27 was used to test the differences in satisfaction between different groups of visitors, following the methodology described by Field (2018). Regarding gender, season, and number of online contributions that generate a comparison between the two groups, we used a t-test. Before conducting this test, the assumptions of normality and homogeneity of variances were evaluated using the Kolmogorov-Smirnov test (K-S) and Levene's test, respectively. We used an ANOVA with the Welch FW for the nationality variable, which is suitable when the variances are not homogeneous. We used the Games-Howell test to verify which pairs of nationalities have statistically significant differences.
To understand the reasons for the satisfaction, we used MAXQDA 2020 software. This software can scrutinise qualitative data and establish relationships (Booth, 2014). The use of such a method has been encouraged by several authors (Lu & Stepchenkova, 2015; Onwuegbuzie et al., 2012), highlighting the importance of using qualitative approaches to obtain more research outcomes. Previous studies used and validated this method (Hodsdon, 2020).
Before the qualitative analysis, we separated positive and negative reviews to acknowledge the reasons for positive and negative satisfaction. We created codes for analysis through a twofold method. Firstly, by identifying attributes validated in the literature (Table 1). Secondly, interpretation bias was reduced through a summative content analysis supported by the reviews’ most frequent words. Consequently, we reduce overlap and wordiness among the attributes to code by condensing literature attributes and the most frequent words to develop a coding scheme inductively, reaching 14 positive and 20 negative attributes. This quantification explores the dataset usage to eliminate such labelling creation's inherent subjectivity (Hsieh & Shannon, 2005). After defining attributes, ‘in vivo coding’ was applied by labelling text sections (Booth, 2014). Following the approach of Beverland et al. (2021), a mountain hotel professional undertook this process.
4. Results
4.1 Sentiment analysis on reviews
To acknowledge the satisfaction of the Hotels’ customers, we applied SA to the 5.591 online reviews (Table 3).
Sentiment values ranged from -0.68 to 2.46, corresponding to the negative and positive poles. Most reviews were positive (95.82%), while 4.18% were negative. This result is consistent with previous studies (Li et al., 2013).
The dataset characterisation, the average sentiment by group, K-S test, Levene's test, t-test, and Welch FW test results are presented in Table 4.
4.2 Comparison of groups based on gender
We evaluated the normality assumption using the K-S test, having found that the distributions of the two samples are normal (p- value>0.05). We verified the assumption of homogeneity of variances through Levene's test based on the mean (because the distributions are normal), concluding that the variances are homogeneous (p-value>0.05). The t-test, calculated based on the assumption that the variances are equal, allows us to assess whether equality of means exists in the sentiment score for males and females. Since the p-value is greater than the significance level adopted (0.05), the test’s null hypothesis is accepted, concluding that the sentiment scores of males and females do not differ significantly.
4.3 Comparison of groups based on the season of the year (Winter - October to May and Summer - June to September)
We evaluated the normality assumption using the K-S, finding that the distributions of the two samples are abnormal (p-value<0.05). Failing to confirm this assumption does not preclude the execution of the t-test, as the absolute values for skewness and kurtosis for each group are less than 3 and 8, respectively (Kline, 2015). We verified the assumption of homogeneity of variances using Levene's test based on the median (because the distributions are not normal), concluding that the variances are not homogeneous (p-value<0.05). The t-test, calculated based on the assumption that the variances are not equal, allows us to assess whether equality of means exists in the sentiment score in winter and summer. Since the p-value is lower than the significance level adopted (0.05), the test’s null hypothesis is rejected, concluding that the sentiment score in the winter is significantly higher than in the summer.
Comparison of groups based on the number of online contributions
We evaluated the normality assumption using the K-S test, having found that the distributions of the two samples are normal (p- value>0.05). We verified the assumption of homogeneity of variances through Levene's test based on the mean (because the distributions are normal), concluding that the variances are homogeneous (p-value>0.05). The t-test, calculated based on the assumption that the variances are equal, allows us to assess whether there is equality of averages in the sentiment score of users with several comments below average and above average. Since the p-value is lower than the adopted significance level (0.05), the test’s null hypothesis is rejected, concluding that the sentiment score of users with several comments below the average is significantly higher than that of users with a higher-than-average number of comments.
4.4 Comparison of groups based on nationality
We evaluated the normality assumption using the K-S test, having found that the distributions of six samples are not normal (p-value<0.05) and one is normal (p-value>0, 05). Failure to verify this assumption in six groups does not impede the ANOVA. We verified the assumption of homogeneity of variances using Levene's test based on the median (because there are non-normal distributions), concluding that the variances are not homogeneous (p-value<0.05). ANOVA with the Welch FW test was used to assess whether there is equality of averages in the sentiment score of visitors from different nationalities. Since the p-value is lower than the adopted significance level (0.05), the test’s null hypothesis was rejected, concluding that there are statistically significant mean differences in the sentiment score of visitors of at least two nationalities.
The Games-Howell test was used to confirm which pairs of nationalities are statistically different in sentiment score. Whenever the p-value of the test is lower than the adopted significance level (0.05), we reject the test’s null hypothesis, concluding that the pair of means under analysis differs significantly. The nationalities with a statistically significant difference in sentiment score are presented in Table 5, concluding that French and Portuguese visitors have a higher sentiment score than the UK, USA, and other countries.
4.6 Word frequency
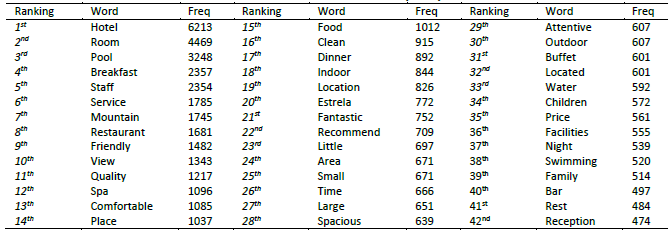
Table 6 highlights the most mentioned terms in online reviews.
Excluding the term ‘hotel’, since it is the subject of analysis, the most frequent term is ‘room’, which does not differ from previous studies (Franco et al., 2016). However, ‘pool’ in the second place is an unusual distinction in the literature (Xiang et al., 2015). In the top ten, ‘breakfast’ and ‘restaurant’ do not significantly change regardless of the hotel market, as well as ‘staff’, ‘services’, and ‘friendly’, which also play a vital role in the general hotel industry (Zhou et al., 2014).
4.6 Content analysis
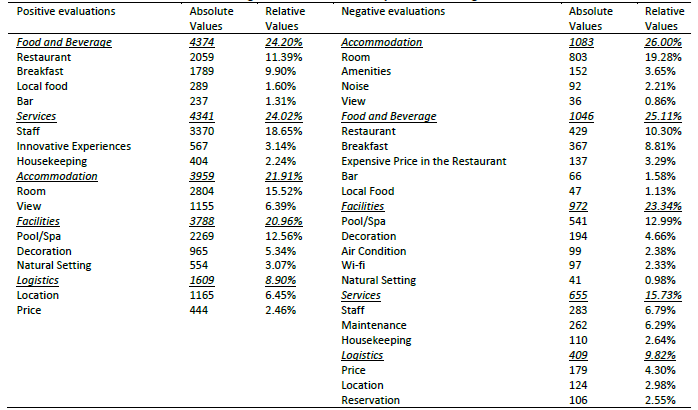
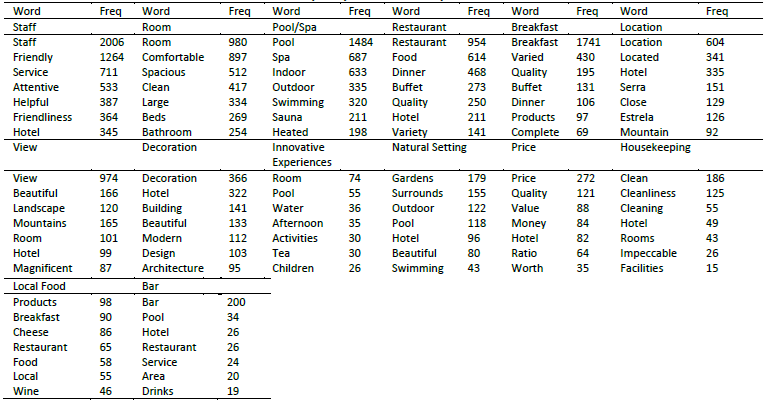
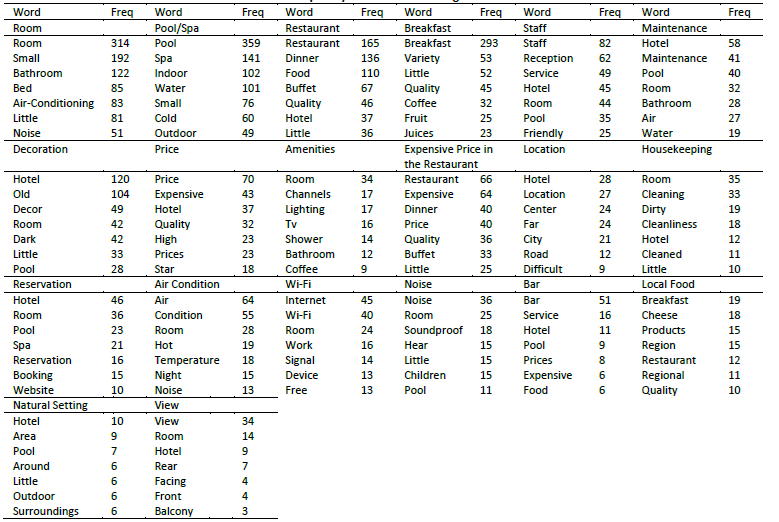
From the background knowledge gained of the most frequent words and multiple attributes validated in the literature, the positive and negative attributes that most influence mountain hotel customers can be retrieved from Table 7.
Considering each category's relative weight in both sets, the ‘services’ have a substantial superior weight in positive evaluations, whereas the ‘accommodation’, ‘food and beverage’, ‘facilities’, and ‘logistics’ have a superior weight in negative evaluations. Regarding the attributes' relative weight in both sets, the ‘room’ has a superior weight in negative evaluations, while ‘staff’ has a superior weight in positive. Regardless of those results, ‘pool/spa’ emerged as an important attribute within this market but has a higher weight in negative evaluations. ‘Restaurant’, ‘breakfast’, ‘decoration’, ‘local food’, ‘housekeeping’, and ‘bar’ have comparable weights. ‘Location’, ‘view’, and ‘natural setting’ have a higher weight in positive evaluations, while ‘price’ has a greater weight in negative evaluations.
The results suggest that attributes that satisfy customers do not necessarily make them dissatisfied, and vice versa (Coelho et al., 2023). For instance, absent in the positive set, ‘maintenance’, ‘amenities’, ‘expensive price in the restaurant’, ‘reservation, ‘air-condition’, ‘wi-fi’, and ‘noise’, do not necessarily lead to or reinforce satisfaction (Alegre & Garau, 2010). However, those dissatisfaction sources are more likely to disappear if everything goes well or works appropriately. On the other hand, the absence of ‘innovative experiences’ does not necessarily generate dissatisfaction but will help to improve satisfaction. Tables 8 and 9 illustrate the most mentioned words in each positive and negative evaluation to understand the online discourse. Results highlight the most recurrent terms for each attribute. This allows understanding of the customers’ discourse regarding their experience by different patterns of words to describe the experience (Rita et al., 2022). For instance, ‘room’ is presented in both sets but with other words among positive and negative evaluations. From the positive perspective, ‘comfortable’, ‘spacious’, ‘clean’, ‘large’, ‘beds’, and ‘bathroom’ were the most mentioned. On the other hand, ‘small’, ‘bathroom’, ‘bed’, ‘air-conditioning’, ‘little’, and ‘noise’ are unfavourable.
5. Discussion
Several key findings emerged from the textual data based on quantitative and qualitative content analysis. From the SA online reviews, this study supports the findings of prior studies that suggest that positive reviews generally outnumber negative ones (Furtado et al., 2022). The group comparison suggests that satisfaction varies according to the customer’s nationality. This result is aligned with Vieira et al. (2021), who acknowledged that satisfaction differs depending on the customer’s nationality. Visitors from different nationalities have different expectations (Zgolli & Zaiem, 2017), influencing their attitudes, behaviours, and evaluations (Johnson & Grier, 2013). Results suggest that seasonality influences the mountain UNESCO’s hotel visitor satisfaction, confirming the results of Geng et al. (2021), who suggest significant differences in visitor satisfaction in different seasons. However, these results contradict Kozak and Rimmington’s (2000) findings that summer vacations predict higher satisfaction. Over-tourism is one factor that affects dissatisfaction in the summer peak season (Frleta & Jurdana, 2018).
Results suggest that the number of online contributions impacts satisfaction. As the tourist increases the number of experiences, their feedback becomes more realistic (Fang et al., 2016), influencing their satisfaction. This allows the tourist to compare the experience with past experiences, making the experience more realistic. The average male’s sentiment does not significantly differ from females. This result contradicts previous studies. For instance, Kladou and Mavragani (2015) suggest that men share more positive reviews, and males and females reveal different preferences and satisfaction levels (Han et al., 2017, 2019). Accordingly, it would be expected that the males' sentiments would be higher than those of the females. This result could be related to the fact that males and females were concentrated on the service result when evaluating.
The word frequency analysis revealed that the terms pool, spa, dinner, indoor, outdoor, buffet, children, or swimming are unique for this market segment as they were not mentioned in previous studies in different markets (Franco et al., 2016; O’Connor, 2010; Xiang et al., 2015).
In the qualitative content analysis, the categories that aggregate the higher relative weight from each attribute in both sets are food and beverage (24.66%), accommodation (23.96%), facilities (22.15%), services (19.88%), and logistics (9.36%). Our results complement previous studies that identified room experience (e.g., room features, amenities) and service quality (interactions with staff or food and beverage services, quality, and availability) as the most critical dimensions (Guo et al., 2017; Zhou et al., 2014). Particularly, the attributes most mentioned by the customers are staff, room, pool/spa, restaurant, and breakfast. Pool/spa is the attribute that influences different contexts (Guo et al., 2017; Xu & Li, 2016). Therefore, the results suggest that pool/spa is mountain hotels’ most relevant differentiating attribute. Consequently, hotels with pool/spa at a fulfilling level of satisfaction will have a competitive advantage. Dissatisfaction results highlight that the pool/spa might be too small to swim, and the water is cold. Pool and spa are also emphasised in maintenance, decoration, reservation, natural setting, and noise, which supports uncertainties of a relaxed moment via noise provoked by children. Indeed, pools/spas targeted to families with children are more popular, but their services may not correspond to all customers’ desires (Koskinen & Wilska, 2019). Thus, the first-rate strategy is to promote a separate pool/spa for families and couples.
As mountain hotels are constrained to the specific territory’s physiognomies, results show that customers do not need to be located close to airports (Zhou et al., 2014). However, results emphasised assessability issues, such as distance, city, road, and difficulty, which can be partly improved by offering a pick-up and a drop-off service. Considering the hotel’s environment and that customers enjoy natural surroundings, the view beneficially meets customers’ expectations. Accordingly, it is one of the most relevant attributes of mountain hotels. Thus, hoteliers should highly promote the landscape since results suggest that customers value the view over the mountain (Khoo-Lattimore & Ekiz, 2014). Following visitors' motivations, the natural setting emerged, emphasising the image of gardens and the outdoor surroundings as a distinctive attractiveness factor (Pan & Ryan, 2007). Therefore, this is a relevant differentiating attribute of mountain hotels.
The local food attribute is a high-relevance factor for hotel mountain customers. This attribute is unique under this market segment as it is not mentioned in previous studies (Kim et al., 2016; Xu & Li, 2016). Accordingly, local products should be included in the hotel experience (Brochado et al., 2020). The high restaurant price was also emphasised (Zhou et al., 2014), revealing that the hotel mountain experiences are expensive. To meet the high price expectations, hoteliers can develop seasonal cuisines, encourage customers to customise their dishes (Lai, 2015), avoid purchasing items from distant regions during off-seasons, and increase nutritional worth to favour higher value (Frash et al., 2015). Contrary to previous studies (Li et al., 2013), hotel mountain customers highly value the air conditioner. As mountain hotels are widely affected by severe climatological variations (Favre-Bonte et al., 2019), air condition is among the most influential attributes. Thus, uncontrolled temperatures are dissatisfaction factors that should be avoided.
These results emphasise the context-specific nature of customers’ preferences, underscoring the need for tailored hotel
management strategies. It supports the idea that analysing other market segments may reveal different patterns that are not evident across the entire market (Stringam & Gerdes, 2010). For instance, housekeeping is among the core attributes of budget hotels (Peng et al., 2015). However, in this study, housekeeping is one of the attributes with less weight.
6. Conclusions and Implications
This study aimed to answer the following research question: What drives hotel mountain customers’ satisfaction in UGC?
This study’s results suggest that pool/spa is the most relevant differentiating attribute of mountain hotels, which remarkably is an attribute not recognised for its influence in various contexts due to its lack of evidence in previous studies (Guo et al., 2017; Khoo- Lattimore & Ekiz, 2014; Xu & Li, 2016). In addition, the nonexistence recognition of factors such as location, view, natural setting, local food, and air conditioning in previous studies underscores its significance as a distinctive attribute in this segment. This study unveiled mountain hotel strengths/weaknesses from the customers’ perspective, confirming the expectation-disconfirmation (Oliver, 1980) and two-factor theory (Herzberg et al., 2010). The results of this study confirm previous studies suggesting that visitors’ satisfaction varies according to nationality (Vieira et al., 2021) and season (Geng et al., 2021). The higher the number of comments, the lower the satisfaction (Furtado et al., 2022). The results are also in line with prior studies identifying room experience (features, amenities) and service quality (staff interactions, food services) as crucial dimensions (Guo et al., 2017; Zhou et al., 2014). Contrary to other studies (Kozak & Rimmington, 2000), findings suggest that satisfaction in winter is significantly higher than in summer. This study finds no significant difference in sentiment between genders, contrary to previous research (Kladou & Mavragani, 2015), suggesting no gender-based differences in preferences and satisfaction levels.
6.1 Theoretical Implications
This study expanded the literature on hotel customer satisfaction (e.g., Furtado et al., 2022; Rita et al., 2022), segment-specific research in hospitality industry (e.g., Berezina et al., 2016; Omran et al., 2023), and experiential tourism in unique contexts (e.g., Brochado et al., 2020; Solakis et al., 2022), by highlighting the asymmetric results across mountain hotel customer satisfaction in UGG. In essence, this study deepens the theoretical understanding of mountain hotel customer satisfaction and paves the way for future research in niche areas of the hospitality sector.
6.2 Practical Implications
We should address implications for research and hotel management. First, results emphasise that hoteliers should pay attention to pool/spa, location, view, natural setting, local food, and facility problems such as the restaurants’ high prices and air- conditioning. Hotel managers should direct efforts to enhance value and increase satisfaction. Within these factors, this study underscores the pivotal role of offering a satisfying pool/spa experience to give mountain hotels a competitive edge. However, dissatisfaction factors such as pool size, water temperature, and noise, especially from children, reveal subtleties. A strategic approach involves creating separate pool/spa areas for families and couples. As results also emphasised accessibility issues, satisfaction can be partly improved by offering a pick-up and a drop-off service. As mountain hotel customers highly value natural views, considering them a key factor in their satisfaction, hoteliers should leverage this preference by promoting the scenic landscape. Furthermore, to address price concerns and enrich menu choices, hoteliers should align with customers’ preferences in considering local food.
Second, this study's results add essential elements of mountain hotel customers that go beyond their experience evaluation. The SA results reveal that the sentiment score in the winter is significantly higher than in the summer, demonstrating seasonal variations in customer satisfaction. Customers with a higher-than-average number of comments score lower sentiment, emphasising the importance of addressing these customers' concerns. Additionally, the results suggest that French and Portuguese visitors consistently have a higher sentiment score than visitors from other countries. These insights enhance our understanding of customer experiences and offer practical guidance for service improvements. Such knowledge may help profile reservations, marketing strategies, and customer interactions to align with the preferences of customers, ultimately fostering a more satisfying and personalised hospitality experience.
6.3 Limitations and suggestions for future research
The difficulty in recognising irony and sarcasm might cause misunderstanding in SA (Farias & Rosso, 2017). The content analysis moderated this constraint. However, by its nature, a qualitative approach has limitations in terms of objectivity. Further quantitative research is desired to endorse its robustness. The dataset comes from a single website, which may impair the observations obtained. The sample comprises reviews from customers of four and five-star hotels in the mountains of the EUGG. Some caution in exercising extended findings is necessary to all reviews found online, nor should they be extended to reviews of other types of hotels. Using larger datasets of various reviews across UNESCO's Global Geoparks mountain hotels will support this study’s specific findings for future studies.


