


 Inglês (pdf)
 Artigo em XML
 Referências do artigo
 Enviar este artigo por email
 Citado por SciELO
  Similares em
SciELO
Similares em
SciELO 
 Permalink
Introduction
In a globalised society, surrendered to the visual, ephemeral and aesthetics of consumption, the tourist industry is known as an industry of dreams (Le et al., 2019) and tourists as "hedonic vacationers" (Li et al., 2023, p. 5). 'See and be seen' is a crucial leitmotif when tourists choose their holiday destination, and sharing images becomes an important activity during vacations. In so doing, tourists play a critical role in crafting a destination image by creating online narratives (Li et al., 2023; Lund et al., 2018). In this context, social media is a powerful tool for shaping the online image of a destination since these platforms offer tourists and practitioners new opportunities and challenges to manage the image of the destination (Mak, 2017; Pan et al., 2007; Xiao et al., 2022). Being a popular topic since the early 70s (Gunn, 1972; Hunt, 1971; Mayo, 1973), tourism destination image (TDI) is a well-documented field of research that continuously attracts academics' and practitioners' attention (Li et al., 2023; Trang et al., 2023; Xiao et al., 2022). Although recognised as a multidimensional construct, its conceptualisation and operationalisation are still under discussion (Afshardoost & Eshaghi, 2020; Lai & Li, 2016). Typically, destination image has been conceptualised as bi-dimensional, including cognitive and affective components (e.g., Baloglu & Brinberg, 1997; Bui et al., 2022; Qu et al., 2022), or tri-dimensional, also including the conative component (e.g., Gartner, 1993; Tasci et al., 2007).
Although the link between destination image, memorable tourist experiences and loyalty is known (e.g., Kutlu & Ayyildiz, 2021; Tiwari et al., 2023), tourists are novelty-seekers even if they live positive experiences. Therefore, the content shared by tourists on social media is even more relevant, as it is highly influential on travel-related decision-making, destination choice and the reputation of the destination (e.g., Mak, 2017; Jiménez-Barreto et al., 2020; Li et al., 2023; Qu et al., 2022). Testimonials generated by tourists about travel experiences, in textual or graphic form, establish a content-helpful repository to understand the destination image as perceived by visitors (He et al., 2022; Farinha et al., 2023: Pontes & Ramos, 2023). Online Destination Image (ODI) is "the online representation of collective beliefs, knowledge, ideas, feelings and overall impressions of a destination" (Mak, 2017, p. 282). This organic data is relevant to portraying a more realistic and trustful image of the destination, considering its characteristics and tourists' emotions and feelings. Regarding this aspect, practical emotion-mining tools are crucial to characterising the dynamic and complex image of the destination and the feelings expressed online by visitors (Jiang et al., 2021; Qu et al., 2022). Even though it is not possible to access the demographic elements of tourists who are sharing content on social media (Jiang et al., 2021), the textual analysis, such as related to sentiments and tangible and intangible characteristics of destinations, brings significant theoretical contributions and practical implications for decision-makers (Pikkemaat et al., 2019). It can also be regarded as an area of marketing innovation (Pikkemaat et al., 2019) by combining sentiment analysis with secondary data from websites. Sentiment analysis is critical to understanding tourists' emotions and behavioural intentions (Jiang et al., 2021; Qu et al., 2022). In fact, it is a popular topic that several authors have addressed with respect to different destinations (e.g., Bui et al., 2022; George & Ramos, 2024; Jiang et al., 2021; Lalicic et al., 2021; Li et al., 2023; Mak, 2017).
Although studies on ODI are flourishing, there is no consensus on their definition and measurement (Bui et al., 2022; Mak, 2017). Furthermore, the variations in tourists' sentiments and dynamics at different times (seasons) are poorly understood (Bui et al., 2022). Variations across other social media platforms and destinations are also recognised in the literature (Jiang et al., 2021; Ramos, 2022; Ren & Hong, 2017). For example, Bui et al. (2022) developed a holistic framework to measure ODI using data from Flickr and Twitter in three tourism destinations in Australia. The authors recommend investigating the images tourists share online using other social media platforms as well as other tourism destinations to provide decision-makers with accurate data.
Although the sentiments travellers share about the places they visit in their reviews offer trustworthy justifications for their experiences, feelings, and emotions that "go numerical ratings" (Bigné et al., 2021, p. 1), the engagement rate is also a useful indicator of the performance of the TDI (Schreiner et al., 2019). This process enables researchers to examine how visitors interact and show interest in the destination by examining its defining characteristics. In order to better understand how travellers portray a location on social media platforms and to highlight areas for improvement or enhancement regarding destination promotion, sentiment analysis and engagement rate are combined.
Against this background, this research attempts to quantify the ODI that user-generated content (UGC) on social media portrays, considering the tri-dimensional nature of TDI and its influence on visitors' interactions. It is also intended to depict which categories generate more positive tourist sentiments and whether these sentiments correspond to each engagement dimension.
Inspired by the gaps identified above, this study intends to measure the ODI portrayed by UGC in social media, considering the complex, multidimensional, and dynamic nature of TDI and its impact on tourists' engagement. Data shared by tourists on Facebook and Instagram between January 1, 2018, and May 31, 2022, were collected from the official Website of the Algarve Region using the Fanpage Karma tool (2022). Sentiment analysis was used to understand the effectivity of the tourists towards the destination, which, combined with the engagement rate, disclosed the ODI as informed by the experience at the destination.
In addition to the introduction and conclusion, this study was divided into three sections. Firstly, the literature review provides the state-of-the-art and conceptual foundations of the topic under research. Secondly, the methodology addresses the research problem and introduces data analysis methods and steps for sentiment analysis. Finally, results, conclusions, discussion and implications are disclosed.
2.Literature review
2.1 (Online) Destination Image
Since the early 1970s (Gunn, 1972; Hunt, 1971; Mayo, 1973), TDI has been a popular and well-documented research topic that continues to draw the attention of both academics and practitioners (Li et al., 2023; Trang et al., 2023; Xiao et al., 2022). Despite being recognized as a multidimensional construct, its conceptualization and operationalization remain subjects of ongoing debate (Afshardoost & Eshaghi, 2020; Lai & Li, 2016, among others). Despite the lack of consensus, one of the most consensual definitions of destination image was first introduced by Crompton in 1979, which refers to "the sum of beliefs, ideas and impressions that a person has of a destination" (Crompton, 1979, p. 18).
As an online collective representation, ODI corresponds to "the holistic impressions, perceptions and feelings that tourists share online about the touristic products and offerings in a destination" (Mak, 2017, p. 282). The main difference between destination image and online destination image is that new technologies and social networks now allow tourists to create and share content and, consequently, co-create the destination image by sharing their own experiences and images about the place (Lund et al., 2018; Mak, 2017). Recognising the complex, relativistic and dynamic nature of the DTI (Gallarza et al., 2002; Guerreiro et al., 2020), the construct is conceptualised as three interrelated components encompassing cognitive, affective, and conative dimensions (Gartner, 1993). On the other hand, Baloglu and McCleary (1999) posit that destination image is a bi-dimensional construct comprising cognitive and affective components that, together, result in an overall or global image. The cognitive component refers to an individual's knowledge and beliefs about a destination (Gartner, 1993; Daskin & Asan, 2022). The affective component refers to emotions, feelings, and attachment towards the destination (Baloglu & Brinberg, 1997; Russell & Pratt, 1980; San-Martín & Del Bosque, 2008). The conative image refers to future behavioural intentions (Gartner, 1993), including the intention to revisit, recommend, and spread positive word-of-mouth (Chen & Tsai, 2007; Gartner, 1993; Tasci et al., 2007). Finally, the global image results from perceptual or cognitive and affective assessments concerning the place and its brand (Baloglu & Brinberg, 1997; Baloglu & McCleary, 1999; Castro et al., 2007). Attentive to an online empirical context and using UGC on Airbnb in peer-to-peer accommodation, Lalicic et al. (2021) conceptualize the TDI as a tri-dimensional construct comprising the designative component, that includes the physical and cognitive aspects related to places and their spatial and temporal characteristics (e.g. seasonality); the appraisal component, which involves the emotions, feelings and moods associated with the touristic experience; and the prescriptive component, including an attitudinal and behavioural response to the touristic experience.
Research stresses that TDI influences tourists' decision-making process before, during and after the experience (e.g., Baloglu & McCleary, 1999; Bigné et al., 2009; Guerreiro et al., 2020; Lalicic et al., 2021; Matos et al., 2015). Before the experience, destination image impacts tourists' imagery about the destination and expectations; organic and induced sources are relevant sources of information (Gartner, 1993; Matos et al., 2015; Tasci & Gartner, 2007; Lalicic et al., 2021). In fact, at this stage, destination image can be shaped by organic sources like the Internet and mainly the content shared on social media (Lalicic et al., 2021). On-site, the activities tourists engage in during their stay at the destination shape pre-existing images, and an experiential image emerges (Abuhjeeleh et al., 2018; Chon, 1990; Kim, 2018; Matos et al., 2015; Vaughan & Edwards, 1999; Veloso et al., 2024). When returning home, meanings are attached to experiences stored in memory (Anaya & Lehto, 2023; Brown, 1992), shaping tourists' loyalty (Luvsandavaajav et al., 2022; Zhang et al., 2014).
While TDI is recognised as critical to inform the design of tourism experiences and marketing strategies (Echtner & Ritchie, 1993; Kim & Fesenmaier, 2017; Lalicic et al., 2021), new approaches and tools to analyse data from the online content stored on social media platforms are needed (Nayak et al., 2023). However, despite its acknowledged relevance, the most appropriate approaches and tools are still under debate and at an early stage (Bui et al., 2022; Jiang et al., 2021). Since the destination image comprises a set of unique attributes and activities tourists experience during their stay, UGC is "affected by the viewers' lens" (Bui et al., 2022, p. 4), which allows researchers to study tourists' feelings, perceptions, and behaviours using spontaneous data they share (Deng & Li, 2018; My, 2023; Pourfakhimi et al., 2020). To advance this topic, Bui et al. (2022) developed a holistic measure of TDI which integrates several dimensions from UGC shared by tourists on social media. As the TDI is a multidimensional construct, relevant categories and related subcategories should be identified to include its various characteristics in the online environment. According to Bui et al. (2022, p. 6), each category "can be measured using two quantities: (1) the popularity (or frequency) of the construct in association with the tourism destination and (2) tourists' sentiment about the construct (feelings, impressions, satisfaction). According to the authors, the former corresponds to the cognitive component of TDI and the latter to the effective one. Since the TDI is a dynamic construct, its variations in different moments, locations and seasons should be considered, and it discloses the conative component of ODI (Bui et al., 2022).
2.2 Online Engagement
From the tourism perspective, engagement refers to customers (tourists, in this case) involved in the development and dissemination of information and knowledge by talking, writing reviews and providing content that recommends brands (products or destinations), a process that might enhance destination brand loyalty (Chen et al., 2020).
After Brodie et al. (2011) first introduced the concept of engagement in the marketing literature, the concept has been approached from different perspectives and across different disciplines such as psychology (e.g., task engagement), organisational behaviour (e.g., employee engagement), sociology (e.g., civic engagement) and marketing (e.g., customer engagement) (Brodie et al., 2011; Hollebeek et al., 2019; So et al., 2014; Verhoef et al., 2010; among others). In marketing and tourism fields, engagement is approached from different perspectives, including consumer engagement (Vivek, 2009), customer engagement behaviour (van Doorn et al., 2010), visitor engagement (Bryce et al.., 2015), online reviewer engagement (Mathwick & Mosteller, 2017), peer engagement behaviour (Lin et al., 2019), tourists' relationship with destination brands (Ahn & Thomas, 2020), intention to engage with a destination (Zhang et al., 2018), as a predictor of tourists' loyalty toward destination brands (Chen et al., 2020; So et al., 2020) or exploring the relationship between colour and user engagement in a destination-based research (Yu & Egger, 2021). Although notable work has been developed on the topic in tourism and hospitality settings, it is yet a challenging field of research (Rather, 2020) since the conceptualisation and dynamics of the construct remain unclear. Nevertheless, it has attracted the interest of academics and practitioners in the field (Harmeling et al., 2017; Hollebeek et al., 2022).
Although there is agreement that engagement is a multidimensional concept (Bowden, 2009; Brodie et al., 2011; Hollebeek et al., 2014; Kumar & Kaushik, 2020), a clear definition of customer engagement is still under debate. Following the psychological (behavioural) approach to conceptualising customer engagement, Hollebeek et al. (2014, p. 154) define engagement as "a consumer's positively valenced brand-related cognitive, emotional and behavioural activity during or related to focal consumer/brand interactions". Hollebeek et al. (2014) proposed an alternative brand engagement framework comprising three fundamental dimensions: cognitive processing, affection, and activation. The cognitive processing characterises the degree to which customers think of the brand when interacting with it; affection signifies positive emotions of the customers about the brand; and activation reflects the effort, energy and time that customers devote to the brand (Chen et al., 2020). Also, another research stream approaches engagement as a behaviour, thus focusing on customers' interaction with brand-related elements (e.g., Dolan et al., 2016; Eigeraam et al., 2018; Yu & Egger, 2021).
The transition to an era of relational marketing (Santos et al., 2022) makes the interactive nature of engagement (Rather et al., 2019) particularly relevant in tourism settings where the shift toward more dynamic and interactive business environments (Hollebeek et al., 2019; Kumar & Pansari, 2016) claim to engage customers as much as possible (So et al., 2014). Such transition extends beyond focusing on traditional marketing metrics (e.g., quality, image, satisfaction, value, loyalty, and trust), highlighting customer engagement as a driver to reach a higher level of differentiation and a unique, sustainable competitive advantage (Riley, 2020).
So et al. (2016) indicated that customer engagement contributes to the positive evaluation of the destination, raising their level of trust and loyalty towards that destination. This means that customers develop and disseminate information and knowledge by talking, writing reviews and providing content recommending products and destinations, which might enhance destination loyalty (Chen et al., 2020). In this respect, online social networks and social media play an important role as they provide a more convenient context for users to interact and generate content and help them spread positive word of mouth, which can significantly impact destination image (Marine-Roig, 2021).
Schreiner et al. (2019) state that the engagement rate is a sound performance indicator. The literature generally stresses that engagement can be conceptualised as cognitive, affective, and behavioural, similar to TDI dimensions (Harrigan et al., 2018). It includes interacting with social media, namely liking and commenting on posts (Aramendia-Muneta et al., 2020; Yu & Sun, 2019). Swani et al. (2017) also consider follower numbers, which, together, refer to the popularity of a post.
Tourist engagement can provide insights into public perceptions and expectations as well as those of potential future customers. However, this information must be paired with sentiment analysis of the generated comments (Singgalen, 2024) to fully comprehend digital content's role in TDI.
2.3. Sentiment Analysis
Sentiment analysis can be a relevant approach to understanding destination image from tourists' perspective (Bui et al., 2022; Jiang et al., 2021), especially after the visit (González-Rodríguez et al., 2016). It is also a helpful method for identifying relevant dimensions and attributes of the destination and comparing their relative importance over time (Ren & Hong, 2017). In this vein, a cross-sectional approach before, during, and after the COVID-19 pandemic was considered insightful for understanding the dynamic image of the destination as portrayed by tourists (Nadeau et al., 2022). Understanding tourists' satisfiers and dissatisfiers, measuring destination performance and characterising the customers' behaviour and experiences (Fuchs et al., 2014) are critical aspects; sentiment analysis can be a powerful method to address them (Moro et al., 2019; Xu et al., 2017).
In terms of research on consumers' sentiments expressed in social media in tourism and hospitality contexts, several objectives can be considered: (i) analysing tourist (consumer) behaviour and satisfaction; (ii) segmenting tourists according to their sociodemographic and behavioural characteristics; (iii) analysing the reputation of an activity sector/organisation; (iv) performing sales forecasts; (v) analysing tourist loyalty/retention; (vi) exploring consumption patterns; (vii) providing recommendations for the hotel/tourist destination; and (viii) detecting fake comments (Jain et al., 2021).
Understanding tourists' sentiments can be a strategic weapon for understanding opinions about tourist destinations and can be a differentiating mechanism to define better services and products (Alaei et al., 2019; Oliveira et al., 2022), which satisfy the cognitive, emotional, and perceptual needs of every traveller (Guo & Tang, 2022; Volo, 2017). In this instance, it can boost visitor involvement, promoting greater pleasure and, eventually, loyalty. The responses to various factors that help define the sentiments associated with the experience can be used to measure the "tourist's emotional space" in a tourist experience (Volo, 2017). These factors include the tourist product, services and destination image components (cognitive, affective, and conative).
Finding sentiments in vast amounts of unstructured content (such as user-generated online content) (Yu & Zhang, 2020) can help identify how tourists view vacation spots and, in turn, comprehend the advantages and disadvantages of this place (Toral et al., 2018), as well as assess the destination's image reputation.
3.Methodology
3.1. Research Setting
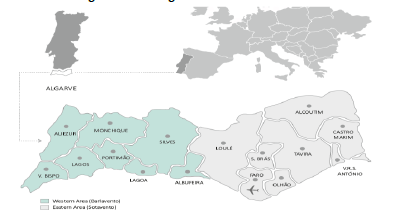
Located in the southwest corner of Europe, the Algarve is the southernmost region of Portugal, and it is seen as an attractive tourism destination, especially during summertime (ATA, 2021). With a privileged geographical location and intense sun exposure, the Algarve is the leading tourism destination in Portugal and one of the most internationally recognised, with visitors arriving worldwide (INE, 2022), as presented in Figure 1. In 2019, the Algarve registered 20.96 million overnight stays, an increase of 2.5% from the previous year (Turismo de Portugal, 2019). One year later, due to the COVID-19 pandemic, these figures saw a drastic decrease of over 62.0%, a difference of 13 million fewer overnight stays than the previous year (Turismo de Portugal, 2020). In 2022, the occupancy per room in hotels in the Algarve was 87.7% in July (4.3% higher than in the same month of 2019) (Association of Hotels and Tourist Enterprises of the Algarve, AHETA). The region was again awarded the "Best Beach Destination in Europe" in 2021 (World Travel Awards, 2022).
3.2. Study Objective
This study aims to measure the ODI portrayed by UGC on social media, considering the tri-dimensional nature of TDI and its impact on tourists' engagement. Specifically, it is intended to identify which categories evoke a higher positive feeling and if they coincide with the highest level of involvement for each dimension.
3.3. Research Model for Measuring ODI and Engagement
Based on the literature review on destination image and tourist engagement, the conceptual framework presented in Figure 2 is designed to achieve the study objective. The image of the destination, analysed in its tri-dimensional structure, finds a parallel in the tri-dimensional structure of engagement. Thus, it contributes to measuring the effectiveness of the content generated and shared by tourists on social networks.
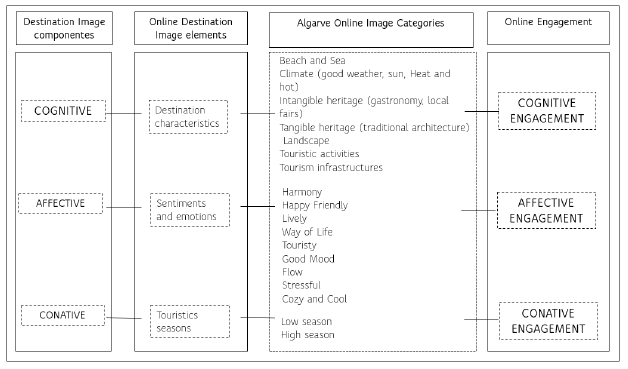
The three primary components of destination image - cognitive, affective, and conative - as proposed in the theory by Gartner (1993) are considered in the research framework as depicted in Figure 2. These components are defined by the elements of destination characteristics, feelings and emotions, and tourist seasons, each of which was used to correspond to each one of the three components (Gartner, 1993) in ODI. According to Stepchenkova and Morrison's (2008) work, the following categories were taken into consideration to characterise the Algarve destination: "Beach and Sea," "Climate (good weather, sun, heat and hot)," "Intangible heritage (gastronomy, local fairs)," "Tangible heritage (traditional architecture)," "Landscape," "Touristic activities," and "Tourism infrastructures." The categories "Harmony", "Happy", "Friendly", "Lively", "Touristy", "Good", "Mood", "Flow", "Stressful", "Cozy" and "Cool" are based on the aspects related to moods and emotions. Lastly, there are two classifications for tourist seasons: "Low Season" and "High Season." Online engagement was conceptualised as being composed of cognitive, affective, and behavioural dimensions (Harrigan et al., 2018).
As Izzo and Picone (2022) mentioned, there is still no formal methodological approach using digital technologies, such as artificial intelligence-based tools, that can enhance sentiment analysis in tourism research and marketing. Therefore, the methodology proposed by El-Masri et al. (2017) was used in the present investigation. A five-step process was systematically employed to analyse data, including data collection, preprocessing, feature extraction, sentiment analysis algorithm, and results evaluation (El-Masri et al., 2017).
3.4. Data Collection
The UGC about the Algarve was extracted from the official website of the Algarve Region, designated by "Visit Algarve" (https://www.visitalgarve.pt/). Its profile on Facebook has 228,962 followers, and, on Instagram, 112k followers. Data were collected between January 1, 2018, and December 31, 2022, using the Fanpage Karma tool (2022). A total of 3,366 comments were collected.
3.5. Data Preprocessing
Data cleaning and transformation tasks were performed; comments not written in English were translated into this language. The conceptual framework (Figure 2) informed the identification of a matrix of elements, and the period to which each comment belonged was coded: high season (from July 1 to September 15) and low season (rest of the year). Also, comments shared before (up to February 29, 2020), during (March 1, 2020, to June 30, 2021) and after (after July 1, 2021) COVID-19 pandemic were identified and coded, links were removed, and content was converted to lowercase.
3.6. Feature Extraction
At this stage, features that allow structuring and exploring the ODI considering its cognitive, affective and conative components were identified: Beach and Sea, Climate, Intangible Heritage, Landscape, Tangible Heritage, Tourism Infrastructure, Tourist Activities, Atmosphere Attributes, Touristic Seasons (high and low seasons), in line with the framework proposed in Figure 2.
Features allow structuring and exploring ODI considering its cognitive, affective and conative components. According to Stepchenkova and Morrison (2008), the cognitive and atmospheric dimensions correspond to the destination image's cognitive and affective dimensions. The following are cognitive categories used to describe the Algarve as a tourism destination on social media networks: Beach and Sea, Climate, Intangible Heritage, Landscape, Tangible Heritage, Tourism Infrastructure, Tourist Activities, and tourist seasons (high and low seasons). The affective dimension is characterised by the atmospheric category, which includes the following attributes: harmony, happiness, friendly, lively, way of life, touristy, good mood, authentic, smell, vision, flow, stressful, cosy, cool.
3.7. Sentiment Analysis Algorithm Application
Text classification, text clustering, topic extraction, and sentiment analysis are examples of common text mining techniques (Srivastava & Sahami, 2009). Sentiment analysis examines users' perceptions of goods and services by identifying their moods, opinions, and feelings. Machine learning and lexicon-based semantic orientation are the two approaches most frequently utilised in sentiment analysis (Ren & Hong, 2017). The primary goal is categorising the positive, negative, and neutral sentiments extracted from the texts.
For the purpose of this study, the machine learning approach was taken into consideration in order to determine the sentiment's polarity. Additionally, the level (ABSA, or aspect-based sentiment analysis) was considered. This level allows for the precise identification of user preferences, which is not possible at the other two levels (document or sentence) (Chang et al., 2022; Yadav & Roychoudhury, 2019)
In this step, Hutto and Gilbert's (2014) VADER algorithm (Valence Aware Dictionary and Sentiment Reasoner) was applied to overcome the problem of performing textual analysis on high volumes of text from social networks to detect the sentiment expressed. This method was selected as it demonstrates a higher precision, leading to results closer to veracity (Gonçalves et al., 2015; Lundqvist et al.., 2020).
4.Results
Regarding the sample profile, 3,366 reviews were collected from Facebook and Instagram social media, with 1,955 and 1,411 posts, respectively (Table 1). Compared with Facebook, Instagram is the social media network that generates the highest number of likes and comments for fewer posts. However, on Facebook, tourists express the most heightened positive feelings towards the destination.
Table 1 UGC Sample Characterization
| Social Media | Global | |||||
| Visit Algarve | Average | Total | Average | Total | Average | Total |
| Number of Likes | 181.92 | 355,657 | 1,530,84 | 2,160,010 | 747.38 | 2,515,667 |
| Number of Comments | 20.02 | 39,139 | 30.27 | 42,716 | 24.32 | 81,855 |
| Number of Posts | N/A | 1,955 | N/A | 1,411 | N/A | 3,366 |
| Engagement | 0.19% | N/A | 2.30% | N/A | 1.07% | N/A |
| Positive sentiment component | 0.18 | N/A | 0.14 | N/A | 0.17 | N/A |
| Negative sentiment component | 0.01 | N/A | 0.01 | N/A | 0.01 | N/A |
| Neutral sentiment component | 0.80 | N/A | 0.85 | N/A | 0.82 | N/A |
| Sentiment (-1 a +1) | 0.59 | N/A | 0.53 | N/A | 0.56 | N/A |
| Sentiment Normalized | 3.97 | N/A | 3.82 | N/A | 3.91 | N/A |
Source: Own elaboration.
Table 1 presents the study's sample characteristics. Notably, Instagram has 85.9% more likes on its social network than Facebook, which has 14.1%. Regarding comments, Facebook comes in quite close (47.8%), behind Instagram (52.2%). However, although Instagram has more comments than Facebook, Facebook has more posts (58.1%) than Instagram (41.9%).
Based on the engagement values of each network, we can conclude that even though Facebook has more posts, Instagram is the social network that encourages greater interaction. Engagement values were obtained directly from social media platforms, whose values were calculated according to the formulas of each platform, meaning calculation formulas were not included. On a scale from -1 to +1, the sentiments acquired are as follows: on Facebook, positive feelings are valued higher, negative feelings are valued the same, and neutral feelings are valued higher on Instagram.
Drawing on the framework presented in Figure 2, the categories and related variables used to analyse the UGC are presented in Table 2. In addition to the textual categories and variables, the number of comments in each category is identified. Data were also analysed, considering the time before, during, and after the COVID-19 pandemic and the main tourist season - summertime.
Table 2 Categories and Variables of ODI for analysing the extracted contents
| Category | Variables | Comments number |
| Beach and Sea | beach, sea, Costa Vicentina, São Rafael, Island | 1,395 |
| Climate | good weather, climate, sunny, great temperature, weather, warm weather, sun, heat, hot | 1,030 |
| Intangible Heritage | gastronomy, seafood, flavour, cuisine, wine, entertainment, medieval, water park, golf, fair, festival, cultural | 614 |
| Landscape | Benagil, sunset, picturesque, cave, cliff, coastline, hill, garden, orchard, palm trees, stairs, Praia da Falésia, Castelo de Silves, Cabo de São Vicente, Carvoeiro, boardwalk, Algar Seco, Ponta da Piedade, Praia da Bandeira, Miradouro, Ria Formosa, Quinta do Lago, Rocha da Pena, Fóia, Caldas de Monchique, Senhora da Rocha, grotto, Zorreira, arch of triumph, arcos da Marinha, natural park, Monchique, landscape | 884 |
| Tangible Heritage | architecture, street, old town, house, lighthouse, castle, building | 320 |
| Tourism Infrastructure | Hotel, restaurant, Marine, Museum, hostel, accommodation | 135 |
| Tourist Activities | Nautic, bird watching, climbing, surfing, dolphin watching, tour, safari, dining, shopping, biking, canoeing, hiking, horse riding, kayaking, paddling, rafting, snorkelling, swimming, trekking, windsurfing, relaxing | 1,349 |
| Destination Atmospheric | harmony, happy, friendly, lively, way of life, touristy, good mood, authentic, smell, vision, flow, stressful, cosy, cool | 287 |
| Touristic Seasons | High season Low Season | 2,064 1,302 |
| Before COVID-19 During COVID-19 After COVID-19 | Until March 1, 2020 Between March 2, 2020 and July 1, 2021 After July 1, 2021 | 1,582 894 890 |
Source: Own elaboration.
Table 2 displays the number of comments for each category while accounting for the factors evaluated. The category "Beach and Sea" has the greatest value (1,395), followed by "Tourist Activities" (1,349), and "Climate" (1,030). When the algorithm is applied to get the sentiment analysis findings, the given variables will be considered as the aspects that need to be examined.
In Figure 3, the engagement rate before, during and after the COVID-19 pandemic is presented across the year. Engagement with social media is significantly higher during the low season and decreases when the destination reopening occurs with the alleviation of sanitary measures. The engagement formula for Facebook is defined by the expression that considers the sum of the number of likes, comments, shares, and reactions divided by the number of fans on the page multiplied by 100 to obtain the percentage value. The Instagram formula is obtained by calculating the expression that considers dividing the total number of likes and comments by your follower count, then multiplying by 100 to give you a percentage. The present study's Facebook and Instagram engagement rate was automatically collected from the Algarve's official website.
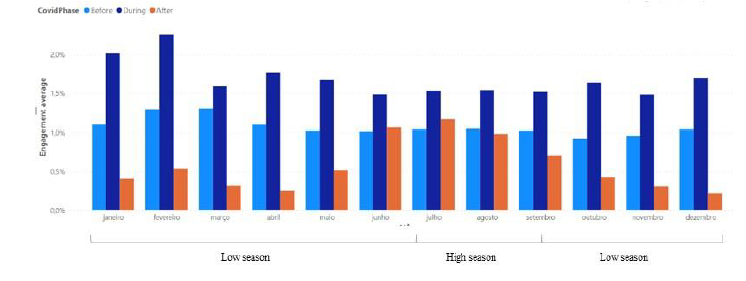
Figure 3 The engagement rate before, during and after the COVID-19 pandemic. Source: Own elaboration.
Figure 3 illustrates that involvement was higher every month throughout the pandemic, with February having the greatest value. Except for June and July, which show greater post-epidemic values compared to the corresponding months before the pandemic, engagement has decreased significantly following the pandemic.
During the COVID-19 pandemic, more content was generated (posts) on Facebook and Instagram, as presented in Figure 4.
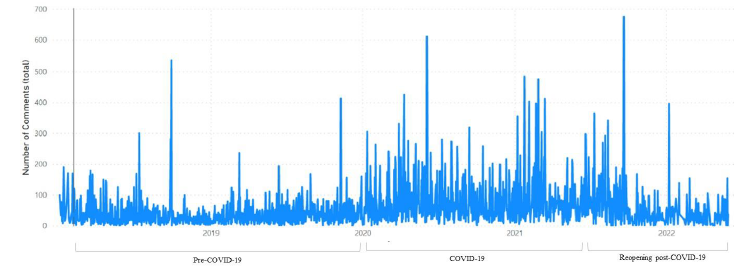
Figure 4 shows a chronological evolution of the number of comments posted on both social media platforms, suggesting the number of comments that emerged during the pandemic, presented in amplitude, did not exhibit as many peaks before the pandemic, indicating a smaller variability. This would imply consistency in visitor behaviour, which did not occur in the post-pandemic period.
The engagement rate increases with tangible heritage and touristic activities when sharing content about the Algarve. Climate, tangible heritage and touristic activities are emotionally more engaging. The destination's most engaging attributes are the beach and sea, tangible heritage and tourist activities (cognitive image). All the categories show high relevance in terms of sentiment. However, landscape and intangible heritage are the most critical elements of the TDI, impacting users' sentiments. Atmosphere attributes (affective image) are important action-driven elements. Table 3 and Figure 5 present these data in detail.
Table 3 Sentiment analysis versus Engagement rate by ODI category
| Sentiment average | Engagement average | |||||
| Category | Cognitive - SA | Affective - SA | Conative - SA | Cognitive - EA | Affective - EA | Conative - EA |
| Beach and Sea | 0,57 | 0,66 | 0,55 | 1,44% | 1,45% | 1,60% |
| Climate | 0,60 | 0,68 | 0,60 | 1,27% | 1,63% | 1,46% |
| Intangible Heritage | 0,60 | 0,75 | 0,62 | 1,40% | 1,53% | 1,41% |
| Landscape | 0,59 | 0,74 | 0,58 | 1,38% | 1,51% | 1,52% |
| Tangible Heritage | 0,55 | 0,62 | 0,52 | 1,41% | 1,93% | 1,71% |
| Tourism Infrastructure | 0,66 | 0,70 | 0,62 | 0,65% | 0,98% | 0,67% |
| Tourist Activities | 0,56 | 0,67 | 0,55 | 1,63% | 1,76% | 1,88% |
| Destination Atmospheric | 0,69 | 0,70 | 0,66 | 1,45% | 1,25% | 1,52% |
| Touristic Seasons | 0,56 | 0,66 | 0,55 | 1,38% | 1,52% | 1,19% |
Legend: SA - Sentiment Average, EA - Engagement Average. Source: Own elaboration.
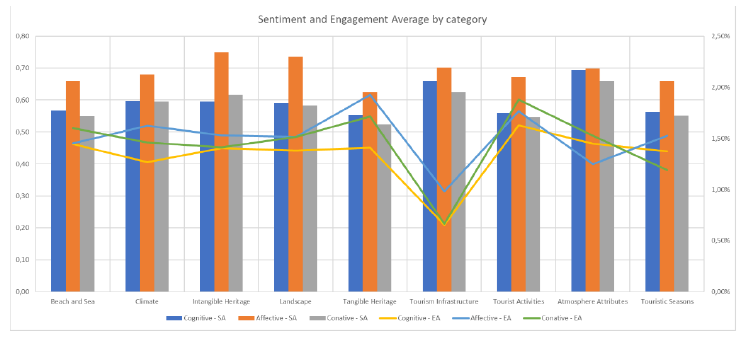
Table 3 shows that atmospheric attributes generate positive feelings with a higher evaluation, mainly regarding the cognitive and conative dimensions, which may include the desire to return to the destination and may enhance online comments and recommendations. The landscape is the most relevant trigger of tourists' feelings towards the destination, followed by Intangible Heritage. The engagement rate is lower in Tourist Infrastructures and higher in Tourist Activities.
Figure 5 graphically represents the content of Table 3, which allows us to highlight what generates a higher feeling and engagement. In the cognitive component, the highest feeling is obtained in the "Destination Atmospheric" category, while in engagement is obtained in "Tourist Activities". For the affective dimension, the highest feeling is obtained in the "Intangible Heritage" category and engagement in "Tangible Heritage". In the conative component, the highest value is obtained in the "Destination Atmospheric" category and in engagement in "Touristic Activities". In Figure 5, it is also possible to identify what generates lower feelings and engagement. In all of the three components, the results are identical, i.e. the lowest sentiment is obtained in the "Tangible Heritage" category and engagement in "Tourism Infrastructure".
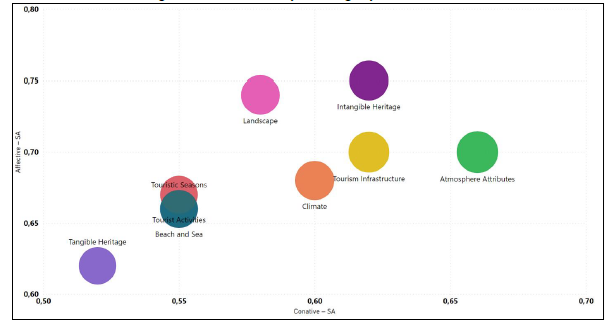
Considering sentiment analysis and ODI dimensions, Figure 6 depicts a positioning map by contracting its conative and affective dimensions. The size of each bubble represents the relevance of the cognitive dimension of the destination image (Table 3). The destination atmospheric attributes (affective dimension of destination image) generate higher positive impacts on the conative size (value one represents the maximum value) throughout intangible heritage and landscape, which are the categories that posit higher feelings toward the destination.
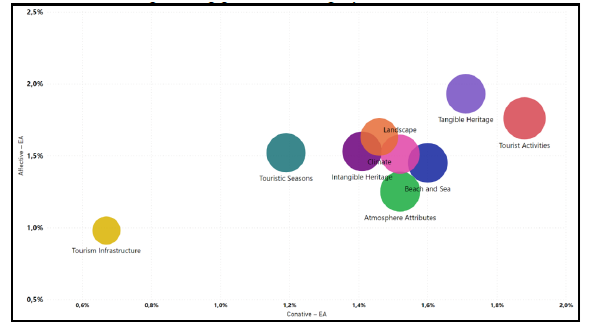
Considering the average engagement rate by the dimensions of ODI, Figure 7 depicts the positioning map considering its conative and affective dimensions. Again, bubble size (values in Table 3) represents the cognitive dimension of the destination image, where activities involving tourists during their stay are the most relevant trigger of the conative image dimension (intentions to recommend or return to the destination). Tangible heritage generates the highest mean value regarding the characterisation of the atmospherics or affective dimension of the destination.
What triggers the tourist's engagement in social media, as shown in Table 4, is the sharing of the tourist experience of Beach and Sea, either on Facebook or Instagram, followed by Climate and Landscape on Facebook and the Intangible Heritage on Instagram. These results are higher, especially before the COVID-19 pandemic. During the lockdown caused by the COVID-19 pandemic, the engagement rate with Instagram decreased compared to Facebook. Tourism activities and Beach and Sea were the contents that generated more reviews on Facebook and Instagram. In the post-pandemic period, Beach and Sea is still the category that has more comments, followed by Climate, on Facebook. The most engaging categories on Instagram are Tourism activities and Beach and Sea.
Table 4 Triggers of tourist engagement in social media
| Total | |||||||
| Online Reviews Numbers | Before | During | After | Before | During | After | |
| Likes | 208 455 | 29 086 | 118 116 | 750 808 | 398 835 | 1 010 367 | 2515667 |
| Comments | 17639 | 3894 | 17606 | 12314 | 10943 | 19459 | 81855 |
| Posts | 842 | 660 | 453 | 740 | 234 | 437 | 3366 |
| About Beach and Sea | 238 | 267 | 146 | 354 | 125 | 265 | 1395 |
| About Climate | 165 | 259 | 79 | 316 | 78 | 133 | 1030 |
| About Intangible Heritage | 64 | 50 | 33 | 434 | 14 | 19 | 614 |
| About Tangible Heritage | 41 | 78 | 26 | 86 | 29 | 60 | 320 |
| About Landscape | 160 | 179 | 68 | 290 | 68 | 119 | 884 |
| About Tourism activities | 110 | 325 | 46 | 221 | 219 | 428 | 1349 |
Source: Own elaboration.
In Table 4, it can also be seen that interaction is higher through Likes, followed by comments shared on the platforms. The number of Likes after the COVID-19 pandemic did not exceed the previous period before the pandemic (57%) on Facebook. On Instagram, after the pandemic, Likes increased 35% compared to the last period: from 750,808 to 1010367 likes.
Regarding comments and posts, Facebook's values were similar before and after the pandemic. However, on Instagram, they increased by 58% compared to the pre-COVID-19 period: 12314 to 19459. Posts on both platforms were significantly reduced to half compared to the situation before the pandemic. This can be explained by the decrease in the number of travellers visiting tourist destinations due to the safety and health restrictions implemented by government entities.
5.Discussion
Broadly inspired by Bui et al. (2022), the approach followed in this research adds to the literature since it includes the engagement rate to access the efficacy of content related to each destination image component through sentiment analysis, the latter being an increasingly relevant data mining method. Although it is no possible to characterise the sociodemographic profile of individuals sharing content on social networks, its analysis allows for obtaining relevant information with theoretical and practical implications (Jiang et al., 2021; Que et al., 2021).
This study contributes to advancing knowledge regarding consumer behaviour and destination image based on organic content shared on social networks from a cross-sectional perspective by integrating content generated before, during and after the COVID-19 pandemic (Qu et al., 2022). In the context of a mature tourist destination of sun and sea located in the Mediterranean area, the activities in which tourists engage during their stay foster greater engagement in the social networks associated with the destination management organization, namely Instagram and Facebook. In addition, tangible heritage should not be neglected, as experiences in this context trigger the feelings and emotions of visitors more noticeably. Regarding recommending a visit or demonstrating intentions to return (conative dimension of the image), comments about tourists' experiences associated with intangible heritage and attributes that characterise the atmospherics of the destination are highlighted.
Insights provide relevant managerial implications like monitoring real-time destination image, visitors' sentiment and destination performance (Bui et al., 2022). Apart from comparing the region's performance with competitors, it can also inform decision-makers about the content they should use at different times and consider specific objectives like managing TDI's cognitive or affective dimension.
The content generated online by tourists informs the design of attractive tourism experiences, services and products. Also, it supports the process of predicting tourists' revisit intentions based on their emotional involvement and engagement (Lalicic et al., 2021; Qu et al., 2022). The affective component shows a significantly lower number of comments, which aligns with the conclusions presented by Nayak et al. (2023).
6. Conclusions
Using data extracted from official Facebook and Instagram pages, this research aimed to measure ODI as portrayed by the user-generated content on social media, considering the complex, multidimensional (cognitive, affective, conative), and dynamic nature of TDI and its impact on tourists' engagement by using a sentiment analysis method. This study provides a framework and comprehensive insights into the individual TDI components as a social construction in the online space and its relationship with online engagement.
Considering the word frequency (cognitive image), atmospherics (affective image), and time (conative image) as measures of ODI (Bui et al., 2022) portrayed by tourists on Facebook and Instagram, findings revealed the affective, cognitive and conative components of ODI. The seasonal analysis captured the dynamics of ODI. These results are aligned with previous ones on the topic (e.g. Baloglu & Brinberg, 1997; Bui et al., 2022; Zhang et al., 2019). Also, the inclusion of sentiment analysis clarified the role of the affective dimension of TDI as depicted in the social media sphere. It also clarified the most relevant attributes of the Algarve as a tourism destination. Also, the seasonal analysis showed that the high season generates more activity in terms of tourist content on social media. These findings align with other studies' outcomes (Bui et al., 2022). The results showed that the COVID-19 pandemic impacted the tourists' relationship with the destination's official Facebook and Instagram accounts, especially before and during this event. Findings also disclosed that content about tangible heritage generates greater engagement in the affective component of ODI.
Regardless of the relevant insights from this study, it is not free of limitations. The data analysed is limited to textual content shared by tourists on Facebook and Instagram about their experiences in a mature seaside destination in the Mediterranean area. In line with He et al. (2022), further studies should include visual content to be more exhaustive in understanding ODI. Only data from Instagram and Facebook were analysed.
One of the limitations of the present study, as stressed by Jiang et al. (2020), is that online reviews do not include user demographics, which does not allow for identifying perceptions associated with tourist segments. Triangulation with data gathered from other data collection methods is recommended to expand findings. Future studies should include other social media networks (e.g. TikTok, TripAdvisor) and compare projected and perceived destination image by defining new metrics, taking into consideration each dimension of the ODI.

