




 Inglês (pdf)
 Artigo em XML
 Referências do artigo
 Tradução automática
 Enviar este artigo por email
 Citado por SciELO
  Similares em
SciELO
Similares em
SciELO 
 Permalink

1. Introduction
In the European Union (E.U.), nearly 200,000 companies face insolvency annually, and only half of entrepreneurs operate for more than five years (Eurostat, 2024). This problem of business insolvency significantly impacts the destruction of employment and the gross domestic product of the E.U. (Korecko, Mokrisova & Horvathova, 2023) and is the subject of attention of jurists, academics and professionals who seek solutions that support the continuity of business (Navarro-Galera et al., 2024). In this context, legislative initiatives to improve E.U. insolvency law have been constant (Didea & Ilie, 2021). UE Directive 2019/1023 has represented the first important step in ensuring that entrepreneurs and companies in financial difficulties can seek help as soon as possible to achieve their continuity. Thus, and where insolvency is possible, the Directive proposes that Member States provide debtors with access to a preventive and flexible restructuring framework that allows them to restructure their companies to avoid insolvency. This preventive legal framework should provide effective restructuring for viable companies in financial difficulties and improve related procedures efficiency (Fannon et al., 2022). To this end, the different Member States are adopting restructuring mechanisms for debtors in financial difficulties. Among them, early warning tools stand out, with which companies can detect risk situations, urging affected companies to correct the problem situation before insolvency is imminent.
Some Member States have already implemented specific early warning systems. However, although these systems are helping to reduce the rates of insolvency and bankruptcy cases, they still need improvement, especially in predictive capacity. For example, the Danish system, which has proven to be more exportable to other countries, is based on Machine Learning methods that obtain a global reliability of 90% when classifying the financial health of companies. Specifically, it can correctly identify 95% of companies in good condition but only 72% in economic problems. These results were worse in the pilot experiment of implementing the Danish system in other countries, carried out by Early Warning Europe (Moller & Mukherjee, 2019). Therefore, new research seems necessary to improve existing early warning models, especially to identify with high precision companies that may present insolvency situations shortly. In this sense, previous literature demands early warning tools that allow more robust verification of the state of exposure to the risk of financial difficulties and insolvency of companies in the European context (Casciello, 2021).
The present study advances the understanding of early warning systems for insolvency by developing models with high predictive capacity tailored to the European context. The core focus of this research is to address the limitations of existing systems, particularly their inadequate predictive accuracy and inability to identify companies at risk of financial distress with sufficient lead time. Despite various Member States having implemented early warning mechanisms, these systems still fall short, especially when forecasting insolvency risk over extended periods. To fill this gap, we seek to answer the central research question: How can we develop more accurate early warning models that provide reliable predictions of financial distress across European companies?
To tackle this question, we employed a dataset of 8,400 companies from Germany, France, Italy, and Spain, covering the period from 2017 to 2022. We applied advanced computational techniques that have demonstrated success in prior studies (Albawi et al., 2017; Qin, Yu, & Zhao, 2018), using methods that are well-suited for analyzing complex economic and financial time series (Alaminos et al., 2022). Our models achieved prediction accuracy exceeding 98%, offering insolvency warnings up to three years in advance. These findings have significant implications for regulators, professionals, and academics, who can leverage these results to improve the robustness, precision, and overall efficiency of early warning systems across Europe.
This study is structured as follows: Section 2 analyses the early warning systems implemented in Europe and reviews previous literature on insolvency prediction models. Section 3 establishes the methodology used. Section 4 provides details of the data and variables used in the study. Finally, section 5 analyses the results obtained. The article concludes by exposing the conclusions of the research and its implications.
2. Background
2.1. Early warning tools in Europe
All Member States of the EU have been implementing the early warning mechanisms proposed by Directive 2019/1023, although this implementation process still needs to be fully developed in certain countries. Denmark, Spain, France, Greece, Italy, and Romania are the countries that have the most experience and levels of implementation.
In Denmark, the early warning system has been operational since 2007 and has offered nearly 6,000 companies in difficulty an impartial and confidential assistance system (Moller & Mukherjee, 2019). The system consists of two levels of action. At the first level, an expert from Early Warning Europe, a European association whose members are professionals, agencies of the ministries of European states, and non-profit organisations, intervenes. This expert analysed the company and its finances, tried to find the root of the problem, and quantified its impact on creditors. Then, he directs the company to a second level, which can take two paths depending on his findings. On the one hand, if the expert considers that the situation can be redirected internally, he puts the company in contact with mentors from the same sector who recommend improving management. On the other hand, if the expert believes that the situation requires a debt restructuring, he directs the company to legal advisors who are experts on the subject and help seek an out-of-court agreement with the creditors or even carry out the process through judicial (Menezes, Mocheva & Siva, 2020). In its design, Denmark's early warning system uses computational techniques, specifically Gradient Boosting. This technique detects companies at risk of insolvency based on the data that appears in the companies' annual accounts. It calculates 30 economic and financial ratios, which refer to profitability, debt, operating results, and profit distribution. With this methodology, the system obtains an overall accuracy of 90%, correctly identifying 95% of companies in good condition but only 72% of companies in problems. Subsequently, in 2016, this Danish system was tested in other European countries such as Spain, Greece, Italy, and Poland through the European Commission's COSME pilot project. In this case, the model predictive capacity showed an accuracy of 86%, detecting 68% of companies at risk of insolvency.
For its part, Spain currently has an early warning system promoted by the registrars (Registrars of Spain, 2024). This system seeks to offer a tool that generates an indicator of the early probability of insolvency, accessible to each debtor required to present annual accounts. For its development, information from a sample of 650,000 commercial companies was used, including data on insolvencies, access to the particular microenterprises’ procedure, annual accounts, and qualitative data collected by the Information Systems Service of the College of Registrars of Spain. With this information, a set of economic and financial variables was constructed that covers the company size, asset structure, indebtedness, operating expenses, liquidity, generated resources, required liabilities, results, financial costs, and taxes on profits. To create the early warning indicator, a Logistic Regression model is used that produces a score from 0 to 100, indicating the degree of similarity of the debtor with companies in an insolvency state. These scores are grouped into four risk states: low (similarity below 25%), medium-low (25% to 50%), medium-high (50% to 75%) and high (greater than 75%). Additionally, the model calculates coefficients for each variable, applying them to the observed values of each company to produce its individualized early warning indicator. The model has a high classification capacity for both non-solvent and solvent companies, with a sensitivity of 91.02% (percentage of non-solvent companies correctly classified) and a specificity of 91.00% (percentage of solvent companies correctly classified).
France has promoted a preventive restructuring model for decades, accompanied by an early warning system to help companies in financial difficulties. This system has been regulated since March 1, 1984, and is called “Alert Procedure”. It can be internal (triggered by auditors or the workers' representative body) or external (initiated by the Commercial Court or the prosecutor). If a probability of insolvency is identified, entrepreneurs are informed and given recommendations on the necessary measures to adopt, as well as the professionals who can advise them (Jacquemont, Mastrullo & Vabres, 2017). Similarly, to what happens in Italy, auditors are responsible for alerting those responsible for the company if they detect any danger symptoms. If they do not take the appropriate measures, they must also alert the Commercial Courts (Martínez, Brun & Lunetti, 2021). When a Court receives information about a company's risk of non-payment, it can corroborate the situation by collecting information from employees, banks, and public institutions (Balp, 2019). If it concludes that the company is insolvent, the Court itself can initiate the bankruptcy procedure, without having to wait for the request from the debtor. On the contrary, if the company only shows symptoms of risk but is not yet insolvent, the businessman is urged to request a conciliation process managed by an insolvency administrator outside the courts. Furthermore, the French system has the particularity that it implements financial incentives to push companies to proactively detect their risk situation and seek solutions before bankruptcy. For example, it is common for regional institutions to provide financial support while searching for pre-bankruptcy solutions (Martínez, Brun & Lunetti, 2021).
In Germany, Dell (2023) critically analyzes the existing early warning systems (EWS) for German small and medium-sized enterprises (SMEs) in the food production sector. He highlights that while Germany has made strides in implementing EWS to detect financial distress early, these systems are still inadequate for addressing the specific challenges faced by SMEs in this sector. Dell emphasizes that current models often lack the precision needed to accurately predict crises, leaving businesses vulnerable. His research suggests the need for a more tailored, comprehensive EWS that considers the unique operational and financial dynamics of food production SMEs, ensuring timely interventions and reducing the risk of insolvency.
In Greece, early warning mechanisms are free of charge for companies in financial distress, and a professional is assigned to analyze the current state of the company and suggest appropriate measures to take. In addition, the professional will supervise the implementation of the proposed measures and assist the debtor throughout the process.
In the case of Italy, the bankruptcy legislation, called “Codice della crisi d'impresa e della insolvenza”, has introduced 2019 an early warning system based on internal business indicators and is structured into three levels of verification (Casciello, 2021). The first level checks whether the company meets its payment commitments and that the net worth is above the legal minimum. The second level verifies the “Debt Service Coverage Ratio”, which measures whether the company's net operating income is sufficient to pay debt maturities in six months. In addition, it uses a third level of verification made up of five indices, which refer to the sustainability of financial expenses with the net result, indebtedness, cash flow concerning assets, liquidity, and debt with public institutions. While the first two levels of verification are considered symptoms of an apparent crisis, this third level is only an indicator of a probable crisis (Caicoya, Lloret & Lorente, 2020).
Also, as part of the transposition of Directive 2019/1023, the Romanian legal system has incorporated early warning tools, regulated in articles 51-56 of Law 85/2014 (Costea, 2022). These tools include alert mechanisms activated when the debtor does not make certain types of payments. It also helps through public or private organizations.
2.2. Previous studies on insolvency prediction
Insolvency prediction has been a critical topic in economic and financial literature in recent decades (Laitinen, Camacho-Miñano & Muñoz-Izquierdo, 2023; Barboza, Kimura and Altman, 2017). As a pioneer in bankruptcy prediction research, Beaver (1966) uses Univariate Analysis and 14 financial variables to predict the probability of a corporate financial crisis. For his part, Altman (1968) applied Multiple Discriminant Analysis and five financial ratios to establish the Z score as an early warning indicator for business bankruptcy. Ohlson (1980) uses the Logistic Regression model and nine financial variables to predict corporate bankruptcy using U.S. companies´ data from 1970 to 1976. Subsequently, new statistical models and variables have been introduced to predict corporate bankruptcy. Campbell, Hilscher and Szilagyi (2008) investigated corporate bankruptcy using a multiple logistic regression model in different periods. Dakovic, Czado and Berg (2010) introduce unobserved heterogeneity between some industries and demonstrate that their models outperform those based on Altman's (1968) conventional variables. Figlewski, Frydman and Liang (2012) use reduced-form Cox intensity models to test the impacts of general economic conditions on insolvency risk. Kukuk and Rönnberg (2013) suggest using Mixed Logistic Regression to forecast corporate bankruptcies. Tian, Yu and Guo (2015) use the Least Absolute Shrinkage and Selection Operator (LASSO) as a variable selection technique and argue that variables selected by LASSO improve forecast performance. Jessen and Lando (2015) diagnose bankruptcy risk using a volatility-adjusted distance-to-default measure. Traczynski (2017) uses the Bayesian Model average and claims that its forecasts outperform those of the individual models.
Insolvency prediction studies have also introduced machine learning techniques to increase the accuracy of the models. In the 1990s, they focused on Artificial Neural Network (ANN) techniques. Odom and Sharda (1990) and Wilson and Sharda (1994) use the ANN for bankruptcy prediction and compare its performance with Discriminant Analysis. They show that it performs better than Discriminant Analysis. Falavigna (2012) applies ANN to predict the insolvency risk of small Italian companies. Barboza, Kimura and Altman (2017) compare ANN models such as Radial Basis Function, Support Vector Machine, Boosting, and Bagging. Their results are 10% more accurate than traditional statistical models. Additionally, researchers have used other more modern variants such as Hybrid Associative Memory (Cleofas-Sánchez, García & Marqués, 2016), Genetic Algorithms (Lin, Liang, Yeh and Huang, 2014), Random Forest and AdaBoost (Kim & Upneja, 2014). Recently, Kim, Cho and Ryu (2020) systematically reviewed machine learning methodologies for predicting corporate bankruptcies and also recognized its higher accuracy compared to statistical techniques.
On the other hand, previous studies on insolvency prediction have sought to increase the precision of the models by considering new explanatory variables. For example, Brezigar-Masten and Masten (2012) carried out a selection process of predictor variables of insolvency based on Random Forest and Non-Parametric Regression. To do this, they used a sample of Slovenian companies and achieved an accuracy range between 62.8% and 95.0%. Tinoco and Wilson (2013) managed to predict bankruptcy using market and macroeconomic financial ratios by applying Logistic Regression and ANN to a sample of non-financial companies in the United Kingdom. In their study, they detected that macroeconomic variables present some reliability problems. Using ANN, the Cox model, and Logistic Regression, Du Jardin (2018) correctly predicted 81.2% of bankruptcy cases with a sample of French companies. Cultrera and Brédart (2015) also developed a Logistic Regression model with Belgian companies, including control variables such as size and age. The results showed that profitability and liquidity ratios increase the accuracy of insolvency prediction. Liang et al. (2016) use the five variables of Altman's (1968) model and add corporate governance variables. Oz and Yelkenci (2017) address the theoretical level of financial difficulties, focusing on the most significant variables mentioned in the literature (solvency, profitability, and liquidity). Recently, Mai et al. (2019) and Sun (2020) introduced stock market information variables to explore whether the prediction performance has a significant improvement.
Another characteristic of the insolvency prediction model is its geographic focus on a single country or region. In this sense, models for the USA (Sayari & Mugan, 2017), Europe (Fernández et al., 2020; Callejón et al., 2013), China (Liu & Wu., 2017), and the United Kingdom (Tinoco & Wilson, 2013). Some research has also included groups of countries, such as Tsai (2009) with companies from Australia, Germany, and Japan; Chen et al. (2011) with Polish and Australian companies; and Zhou (2013) with American and Japanese companies. Other studies have specifically addressed the European case. Thus, Laitinen and Suvas (2013) analysed financial difficulties in different European countries to compare the accuracy of their model predictions between countries. The objective was to discover the feasibility of developing a uniform generic model to predict financial difficulties in each European country using financial variables. Callejón et al. (2013) developed a bankruptcy prediction model for European industrial companies based on Multilayer Perceptron. The proposed model correctly predicted 92.5% and 92.1% of the training and test samples, respectively, using financial information from two years before the bankruptcy. Their conclusions suggest that European industrial companies that are less capitalized, do not generate enough resources to meet their short-term financial debt, have low profitability, and are small in size, are the most likely to suffer bankruptcy. Barboza, Kimura and Altman (2017) conducted a review of the Z model based on companies from 31 countries, most of which were European. They achieved an accuracy range of 70-80%. Recently, Fernández et al. (2020) improved the understanding of the impact of context variables on the risk of financial distress of European companies. Using a Multilevel Logistic Regression model, they showed that country effects vary randomly but there is significant variation in the level of financial difficulties within and between countries.
The study by Beltrame et al. (2023) explores the new alert system proposed by the Italian NCCAAE, focusing on improving the predictive power of financial distress models. Their research highlights the system’s ability to provide earlier and more accurate warnings of financial instability in Italian businesses, helping regulators and companies take preventive measures. Islam et al. (2024) conduct a comparative analysis of various machine learning models for bankruptcy risk prediction. They demonstrate that cognitive modeling can significantly enhance bankruptcy prediction, showcasing the superior accuracy of machine learning methods. Navarro-Galera et al. (2024) focus on identifying early warning indicators of insolvency in small and medium-sized enterprises (SMEs). Their empirical research provides valuable insights into specific financial variables that signal impending insolvency, offering crucial tools for improving financial stability in SMEs. Together, these studies highlight the importance of advanced models and early warning indicators in preventing financial distress across different business contexts.
Recent advancements in financial distress prediction models highlight the growing relevance of deep learning and multidimensional approaches. Elhoseny et al. (2022) propose a deep learning-based model to predict financial distress, demonstrating high predictive accuracy through advanced computational techniques. Their work emphasizes the importance of leveraging deep learning to enhance prediction outcomes. Similarly, Altman et al. (2017) review the well-known Z-score model for financial distress prediction in an international context. Their empirical analysis confirms the model’s utility across various global markets while suggesting refinements for specific country contexts. Lastly, Abdelkader and Wahba (2024) offer a multidimensional model for predicting financial distress in Egyptian firms, focusing on various financial indicators and macroeconomic factors. Their study shows that combining multiple dimensions can significantly improve the model's predictive power, offering insights into market-specific conditions. Together, these papers underscore the importance of integrating both traditional and modern methods, such as deep learning, into predictive frameworks to enhance financial distress prediction across diverse markets and industries.
3. Methods
As indicated above, we have used different methods to build early warning models for Europe to achieve our objective research. Various methods aim to achieve high-precision models, which are contrasted using a classification technique and applying all those that have demonstrated success in previous literature. Specifically, this study applies the techniques of Convolutional Neural Networks (CNN), Recurrent Neural Networks (RNN), Long Short-Term Memory (LSTM), Convolutional Neural Networks-Long Short-Term Memory (CNN-LSTM) and Gated Recurrent Unit-Convolutional Neural Networks (GRU-CNN), which offer versatile and practical approaches in the context of economic and financial time series analysis. CNN excels at detecting patterns and identifying sudden changes in them. RNN and LSTM capture relationships over time, addressing time dependence in complex economic trends. The CNN-LSTM combination fuses visual features and temporal dependencies in data such as financial image sequences. Similarly, GRU-CNN excels at modeling sequences and spatial features. These techniques provide powerful tools for accurate predictions and identification of economic and financial time series patterns, supporting informed decision-making in dynamic economic environments. Choosing appropriate methods is critical to achieving accurate and timely predictions. Here, CNN can help capture local patterns in the data, such as abrupt price changes or market volatility, which is essential for the early detection of trends. However, since financial time series can also have long-term relationships influenced by internal and external economic factors, including LSTM in a CNN-LSTM architecture can significantly improve accuracy when modelling these more complex time dependencies. Furthermore, combining GRU with CNN in a GRU-CNN approach may also be promising, especially if we wish to maintain a balance between the ability to capture long-term temporal relationships and the ability to extract spatial features from the data. Below is a summary of the methodological aspects of each of these techniques. Also, the variables sensitivity analysis is necessary to determine the level of significance of the variables used in the early warning models (Satelli, 2002).
3.1. Convolutional Neural Network (CNN)
Convolutional neural networks (CNN) are neural networks that have at least one convolutional layer, though they can also incorporate more layers of different types, such as non-linear, compilation, and fully linked layers. Once these layers are linked, a deep convolutional neural network is composed. These neural networks use a recalibration system to carry out the different convolutional processes, thus being able to develop the CNN model. Depending on the task performed, one type of filter or another will be formed. Filters are not managed through CNN but are defined by assets through network formation (Albawi et al., 2017).
The filters confer the coating to get the information. The result of this layer will be related to the set of additions of multiple elements according to the filter and the response. The results overlap as an indissoluble part of the adjacent top layer (Wu, 2017). Convolutional operations are provided by strip grouping, filter space, and zero packing. The strip is equal to the step of the entire path as a solid and positive integer. The filter size will be a constant for all filters that are part of the convolutional operation. To know the outgoing feature map, a zero column and zero rows are applied using zero packaging (Guo et al., 2016). To not limit the number of network convolution layers, zero padding must be defined, ensuring that the input matrix edge data is adjusted. In the case of not doing so, the result of the matrix would be lower. Thanks to this, the reduction of the neural network is avoided and provides infinite depth in the network configuration. The primary function of the use of nonlinearity is to provide adaptation to the output achieved. The rectified linear unit (ReLU) is one of the most used nonlinear features in CNNs for image processing (Guo et al., 2016; Dumoulin and Visin, 2016). The mathematical formulation of the ReLU is expressed in equation 1.
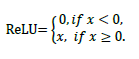 (1)
(1)
The grouping layer reduces the size of the inputs. The maximum grouping provides the highest output value (2 x 2) within the grouping filter, being one of the most used techniques. Although there are other techniques, such as the addition or the average, the maximum grouping is preferred because it reduces the dimension of the input layer by 75% (Ba & Frey, 2013; Szegedy et al., 2015).
The softmax output layer methodology is used to test the category distribution, generating a standardized exponent for the outgoing values. This element exponentially raises the maximum probability of the quantity, being an independent function with probabilistic representation in the output (Alaminos et al., 2020; Alaminos et al., 2022). The softmax function can be defined as equation 2.
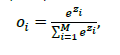 (2)
(2)
The number i of output is expressed in a softmax distribution, while the output i and M are the total of output nodes 𝑜𝑖 and 𝑧𝑖.
3.2. Deep Recurrent Convolutional Neural Network (DRCNN)
Recurrent neural networks (RNN) are widely used in different areas thanks to their great prognostic efficiency. The algorithms previously used will form the output belonging to the RNN network (Wang et al., 2017). The layer could be computed as we see in equations 3 and 4, using an input sequential vector x, different hidden nodes of an s layer, and a shadow layer at the output.
 (3)
(3)
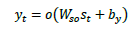 (4)
(4)
The weights obtained from the input layer x and the leftover layer s represented in Wxs, Wss, and Wso are distorted by b, which is part of the shadow layer and the output layer. Equation 5 indicates that σ and o are the activation function.
 (5)
(5)
The oscillation signs are represented by z(t), and ω(t) is the Gaussian window function centered around 0. The function T expresses the vibration signs (τ, ω). To carry out the operations of the hidden layers of the convolutional calculus, the following expressions, 6 and 7, will be performed, where W is the representation of the convolution nucleus.
 (6)
(6)
 (7)
(7)
By stacking a recurrent convolutional neural network (RCNN), we can configure a deep structure called a deep recurrent convolutional neural network (DRCNN). To use the DRCNN model in prediction, a monitored machine learning layer implemented in the last stage of the network must be defined under equation 8 (Huang & Narayanan, 2017).
 (8)
(8)
This model estimates the residuals with the difference between the results obtained and those planned in the training phase, with Wh as the weight and bh as the bias (Ma & Mao, 2019). A stochastic gradient drop will be applied to optimize the captured reference points. The residual function (9) is then set, using the data over time t as r.
 (9)
(9)
3.3. Long short-term memory (LSTM)
The long short-term memory (LSTM) prediction model is an adaptation based on the optimization of time-dependent variables according to the architecture of recurrent neural networks (RNN). The objective of applying of the time series is to forecast the state in question with input data with multiple dependent variables (Hochreiter & Schmidhuber, 1997). The LTSM uses a methodology of three channels of information, the input layer, the output layer, and the forgetting layer, where it manages to retain the information before using a steady state calculation of the gradient, unlike RNN, when using the information in a loop loses the traceability of the dependent variables in the long term, because their learning methodology has lost gradients for backpropagation. The following are the equations (10) of sequential calculation to maintain the state of the cell in the LSTM methodologies (Hochreiter & Schmidhuber, 1997; Vu et al., 2020).
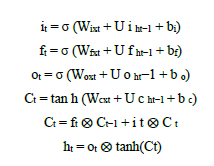 (10)
(10)
where xt represents the input variables at the current time, ht is the output value of the predecessor cell, and Ct-1 is the set of passed data provided by the previous cell. To carry out the adjustments, a sample of the weight matrices and bias vectors is used in logistic sigmoid σ, and tanh functions at the input, and output gates.
The LSTM requires a single hidden layer structure to obtain the best fit and forecast. This hidden layer is composed of several nodes where it contemplates the following normalization: (nin + 1) × n h id + (nhid + 1) × nout ≤ 1/α × ntrain. This expression is represented where nin is the number of nodes in the input layer, nout is the number of nodes in the output layer, and nhid is the number of nodes in the hidden layer. Likewise, ntrain responds to the volume of training data, with a volatile α coefficient of 1 to more than 10. To not generate a degree of overfitting, a value of 2 has been provided to the coefficient α since the total training data doubles in proportion to the degrees of freedom in the training process.
3.4. Convolutional Neural Networks-Long Short-Term Memory (CNN-LSTM)
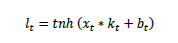
CNN is characteristic of attending to very evident properties within the sight line, therefore, it is extensively applied in engineering. LSTM features the characteristic to expand based on the time sequence, and it makes a large use in the time series. Following the characteristics of CNN and LSTM, a value forecasting model based on CNN-LSTM is constructed (Qin, Yu & Zhao, 2018). CNN is a type of feed-forward neural network that performs well in both image and natural language processing (Kim & Kim, 2019). CNN could successfully be implemented in time-series forecasting. CNN local sensing and distribution of weights may reduce the parameter number to a large extent, thereby increasing the learning efficiency of the model (Qin, Yu & Zhao, 2018). CNN consists of two main parts: the convolution layer and the clustering layer. The convolution layer each holds an assortment of convolution kernels, and its formula of calculation is given in equation (11). Following the convolution operation of the convolution layer, features are removed from the data. However, the dimensions of the separated characteristics become high; therefore, to resolve this issue and decrease the training cost of the network, a clustering layer is inserted directly after the convolution layer to reduce the dimension of the characteristics:
 (11)
(11)
being 𝑙𝑡 the output value after convolution, tnh represents the activation function, 𝑥𝑡 stands for the input vector, 𝑘𝑡 means the weight of the convolution kernel, and 𝑏𝑡symbols the bias of the convolution kernel.
LSTM aims to overcome the long-standing explosion and vanishing gradient problems in Recurrent Neural Networks (RNNs) (Ta, Liu & Tadesse, 2020). It has been employed mainly in speech detection, sentiment analysis, and text processing since it has a unique memory and can make relatively precise predictions (Gupta & Jalal, 2020).
3.5. Gated Recurrent Unit- Convolutional Neural Networks (GRU-CNN)
RNN is an artificial neural network suitable for processing and analysing temporal data sequences, in contrast to classical neural networks, which rely on the weighting connection between the layers (Wu & Yan, 2019). The RNN implements the hidden layers to retain the information of the prior time, and the output is affected by the present states and the memories of the prior time. The structure of the unrolled RNN is presented in equations 12 and 13.
 (12)
(12)
 (13)
(13)
where a^〈t〉 the output of one single hidden layer at time t, ω_aa^〈t〉 , ω_ax^〈t〉 and ω_ay^〈t〉 the hidden layers' weight matrixes, the input weight matrixes, and the output weight matrixes, respectively. b_a and b_y symbolising the bias vectors of one hidden layer and the output, respectively, g_1 and g_2 represent the nonlinear activation function.
The RNN works properly if the output is near its related inputs; moreover, with a long-time interval and a great number of weights, the input shall have little effect on the output owing to the problem of disappearing gradient. To resolve the gradient vanishing problem and the simple structure of the RNN hidden layer, we proposed a particular kind of RNN called GRU (Zhao et al., 2021).
The GRU consists of a variation of the LSTM with a closed RNN structure, and in comparison, to the LSTM, there are two gates (update gate and reset gate) in the GRU and three gates (forget gate, entry gate, and exit gate) in the LSTM (Gao et al., 2019).
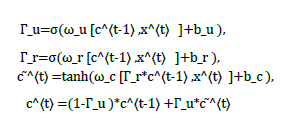
The GRU equations are:
 (14)
(14)
being ω_u, ω_r, and ω_c the training weight matrix of the update gate, the reset gate, and the candidate activation c ̃^〈t〉 , respectively, and b_u, b_r, and b_c represent the bias vectors.
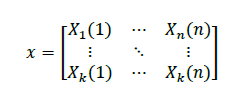
CNN is often employed in a visual image, video recognition, and text categorisation. To keep the spatial information of the data registered by sensors and smart appliances in the power system, the spatio-temporal matrix was suggested (Zhao et al., 2021). Its data are based on the sensors' location and time sequence. The spatio-temporal matrix appears like (15).
 (15)
(15)
where k is the k^th smart sensor, n is the n^th time sequence, and X_k (n) symbols of the data recorded by the k^th smart sensor at n time. For extracting the charging characteristic from the spatio-temporal matrix, CNN was utilised for processing the spatio-temporal matrix.
First, numerous two-dimensional space-time matrices are piled into blocks of three-dimensional matrices, followed by applying these blocks with a convolution operation (Gao et al., 2019). The convolution operation aims to obtain a strongly abstract feature, and then after the convolution operation, the results of the convolution operation are applied to the grouping operation. The pooling operation makes no change to the entry matrix depth, though it may decrease the size of the matrices and the number of nodes so that the parameters in the complete neural networks are reduced. Following the repeated convolution and pooling operations, the highly abstract feature was extracted and smoothed to a one-dimensional vector, hence it can be linked to the whole layer connected. Next, the weights and bias parameters within the globally connected layer can be computed iteratively. Lastly, the forecasting outcomes are provided by the output of the activation function (Zhao et al., 2021).
Our proposed GRU-CNN hybrid neural networks framework comprises a GRU module and a CNN module. Inputs are the time sequence data information and spatio-temporal matrices recorded from the sample; outputs represent forecasting the future value. As for the CNN module, it is suitable for processing two-dimensional data, such as spatio-temporal matrices. CNN module employs local connection and weight sharing to extract local characteristics of the data directly from the spatio-temporal matrices and get an efficient presentation using the convolution layer and the clustering layer. CNN module structure contains two convolution layers and one flattening operation, each containing one convolution operation and one clustering operation. Following the second clustering operation, high-dimensional data is smoothed into one-dimensional data, and the outputs of the CNN module become linked to the connected layer. Moreover, the purpose of the GRU module is to catch the long-term dependency, and the GRU module could gather helpful information in the historical data over a long period via the memory cell, while the useless data will be ignored by the oblivion gate (Zhao et al., 2021). GRU module inputs are the temporal sequence data; the GRU module holds plenty of closed recurrent units, and the outputs of all these closed recurrent units are linked with the connected layer. At last, the forecasting outcomes may be achieved with the average value of all the neurons in the gated layers.
3.6. Sensitivity analysis
Through the models proposed above, it is essential to know the importance and impact of the different input variables. It is critical to optimize the models, and for this, it is necessary to include only those significant variables and not to use those unimportant for the study. For this reason, we will undertake a sensitivity analysis to study the relevance of the independent variables on the dependent variable (Alaminos et al., 2022b; Alaminos et al., 2022c). According to Saltelli (2002), a variable is important when its variance increases concerning another variable. To analyze this, we use the Sobol method, degrading the variance of the total product V(Y) obtained from the equation (16).
 (16)
(16)
by the Sobol decomposition system. The sensitivity analysis proposed by Sobol is essential to know the variable or set of variables that cause the variations of results for the estimated model (Zhang & Qi, 2005).
4. Sample and variables
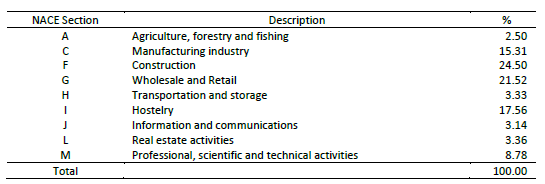
The present study uses a random sample of 8,400 companies that have developed their activity in the European countries with the most significant business population: Germany, France, Italy, and Spain. The data for these companies was obtained from the Orbis database by Bureau van Dijk for 2017-2022. Orbis contains economic and financial information on more than 200 million private companies worldwide. From each of the countries in the sample, 350 solvent companies and another 350 companies in financial difficulties have been selected with information from 1 year before (t-1), two years before (t-2), and three years before the declaration of said insolvency situation (t-3). In this way, we have three balanced sub-samples containing information from 2,800 European companies for each forecast horizon. All sub-samples meet the stratification criteria according to the number of insolvent companies by activity sector. Table 1 offers details of the sectoral distribution of the sample. The activity with the most significant weight is Construction (24.50%), followed by Commerce (21.52%) and Hospitality (17.56%).
Table 1 Industries´ distribution of the sample
NACE: Statistical nomenclature of economic activities of the EU.
Furthermore, to check the predictive capacity of the models, different test samples unrelated to those used in the estimation of the models were used. For this purpose, the data were divided into three mutually exclusive groups: one for training (70% of the data), another for validation (10% of the data), and the third group for testing (20% of the data). The training data is initially used to build the models. For this part, validation data is used to evaluate the methods during training and detect overtraining. Finally, the test data is used to assess the built model. For the treatment of each of the three groups, the cross-validation procedure has been applied ten times with 500 iterations (Alaminos et al. 2018).
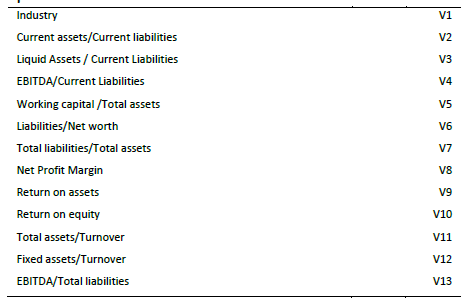
On the other hand, concerning the variables used in the research, we have considered that both early warning systems and previous insolvency prediction studies have used economic and financial variables as independent variables. Consequently, this study uses the 13 financial variables that have shown the most significance in previous literature, covering aspects of profitability, net margin, debt, liquidity, debt repayment capacity, and efficiency (Fernández et al., 2020; Alaminos et al. al., 2016; Bellovary, Giacomino & Akers, 2007; Moller & Mukherjee, 2019). Additionally, a dummy variable is included to identify the industry to which the company belongs. Table 2 shows the independent variables used in the study.
5. Results
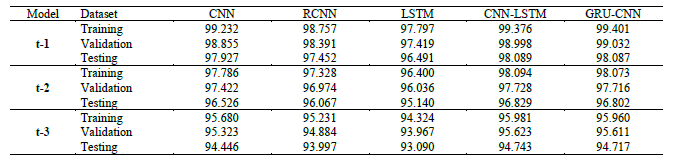
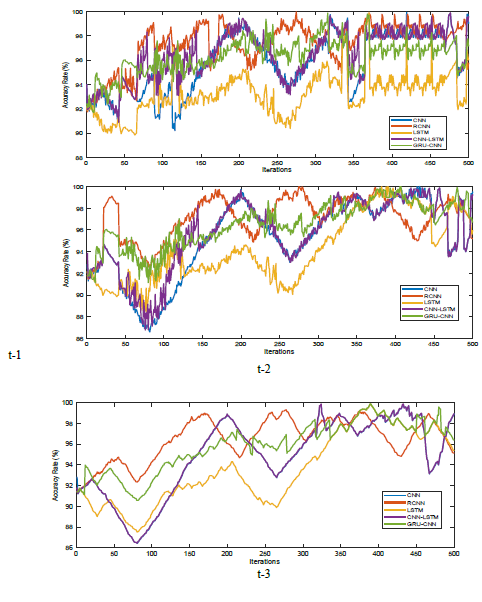
The results of the early warning models constructed are presented below. The percentage of cases correctly classified has been used to evaluate the accuracy of the models. Meanwhile, to assess performance in terms of predictive capacity, sensitivity, specificity, root mean square error (RMSE) and mean absolute percentage error (MAPE) were used. Table 3 and Figure 1 present the precision results of the models used. All models show high prediction capacity. However, it is essential to note that the CNN-LSTM model stands out by obtaining the highest ranking on all training and test data. For example, on the testing for t-1, the CNN-LSTM model achieves a classification accuracy of 98.089%, 96.829% (for t-2), and 94.743% (for t-3). This implies that the predictions of this model largely coincide with the actual values. However, as we move forward towards t-2 and t-3, a general trend of decreasing accuracy is observed across all models. This could be attributed to the greater complexity of historical data and difficulty predicting patterns in events more distant in time.
The precision of the model developed in the present study has also been verified through sensitivity and specificity measures. Sensitivity estimates the system's ability to identify insolvent companies correctly. A high sensitivity would indicate that the system correctly classified most companies as insolvent. However, it does not provide information about companies that remain solvent and that the system has wrongly classified them as insolvent. An overly cautious network that rates most companies as insolvent, whether insolvent or not, shows a high sensitivity value. For its part, specificity represents the system's ability to identify solvent companies correctly. A high specificity indicates that the system correctly classifies most companies that are solvent as solvent.
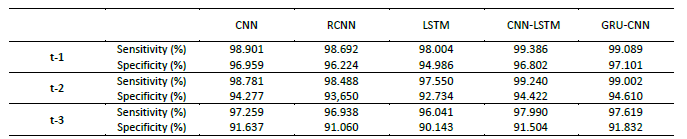
However, as was the case with sensitivity, it needs to provide information on the correct classification of solvent companies and the system needs to correctly classify them as solvents. An overly confident network that marks most companies as solvent, whether they are solvent or not, shows a high specificity value (Callejón et al., 2013). Table 4 presents the results on the sensitivity and specificity of the models. All values are greater than 90%, and the best combination of sensitivity and specificity is also presented by the CNN-LSTM model (99.3% sensitivity and 96.8% specificity for t-1).
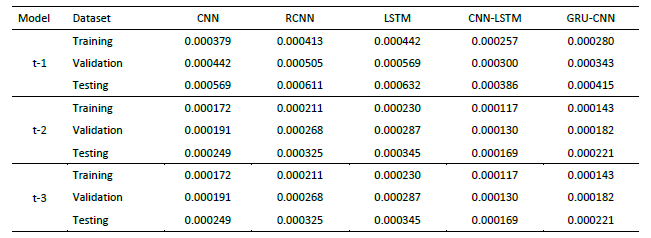
For its part, Table 5 presents a detailed view of how the different models perform in terms of RMSE in various circumstances and time horizons (t-1, t-2, and t-3). RMSE is crucial to understanding the difference between model predictions and actual values in absolute terms. Here again, the CNN-LSTM and GRU-CNN models emerge as the most consistent. At t-1, the RMSE value for CNN-LSTM is 0.000386, which means that, on average, the predictions are off by a minimal amount compared to the actual values. This high precision also extends to the validation and test sets. It is interesting to note how, as we go back in time, the RMSE values tend to increase, indicating that the models are encountering more challenges in predicting older data accurately.
Likewise, the MAPE metric sheds light on the percentage error in the predictions about the actual values. Once again, the CNN-LSTM and GRU-CNN models stand out for their excellent performance. At t-1, CNN-LSTM records a MAPE of 0.000513, indicating that the percentage error in its predictions is deficient compared to the actual values. This pattern of solid performance persists across the validation and test sets. However, as in the other metrics, an increasing trend is observed in MAPE values as we move forward towards older data (Table 6).
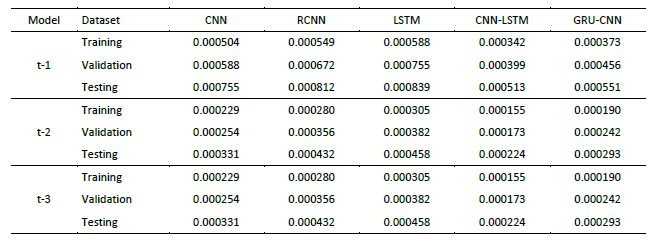
The above results confirm that the LSTM, CNN-LSTM and GRU-CNN models are highly effective for the early warning task, especially at times closer to the present (t-1). These models balance between precision, sensitivity, specificity, and low values of RMSE and MAPE, suggesting an exceptional ability to anticipate future insolvency events with accuracy and consistency.
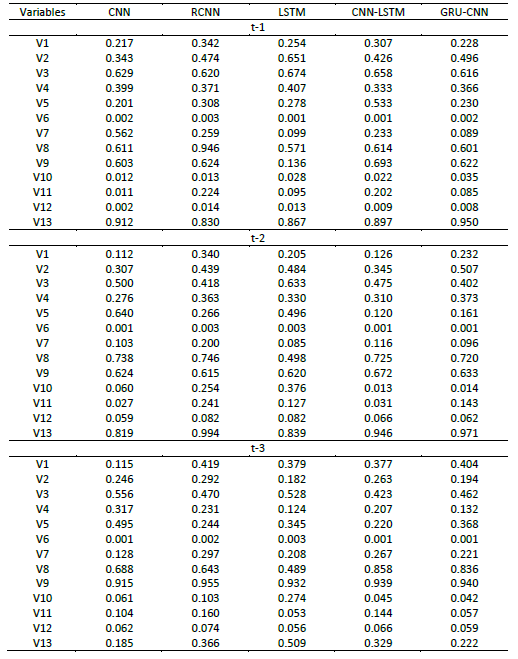
Finally, the results on the importance of the independent variables appear in Table 7. These results indicate that, in the period closest to insolvency (t-1), four variables have shown special significance in practically all the models built (Importance>0.600). These variables refer to liquidity (V3), net margin (V8), profitability on assets (V9), and debt repayment capacity (V13). Further away from the moment of insolvency (t-2), the most significant variables are V8, V9, and V13, a result repeated in all the higher precision models. With great anticipation (t-3), the only variables that have shown significant importance in constructing accurate models have been only two (V8 and V9). These results confirm that the most important warning signs to prevent insolvency are related to obtaining adequate business profitability (V9), including adequate net profit margins (V8). Furthermore, as we approach the moment of insolvency, other complementary signals are relevant. This is the case of the inability to repay the debt with the resources generated by the company (V13) and, finally, the lack of liquidity (V3).
6. Discussion
Using a sample of 8,400 companies from the four largest European countries and data from 2017-2022, our results demonstrate the superior accuracy of the CNN-LSTM model, achieving 98.08% for t-1, 96.82% for t-2, and 94.74% for t-3. This model's combination of sensitivity (99.38%) and specificity (96.80%) surpasses previous systems like the Danish early warning system, which reported lower accuracy, especially for companies in financial distress. These findings align with the growing need for more advanced predictive models, as outlined in the work of Beltrame et al. (2023), who emphasized the limitations of Italy’s existing alert system and advocated for models with enhanced predictive power. Similarly, Islam et al. (2024) demonstrated the superior performance of machine learning techniques, such as cognitive modeling, in predicting bankruptcy across various contexts, reinforcing the idea that modern computational methods can outperform traditional models in financial distress prediction.
Furthermore, Navarro-Galera et al. (2024) explored early warning indicators specific to SMEs, illustrating the importance of identifying key financial variables-such as liquidity and profitability-early on to prevent insolvency. Their findings parallel our results, where variables like net profit margin and debt repayment capacity emerged as critical indicators of financial health. This is consistent with the broader literature, such as the study by Barboza, Kimura, and Altman (2017), which highlights the benefits of integrating machine learning techniques like neural networks into predictive models to improve accuracy, particularly in complex environments such as European financial markets. Additionally, our results echo the findings of Dell (2023), who critiqued the effectiveness of Germany’s early warning systems, particularly for SMEs in the food production sector. His research stressed the need for tailored, sector-specific models, similar to how our study addresses the diverse financial environments in European countries. The high accuracy rates of our CNN-LSTM model, particularly its ability to provide alerts up to three years in advance, underline the importance of using dynamic, non-linear machine learning approaches, as suggested by Abdelkader and Wahba (2024), whose multidimensional model for Egyptian firms similarly leveraged multiple variables to enhance predictive power.
Comparing the accuracy of the CNN-LSTM model developed in the present study with that obtained by previous studies that have addressed the problem of insolvency prediction in European countries, we can also highlight the superiority of our results. Brezigar-Masten and Masten (2012) applied Random Forest and Non-Parametric Regression techniques for Slovenian companies. They achieved an accuracy range between 62.80% and 95.00%. Du Jardin (2018) used ANN, the Cox model, and Logistic Regression. He correctly predicted 81.20% of insolvency cases with a sample of French companies. For their part, Callejón et al. (2013), with Multilayer Perceptron, correctly predicted 92.10% of the insolvency for European industrial companies. Likewise, our precision results have been superior to those obtained by Barboza, Kimura and Altman (2017), which, with a review of the Z model and a sample of companies from European countries, achieved a precision range of 70.00-80.00%. Possibly, the most versatile approach in the context of economic and financial time series analysis offered by the CNN-LSTM model has allowed us to improve these precision results for European companies.
On the other hand, our results confirm that certain variables are the best financial alert indicators in the short term. These variables relate to liquidity, net margin, profitability, and debt repayment capacity. These results coincide with those obtained by the Danish early warning system. And also, by those pointed out by Cultrera and Brédart (2015), confirmed the great significance of profitability as an early warning indicator. Likewise, our results are in line with those indicated by the early warning systems implemented in Spain and Italy regarding the importance of the resources generated to face the repayment of the debt, especially in line with the Spanish early warning system about the significance of liquidity. However, in the short-term alert, our results differ from those indicated by the Italian and Spanish early warning systems, which do not highlight the importance of the net profit margin and which, in our models, has been significant in practically all cases.
In a period further removed from the moment of insolvency (for example, two years in advance), our results highlight the importance of indicators related exclusively to profitability, the capacity to repay the debt with generated resources and the net profit margin. These results partially coincide with those obtained by the Italian alert system and the study by Callejón et al. (2013), who also points out the importance of profitability in this time frame. However, they differ regarding the importance of the net profit margin, which has not been significant in previous literature but is of particular significance in our models. Perhaps using more current sample information, which covers until 2022, has allowed our models to identify new warning signs not detected with previous databases.
Finally, our models selected only two warning indicators when predicting three years. In this case, profitability and net profit margin. However, few early warning systems and academic studies have addressed prediction at times so far from the insolvency situation, even fewer for European companies.
7. Conclusion
This study contributes to knowledge about early warning tools by developing models with a high capacity to predict insolvency in European countries. Data from a sample of 8,400 companies that have carried out their activities in Germany, France, Italy, and Spain have been used, and different machine-learning techniques have been applied.
The results confirm the outstanding ability of the most complex and non-linear machine learning models to capture patterns and relationships in financial data, providing more precise and reliable warning systems. In this sense, the CNN-LSTM model stands out in most cases studied, with accuracy rates exceeding 98% one year before the insolvency situation, 96% two years before, and 94% three years before. Furthermore, this CNN-LSTM model offers an excellent combination of sensitivity and specificity, far surpassing the results obtained by early warning systems and previous studies on insolvency prediction in Europe.
In addition to the model's predictive accuracy, a detailed analysis of the thirteen variables used reveals important findings into the factors contributing to insolvency prediction. Among the variables, liquidity (V3), net profit margin (V8), and profitability on assets (V9) consistently demonstrated high significance, particularly in the short-term predictions (t-1). These findings align with previous studies, such as Cultrera and Brédart (2015), who emphasized the importance of profitability and liquidity as early warning indicators. Furthermore, debt repayment capacity (V13) emerged as a critical factor, reinforcing its role in the models as highlighted by Fernández et al. (2020). These variables indicate that companies struggling with short-term liquidity and profitability face higher risks of insolvency. Our findings not only confirm the relevance of these variables but also suggest that models incorporating these indicators offer more precise predictions of financial distress, underscoring the importance of aligning variable selection with robust economic theory and prior empirical research. By further examining the variable importance, we strengthen the interpretability of the models and their applicability in real-world insolvency prevention systems.
Given the results obtained here, Directive 2019/1023 presents an ideal opportunity to improve the European bankruptcy system. It is essential to use this opportunity to integrate robust early warning systems because the Directive requires them and is a necessary tool for business viability. Implementing the alert system proposed in this work would considerably improve the efficacy of the European bankruptcy system by allowing more companies to receive timely help to resolve their financial problems.
Along with the above, a crucial aspect to consider when designing an early warning system is the tendency of entrepreneurs to underestimate the risk of insolvency of their companies and only request help until it is too late. To help facilitate timely intervention, the alert system will need to operate proactively without depending on the initiative of business owners. The most common early warning systems in European countries are based on the intervention of external auditors or automated prediction tools to identify the risk of insolvency. Among these approaches, automated prediction stands out for its scalability, low cost, and high predictive capacity.
The findings from this study have significant practical implications for improving financial oversight and insolvency prevention within the regulatory frameworks of EU Member States. The high predictive accuracy of the proposed models, which offer early warnings up to three years in advance, can be instrumental in guiding regulators to implement more proactive monitoring systems. By integrating these enhanced early warning tools, regulators can better identify companies at risk of insolvency, allowing for timely interventions that promote business continuity and prevent financial crises. Additionally, these insights align with the goals of Directive 2019/1023, encouraging the adoption of more robust and reliable models across Europe. The implementation of these advanced models into regulatory practices can help streamline the restructuring processes, reduce insolvency rates, and ultimately foster a more resilient business environment.
The above conclusions suggest future lines of research. Although the models developed in this study have proven to be robust and highly accurate with data from the central European countries, it would be interesting to keep them updated with the latest advances in artificial intelligence to ensure their effectiveness in the long term. Likewise, future studies could verify the models developed here with data from companies in other national contexts not considered in the present study. Thus, comparative studies allow for more integrated reflections on the effectiveness of the early warning system for the entire EU..

