


 Inglês (pdf)
 Artigo em XML
 Referências do artigo
 Enviar este artigo por email
 Citado por SciELO
  Similares em
SciELO
Similares em
SciELO 
 Permalink
1. Introduction
In this article a case study is presented, carried out within the scope of a master’s degree in health services management at the University of Trás-os-Montes and Alto Douro (UTAD) by means of an action research model (ARM) and following a mostly quantitative approach.
It is focused on the application of the time-driven activity-based costing (TDABC) model to determine the costs of computed tomography (CT) exams in the Imaging Department of the Hospital Centre of Trás-os-Montes and Alto Douro (CHTMAD), Portugal.
The viability of organizations requires efficient supervision and control of the costs inherent to their operation. Entities linked to the provision of services (such as health services), in a constantly changing environment and involving a large amount of costs, can greatly benefit from the implementation of costing models that allow more correct cost handling.1
The use of management accounting tools provides information about budgeting, planning, control, decision-making and possible changes in internal procedures.2 As an example of the variability of health services provision costs, the same medical act in different patients can have very different costs, contrary to a standard industrial product. Health costs also have enormous international variability which needs to be considered.3
Worldwide health expenditure is a major concern and is seen has a necessity rather than a luxury.4 In Portugal, the total expenses of the national health service have undergone enormous growth, from around 219 million euros in 1980 to around 11,680 million euros in 2020.5
To encourage an efficient and rational use of resources, the official accounting plan of the Ministry of Health stated in 2007 that all national health departments were obliged to implement an analytical accounting plan for public hospitals.6 Later, in 2015, this demand was superseded by the accounting standardization system for public administration.7 It mentions the importance of applying management accounting systems in the health sector, particularly the use of more accurate costing methods.
The purpose of this paper is to apply an analytical accounting tool (TDABC) and confirm its role in decision-making in the management of public health institutions in general and in the CHTMAD Imaging Department in particular.
The ARM approach is intended to act on relevant pragmatic aspects of integrated situations (of which the researcher himself is an integral part) as well as to create knowledge about that action.8 It is an iterative process of data collection, use, analysis, planning, performance, and evaluation. Knowledge is acquired through a reflective exercise throughout this process.
The TDABC method was developed in 1997 at Acorn Systems, Inc. by Steven Anderson, who worked with Robert Kaplan in 2007 to extend it.9,10 Its origins are in the activity-based costing (ABC) method, which had already made it possible to attribute costs to products/services through the resources consumed by their generating activities and was highly suitable for implementation in healthcare institutions.11 TDABC is an improvement on the previous method, as it is a less time-consuming process. It is differentiated from ABC by its temporal orientation; the elimination of employee interviews; the selection of costs applied according to the rate and activities used; and the incorporation of changes in the use of resources by different transactions.12 However, estimates of the two TDABC parameters (time and cost per minute) may be incorrect, which may result in significant deviations in the calculation of costs attributed to products/services.13
TDABC is an economical, fast model for presenting information on cost and profitability, and all information services within the organization can benefit from its application in specific areas such as ordering, processes, supply chains, products/services, and customers.11,14The detailed reports on costs and profitability per customer, product and supplier constitutes a notable example of the results obtained from the application of the model.15 Since it gives organizations pragmatic knowledge of the cost and capacity usage derived from their processes and profit, both from orders and from products and/or customers, process priorities can be defined, products/services rationalized and customer relationship management optimized.9
However, TDABC does not identify the activities and the respective resources consumed;9 it calculates the cost rate only with data from the model, similar to those used in traditional systems of cost accounting.11 In a nutshell, when costing is based on the time of activities, costs are allocated according to the total time of activities, depending on the parameters: the cost per unit of time (total group expense divided by total hours of work) and the use of time per activity.16 An estimation of the time to perform a given task is required, which may vary according to specific characteristics. For example, the time allocated to the activity “processing the customer's order” may vary according to the nature of the order.9 The TDABC model mimics the real processes used in the execution of work within the organization.
2. Methods
Taking the characteristics and specificity of the medical imaging area into consideration and knowing the potential of the TDABC costing method, the present study focuses on the implementation of the TDABC methodology to assess the costs of non-urgent CT scans performed at the CHTMAD Imaging Department in outpatients. The application of the method included a qualitative and quantitative analysis, by means of direct observation of the activities carried out by those involved in the examination process, and the consultation of internal documentation, including accounting documents, collection of data on the cost of consumed resources, quantity and price, among others. Quantitative analysis involved follow-up and measurement of the times needed to carry out the activities involved in the circuit of exams and subsequent data processing.
In the implementation of TDABC, the following steps were taken: identifying the conditions for the study, defining the value chain, developing the process map, estimating the time for each process, gathering data on the costs of the resources, calculating the capacity rate cost, and calculating the total cost. Each step will be described in detail below.
2.1. Steps in TDABC implementation
2.1.1. Identification of study conditions
The application of the costing method focused only on non-urgent CT studies carried out in the context of outpatients at the Vila Real Unit of the Hospital Centre of Trás-os-Montes and Alto Douro (CHTMAD).
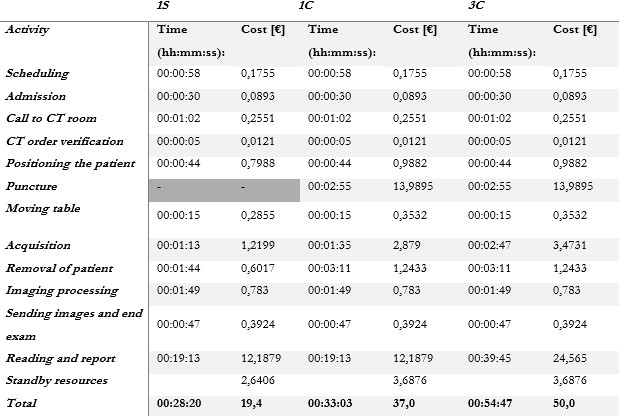
During data collection, there was a need to differentiate between three sub-case studies, namely: 1S - acquisition of a scan of only one anatomical area in the same patient (e.g. skull, neck, thorax, abdomen, (…)) without administration of venous contrast, 1C - acquisition of a scan of an anatomical area in the same patient with venous contrast and 3C - acquisition of scans of three anatomical areas in the same patient, with venous contrast. Only exams with one acquisition after contrast were included, mainly portal venous phase only.
2.1.2. Definition of the value chain
All costs incurred in clinical and administrative processes were identified.16 After surveying the resources used, they were grouped into three types: equipment (which includes CT equipment), consumable materials (disinfectants, contrast media, envelopes, (...)) and personnel resources (staff).
2.1.3. Development of the process map
The process map includes all the activities included in the CT exam process cycle, allocating the activities by locations and participants (Fig. 1).
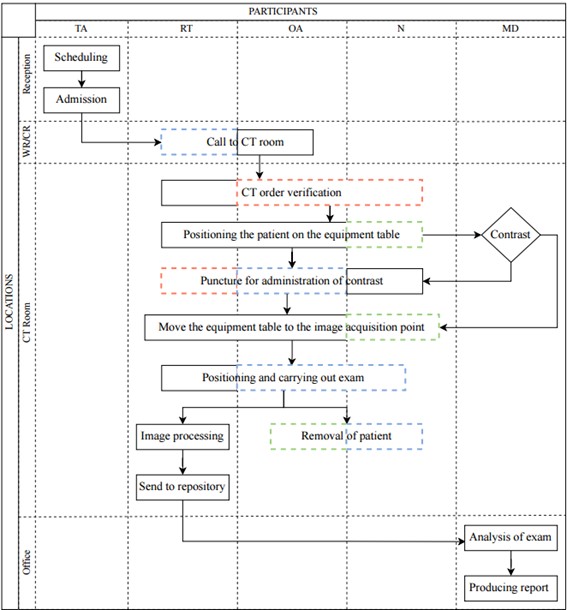
Figure 1: CT exam scan cycle. Legend: T.A. - technical assistant; R.T. - radiology technician; O.A. - operational assistant; N. - nurse; M.D.- medical doctor; W.R. - waiting room; CT R. - CT room; dashed lines - standby activities.
The differentiation between contrast and non-contrast CT scans should be considered, noting that the former requires the assistance of a nurse. It is also discerned when personnel staff are present, but do not directly interfere with activities (dashed lines). A red dashed line represents staff exclusively on standby and who could potentially be released for another activity. In the cases of personnel allocated to only a specific subcase, the green dashed line is shown. Blue corresponds to staff that does not interfere directly in the activity but cannot be dismissed, mainly for safety reasons (e.g., the presence of the nurse after the puncture and administration of contrast to safeguard the eventuality of any adverse reaction to the contrast media). Medical presence was neglected during exam acquisition due to usual concomitant reporting activity. Interruption during reporting, due to protocols or safety procedure questions, were also accounted for in reading and reporting time measurements. To account for the patient circuit, only one exam is considered.
We can define two subcircuits. The first corresponds to the exams executed, which ranges from “scheduling” to “processing images and sending them to the repository” in parallel with “withdrawing the user”. The second corresponds to the exams analysed, which includes “exam reading” and “producing a report”.
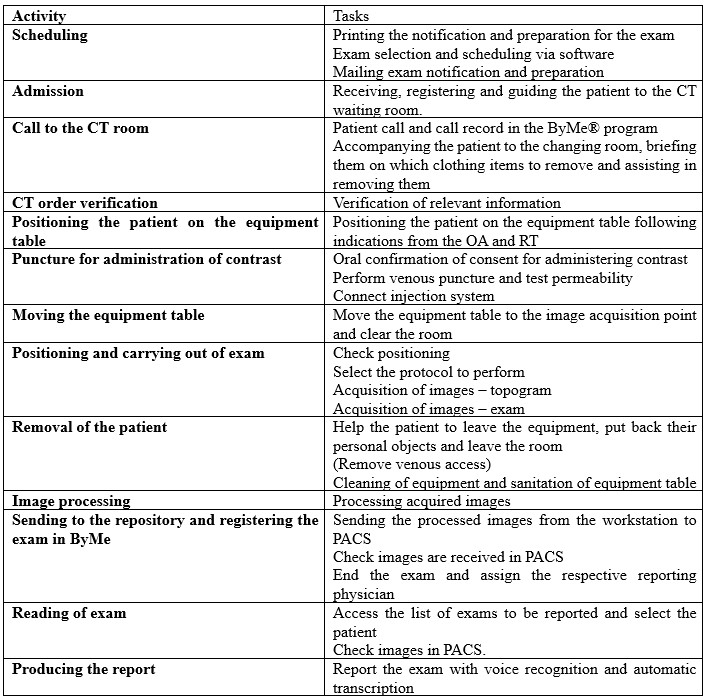
The activities included in the whole process are listed below in Table 1, indicating all tasks involved.
2.1.4. Estimation of the time for each process
On a typical 12-hour day of work (with two successive six-hour shifts without a break), around 50 sections (segments) of exams are performed, and around 30 are analysed. In the case of the exams for analysis, the remainder are generally subcontracted externally. It should be noted that the allocation of each slot is made by segment or anatomical section; that is, in the limit case that all the allocated exams are of one section (either 1S or 1C), the 50 exams are performed (with one section each) and 30 exams are analysed. In the other limit case, of all exams being three sections, 17 exams (50/3) will be performed, and 10 exams (30/3) analysed. In practice, a variable distribution of exams is performed daily between 1S, 1C and 3C depending on the demand of the institution. To determine the total times of the activities, a time measurement of each task included was performed in loco. Considering a confidence level of 95% and a sampling error of 10%, a sample of 34 measurements for each of the tasks described was performed (Appendix 1: https://bit.ly/40X8jCH). Total circuit time was calculated based on overall average task time measures of each activity.
2.1.5. Gathering costs of resources
To calculate the costs of the resources involved, tangible fixed assets were not considered, such as office supplies and waste bins, since they were acquired more than five years ago and had already surpassed the period of total depreciation. Also withdrawn were the so-called “supply and external services” (SES): electricity for lighting spaces, water, and internet since they are shared by several departments and represent a residual value.
Costs of the equipment resources type were determined considering the acquisition cost (accounted for through depreciation), energy cost resulting from the operation and licenses when applicable. The remaining potential cost components such as maintenance and other consumables were considered negligible. Printing service is acquired on a rental basis. When the cost amounts cover the entire department, a direct proportion is considered between the total for the exams and the number of CT exams, (which correspond to about 5.4% of the total exams performed in the Imaging Department), used to estimate the printer service and the license for the Sectra software. The unit cost of €0.1028/kWh (determined by institutional data) was used to determine the cost of electricity for a given item of equipment (Appendix 2: https://bit.ly/3CPGZME).
In the case of consumable resources, the unit value per exam was used (annual cost of the resource divided by the number of exams). It was also assumed that the number of resources used is similar, regardless of the type of examination (one section, three sections, with and without contrast). A zero-value cost was used for certain resources, namely: tourniquets, disinfectants, cotton, syringes and extenders, due to their negligible value. Estimation of the unit value of venous contrast media was based on 2021 institutional data: 11.09 € per contrast exam (annual contrast cost/CT contrast performed exams). Calculated value was slightly smaller than calculating cost per ml (2021 reference price) and average of 110ml per patient (12.98€) (Appendix 3: https://bit.ly/4fwS1oG).
To determine the annual staff costs, the hours of the respective shift were multiplied by the number of working days in the year and by the cost per hour of each type of staff member. All institutional costs were included, and costs per hour were standard initial career path based. Only medical presential reading was included in the study, no additional costs were included (teleradiology, extra shift or supplementary hours not included): OA: 253*12*€5.84, TA: 253*10*€6.25, nurse: 253*12*€9.99, RT: 253*12*€9.99 and MD: 253*12*€19.92 (Appendix 4: https://bit.ly/3AHws5P).
2.1.6. Calculation of the capacity rate cost
To establish the cost per minute (€/min), the annual cost was divided by the respective practical capacity. In determining the annual theoretical capacity, the 2021 working calendar was considered, with 253 working days and corresponding to the opening hours, i.e., for the locations CT room and office with times from 8:00 am to 8:00 pm, 12 hours are counted; on the other hand, the reception is open from 8:00 am to 6:00 pm, counting 10 hours per day. The values per minute are found by multiplying by 60, resulting in 182,160 minutes for the CT room and the office and 151,800 minutes for the reception. To determine the practical capacity, 65% of the theoretical capacity values were considered for all cases (obtained from the mean value referring to the hypothetical performance of only longer to perform exams (1C) or faster exams (3C)).
2.1.7. Calculating total cost
Once the cost per minute was acquired for each resource, the time determined for each task was multiplied by that value. All costs were determined and summed up initially by task, then by activity and finally by circuit.
Resources that remained on standby during the patient circuit, despite not being directly used in activities, were also included. These are mostly of the personal type. Standby equipment resources include CT and air conditioning.
3. Results
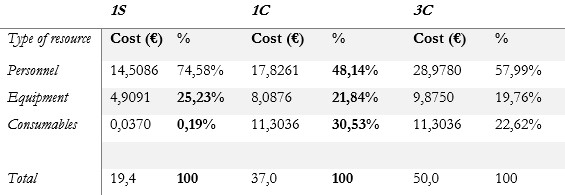
3.2. Per resource type
There was a significant variation in the distribution of percentages by type of resource in the different subcases. The percentages of costs in the circuit, allocated to the different types of resources: personnel, equipment and consumables were 74.58%, 25.23% and 0.19% in subcase 1S; 48.14%, 21.84% and 30.53% in subcase 1C and finally 57.99%, 19.76%, 22.62% and in subcase 3C (table 3).
4. Discussion
The value obtained for the total cost of the patient circuit was lower than that obtained in most studies where the same method (TDABC) was applied. In a study in the USA, the value of a CT study (one section with contrast - 1C) was around $55 USD, despite taking the average time to perform as in our study (about 30 minutes).17 18These cost variations may be mainly due to the salary differences in professional classes. The American context represents a much higher hourly rate than the case presented here, reinforcing the need to consider the great variability in health costs between different countries.3 On the other hand, regarding the percentage distribution of costs, the data obtained are in line with those described in the literature where personnel costs also account for the highest percentage of costs.18,19,20,21,22,23,24,25 The increase in the cost of consumable resources for subcases 1C and 3C (mainly due to the inclusion of the contrast media value), is similar to that reported in another study which focused on assessing the cost savings associated with an institutional policy change in the criteria for administration of oral contrast.26
The present study deals with three subcases in which there is an important percentage variation in resources: 1S vs 1C vs 3C, with a differentiation factor allowing comparison of parameters with/without contrast and number of sections.
An improvement in internal processes is also expected, since areas without added value and potential improvements were identified: the possibility of optimizing slots for scheduling exams with and without contrast in independent shifts (leading to the profitability of human resources; defining a specific allocated space to place the puncture material (which would allow the equipment to be more efficient with the possibility of allocating more studies); the possibility of having self-cleaning equipment; automating confirmation of contrast details; and promoting a paperless policy (to reduce installed printing capacity). Another immediate observation was that the acquisition of three segments from different patients is not equivalent to the acquisition of three segments from the same patient. It is assumed that 3C is three times the value of 1S, when it is about 193.36% of the time and 257.01% of the cost. The current practice of allocating three slots/charging 300% to 3C is largely overrated. A simplified model process map, not accounting to daily interruption (e.g. due to limited patients’ mobility or contrast reaction) may justify the lower cost. Medical presence during acquisition or interruptions due to second readings, technical software problems or consulting literature to conclude the report were also not included and can contribute to diminishing total cost calculation, as it does not reflect the daily practice, but the ideal optimized reading circuit instead. Pre-scheduling exams cancelation due to contraindications or clinical unnecessary prescription can also contribute to increased costs and were not included in the study.27 Optimized prescription (including additional medical approval - radiologist M.D. of the department) not only avoids inadequate radiation exposure as it contributes to costs control and is nowadays recommended.28 Another study limitation, was that personnel cost only included the lowest price hour value of each personnel category not including internal and external institutional staff contractual variations.
To extend this approach to other circuits of the department and become a recurring tool for the use of cost control and analysis, combining data collection with a development framework is recommended, thus allowing aggregation of acquired data. A matrix of tasks and resources could be included in its construction, to immediately visualize the resources involved in the circuit and ascertain which potential resources are on standby.28,29,30Another improvement would be a data collection form that does not interfere with activities and at the same time does not violate the General Data Protection Regulation (GDPR),30,31,32as well as some automated form of time measurement.
5. Conclusion
Application of the TDABC method allowed a more reliable representation of the real cost of the chain of processes involved in carrying out CT scans. However, meticulous acquisition of values becomes time-consuming and prone to errors when carried out manually.
Application only in a single centre of the public health sector is a limitation of the study. Its reproducibility is limited when applied to other centres, therefore, and always requires adaptation due to the specificity and enormous variability of processes and costs between institutions. Carrying out multicentre studies would also allow comparison of data between institutions in different sectors (public and private) at a national level and would be an added value for determining the average real cost of these processes, enabling the allocation of more appropriate market values.
Therefore, this report contributes to validating the application of TDABC in a healthcare institution, but it also contributes to raising awareness of the importance of cost control in healthcare services.

